This comprehensive analysis explores Enzyme (MLN) token's price trajectory and investment potential from 2026 through 2031, providing professional forecasts for DeFi asset management infrastructure investors. The article examines MLN's current market status—trading at $4.64 with a $13.88M market cap and 71.07% annual decline—alongside historical price evolution and market sentiment indicators showing extreme fear conditions. Core sections include detailed price forecasts across conservative, neutral, and optimistic scenarios, with 2031 projections reaching $11.50 under transformative conditions. The guide delivers actionable investment strategies for beginners through institutional investors, covering long-term holding, active trading, and risk management frameworks on Gate.com. Additionally, it addresses regulatory, technical, and liquidity risks while analyzing MLN's competitive positioning within the DeFi ecosystem, empowering readers to make informed decisions on this specialized infrastructure token.
Introduction: MLN's Market Position and Investment Value
Enzyme (MLN) serves as a utility token powering the Enzyme protocol, designed to facilitate on-chain asset management within the DeFi ecosystem. Since its launch in 2017, the project has established itself as a platform enabling users to build, share, and explore DeFi investment strategies through vault structures. As of January 25, 2026, MLN maintains a market capitalization of approximately $13.88 million, with a circulating supply of around 2.99 million tokens, and is currently priced at $4.64. This asset, recognized for its role in decentralized asset management, continues to serve a specialized function within the DeFi infrastructure landscape.
This article will comprehensively analyze MLN's price trajectory from 2026 through 2031, examining historical patterns, market supply-demand dynamics, ecosystem developments, and macroeconomic conditions to provide investors with professional price forecasts and practical investment strategies.
I. MLN Price History Review and Market Status
MLN Historical Price Evolution Trajectory
- 2018: MLN reached its all-time high of $258.26 on January 4, with significant price fluctuations during this period
- 2020: The token hit its all-time low of $1.79 on March 13, representing a substantial decline from previous peaks
- 2025-2026: The price experienced a notable downturn, declining 71.07% over the past year, from approximately $16.05 to the current level
MLN Current Market Status
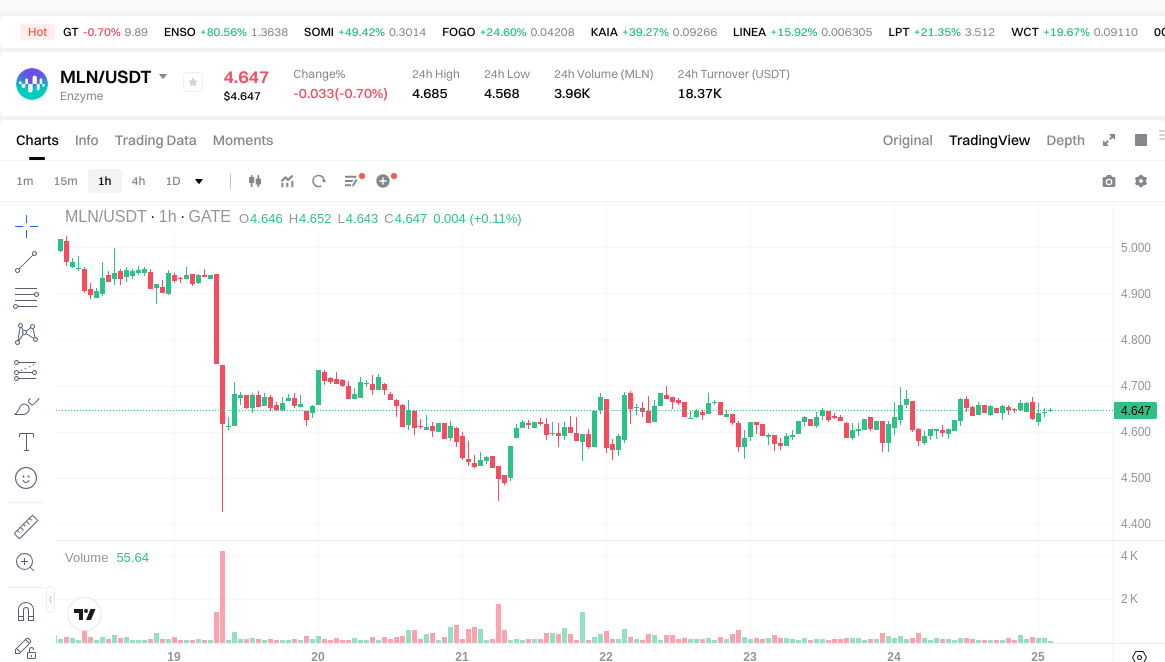
As of January 25, 2026, MLN is trading at $4.644, showing a modest decline of 0.55% over the past 24 hours. The token's 24-hour trading range has been between $4.568 and $4.685, indicating relatively stable short-term price action.
The recent price performance shows mixed signals across different timeframes. While the 1-hour period reflects a slight increase of 0.0079%, the broader trend remains negative with a 6.93% decline over the past week and a 5.46% decrease over the past 30 days. The most significant metric is the annual performance, which shows a 71.07% decline, reflecting broader market challenges and shifting sentiment in the DeFi asset management sector.
MLN's current market capitalization stands at approximately $13.88 million, with a circulating supply of 2,988,287.87 tokens, representing nearly 100% of the total supply. The token ranks 1044th in the cryptocurrency market, holding a 0.00043% market share. With 24-hour trading volume of $18,388.63, the token maintains modest liquidity across 19 exchanges.
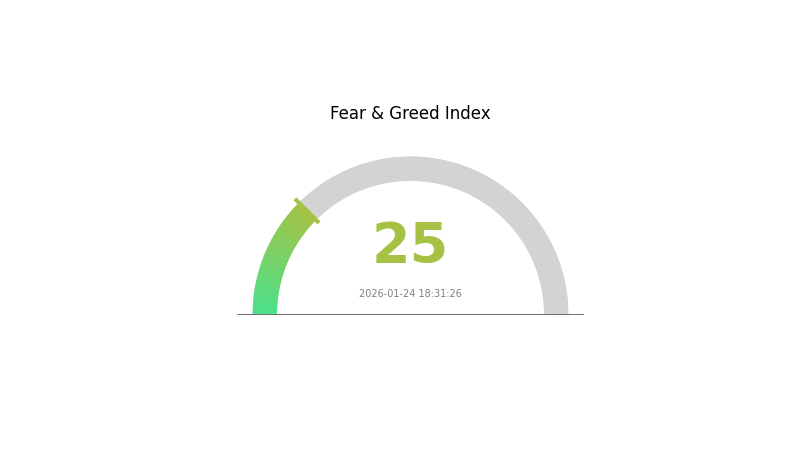
The market sentiment indicator shows a reading of 25, categorized as "Extreme Fear," suggesting cautious investor attitudes in the current environment. The fully diluted valuation remains aligned with the current market cap, indicating that virtually all tokens are already in circulation.
Click to view the current MLN market price
MLN Market Sentiment Indicator
2026-01-24 Fear and Greed Index: 25 (Extreme Fear)
Click to view the current Fear & Greed Index
The MLN market is currently experiencing extreme fear, with the fear and greed index hitting 25. This indicates significant market pessimism and risk aversion among investors. During such periods, market volatility typically increases, and prices may face downward pressure. However, extreme fear often presents contrarian opportunities for long-term investors, as assets may be undervalued. Traders should exercise caution and avoid panic selling, while considering the potential for recovery when market sentiment stabilizes. Monitor Gate.com for real-time market data and sentiment analysis to make informed trading decisions.
MLN 持仓分布
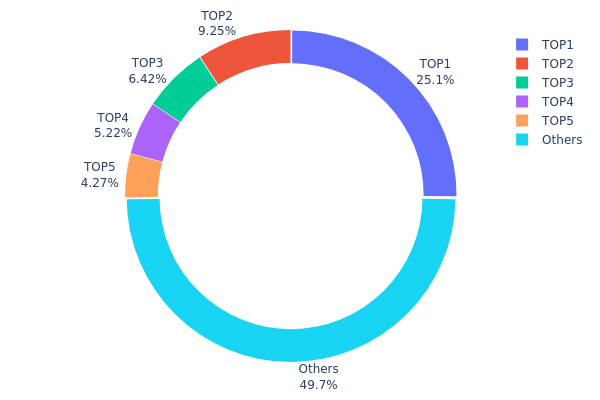
The address holding distribution chart illustrates how MLN tokens are allocated across different wallet addresses in the network, serving as a key indicator of token concentration and decentralization level. By analyzing the distribution pattern, we can assess whether the token supply is controlled by a few large holders or more evenly distributed among the community.
Based on current on-chain data, MLN exhibits a moderate level of concentration. The top address holds approximately 745.32K tokens (25.14% of total supply), while the top five addresses collectively control 1,491.03K tokens, accounting for 50.28% of the circulating supply. The remaining 49.72% is distributed among other addresses, suggesting a relatively balanced structure compared to highly concentrated projects where top holders often exceed 70-80% ownership.
This distribution pattern indicates a dual characteristic in MLN's market structure. On one hand, the presence of significant large holders provides a certain degree of price stability and long-term commitment to the project. On the other hand, the substantial 49.72% held by diverse participants demonstrates meaningful community participation and reduces the risk of single-entity manipulation. However, investors should note that the top address's 25.14% holding still represents considerable influence over market dynamics, potentially impacting liquidity and price volatility during large-scale transactions. Overall, MLN maintains a reasonably decentralized on-chain structure that supports organic market development while preserving engagement from major stakeholders.
Click to view current MLN holding distribution
| Top |
Address |
Holding Qty |
Holding (%) |
| 1 |
0xf977...41acec |
745.32K |
25.14% |
| 2 |
0xa6a6...a1fd37 |
274.05K |
9.24% |
| 3 |
0x1c36...37d2c7 |
190.18K |
6.41% |
| 4 |
0xa64e...24f61d |
154.82K |
5.22% |
| 5 |
0xd2dd...e6869f |
126.66K |
4.27% |
| - |
Others |
1472.89K |
49.72% |
II. Core Factors Influencing MLN's Future Price
Based on the currently available information, there is insufficient data to provide a comprehensive analysis of the core factors that may influence MLN's future price movements. The reference materials do not contain specific details regarding supply mechanisms, institutional dynamics, macroeconomic correlations, or technical developments related to MLN.
For a thorough assessment of MLN's price drivers, readers are encouraged to monitor official project announcements, on-chain metrics, and relevant market developments as they become available.
III. 2026-2031 MLN Price Forecast
2026 Outlook
- Conservative forecast: $2.83 - $4.65
- Neutral forecast: Around $4.65
- Optimistic forecast: $5.95 (requires favorable market conditions and increased adoption)
2027-2029 Mid-term Outlook
- Market stage expectation: MLN may enter a phase of steady growth with gradual price appreciation, potentially benefiting from broader DeFi ecosystem development and institutional interest in asset management protocols
- Price range forecast:
- 2027: $4.13 - $6.57, representing approximately 14% growth
- 2028: $4.87 - $6.65, showing cumulative growth of around 27%
- 2029: $4.53 - $9.18, with potential upside reaching 35% under favorable conditions
- Key catalysts: Enhanced protocol adoption, strategic partnerships, technological improvements in the Melon ecosystem, and overall cryptocurrency market recovery cycles
2030-2031 Long-term Outlook
- Baseline scenario: $7.19 - $7.74 (assuming moderate market growth and sustained protocol development)
- Optimistic scenario: $8.39 - $9.05 (requires significant ecosystem expansion and increased institutional adoption)
- Transformative scenario: Up to $11.50 (contingent upon exceptional market conditions, major protocol upgrades, and widespread DeFi integration)
- 2026-01-25: MLN trading within established range as market participants assess long-term growth potential
| Year |
Predicted High Price |
Predicted Average Price |
Predicted Low Price |
Price Change |
| 2026 |
5.94816 |
4.647 |
2.83467 |
0 |
| 2027 |
6.569 |
5.29758 |
4.13211 |
14 |
| 2028 |
6.64528 |
5.93329 |
4.8653 |
27 |
| 2029 |
9.18236 |
6.28929 |
4.52829 |
35 |
| 2030 |
9.05091 |
7.73582 |
7.19432 |
66 |
| 2031 |
11.49891 |
8.39337 |
5.03602 |
80 |
IV. MLN Professional Investment Strategy and Risk Management
MLN Investment Methodology
(1) Long-term Holding Strategy
- Target Investors: DeFi-focused investors seeking exposure to asset management infrastructure
- Operational Recommendations:
- Establish position during market corrections when MLN price approaches support levels around $4.50
- Consider dollar-cost averaging approach to mitigate volatility risk, given the token's -71.07% annual decline
- Storage Solution: Utilize Gate Web3 Wallet for secure custody with multi-signature functionality
(2) Active Trading Strategy
- Technical Analysis Tools:
- Support and Resistance Levels: Monitor the 24-hour range between $4.568 (low) and $4.685 (high) for short-term entry points
- Volume Analysis: Track the 24-hour trading volume of $18,388.63 to identify accumulation or distribution patterns
- Swing Trading Considerations:
- The -6.93% weekly decline suggests potential oversold conditions for contrarian positions
- Set stop-loss orders below the $4.50 level to manage downside risk
MLN Risk Management Framework
(1) Asset Allocation Principles
- Conservative Investors: 1-2% portfolio allocation given high volatility and significant annual decline
- Aggressive Investors: 3-5% allocation for those with higher risk tolerance and DeFi sector conviction
- Professional Investors: Up to 8% allocation with active hedging strategies and sector rotation management
(2) Risk Hedging Solutions
- Portfolio Diversification: Balance MLN exposure with established DeFi blue-chip tokens to reduce protocol-specific risk
- Position Sizing: Limit single position to no more than total acceptable loss, considering MLN's 82.02% decline from all-time high of $258.26
(3) Secure Storage Solutions
- Hot Wallet Recommendation: Gate Web3 Wallet for active trading and liquidity provision needs
- Cold Storage Solution: Hardware wallet storage for long-term holdings exceeding 6-month investment horizon
- Security Precautions: Verify contract address (0xec67005c4e498ec7f55e092bd1d35cbc47c91892) before transactions and enable two-factor authentication
V. MLN Potential Risks and Challenges
MLN Market Risks
- Price Volatility: The token has experienced substantial price fluctuations, with a -71.07% decline over the past year, indicating significant market volatility
- Liquidity Concerns: With a relatively modest 24-hour trading volume of $18,388.63 and market cap of $13.88 million, liquidity constraints may impact large position exits
- Market Sentiment: The 0.00043% market dominance reflects limited mainstream adoption, potentially affecting price stability during market stress
MLN Regulatory Risks
- DeFi Compliance Uncertainty: Evolving regulations around decentralized asset management platforms may impact protocol operations and token utility
- Securities Classification Risk: Asset management tokens may face scrutiny regarding securities law compliance in various jurisdictions
- Cross-border Regulatory Challenges: The global nature of DeFi platforms creates exposure to multiple regulatory frameworks with varying enforcement approaches
MLN Technical Risks
- Smart Contract Vulnerability: As an Ethereum-based protocol facilitating asset management, smart contract exploits could impact user funds and token value
- Protocol Dependency: MLN utility is tied to Enzyme protocol adoption; reduced platform usage would diminish token demand
- Scalability Limitations: Ethereum network congestion and gas fee volatility may affect user experience and protocol competitiveness
VI. Conclusion and Action Recommendations
MLN Investment Value Assessment
Enzyme (MLN) represents a specialized opportunity within the DeFi asset management infrastructure sector. The token's utility within the Enzyme protocol ecosystem provides fundamental value through vault creation fees and developer incentives. However, the significant -71.07% annual decline and modest market capitalization of $13.88 million indicate substantial challenges in market adoption and price stability. The circulating supply of 2,988,287.87 MLN (99.99% of total supply) suggests minimal future dilution risk. Long-term value proposition depends on increased DeFi asset management adoption and protocol usage growth, while short-term risks include continued price pressure, limited liquidity, and broader market volatility.
MLN Investment Recommendations
✅ Beginners: Limit exposure to 1-2% of crypto portfolio; prioritize education on DeFi asset management concepts before investing; consider starting with small positions to understand protocol mechanics
✅ Experienced Investors: Evaluate MLN as a tactical allocation within diversified DeFi infrastructure portfolio; monitor on-chain metrics including vault creation activity and protocol TVL; implement stop-loss discipline given historical volatility
✅ Institutional Investors: Conduct thorough due diligence on Enzyme protocol fundamentals and competitive positioning; assess liquidity requirements against current trading volumes; consider direct protocol engagement opportunities alongside token position
MLN Trading Participation Methods
- Spot Trading: Purchase MLN through Gate.com with support for 19 exchanges providing price discovery and liquidity options
- DeFi Integration: Participate directly in Enzyme protocol by creating or investing in vaults, generating organic MLN utility demand
- Portfolio Strategy: Incorporate MLN within broader DeFi infrastructure thesis alongside complementary asset management and protocol tokens
Cryptocurrency investment carries extreme risk. This article does not constitute investment advice. Investors should make prudent decisions based on their own risk tolerance and are advised to consult professional financial advisors. Never invest more than you can afford to lose.
FAQ
What are the main factors affecting MLN token price?
MLN token price is primarily influenced by market demand and supply dynamics, overall cryptocurrency market sentiment, project development progress and ecosystem growth, trading volume and liquidity, macroeconomic conditions, and regulatory developments in the crypto industry.
How to conduct MLN price prediction? What are the analysis methods?
MLN price prediction employs technical analysis(examining charts and indicators),fundamental analysis(evaluating project metrics and adoption),on-chain metrics(transaction volume and holder concentration),and market sentiment analysis. Combine these methods for comprehensive forecasting of MLN's price trends.
What are MLN's future price trends and investment prospects?
MLN shows strong fundamentals with growing ecosystem adoption and increasing transaction volume. Analysts project continued upward momentum driven by DeFi expansion and platform upgrades. Long-term outlook remains bullish for committed investors seeking exposure to decentralized asset management.
What are the risks and limitations in MLN price prediction?
MLN price predictions face limitations due to market volatility, unpredictable regulatory changes, and limited historical data. Predictions depend on technical and fundamental analysis accuracy, which can be affected by sudden market sentiment shifts and macroeconomic factors.
MLN demonstrates competitive performance in the DeFi sector. As a governance token for Melon Finance protocol, MLN has shown resilience with steady growth potential driven by protocol adoption and increasing DeFi ecosystem activity. Its price movements reflect underlying protocol fundamentals and market sentiment.
* The information is not intended to be and does not constitute financial advice or any other recommendation of any sort offered or endorsed by Gate.