This comprehensive analysis examines Matrix Layer Protocol (MLP), an AI-driven infrastructure token trading at $0.0005165 on Gate, providing expert price forecasts and investment strategies for 2026-2031. The article combines historical price evolution, technical analysis, and market sentiment indicators to deliver professional predictions ranging from $0.00049-$0.00052 (2026) to $0.00137 (2031 optimistic scenario). Key sections address market risks including extreme volatility, limited liquidity, and concentrated token holdings (top five addresses control 96.85%), alongside technical and regulatory challenges. The guide offers tailored investment methodologies for different investor profiles, comprehensive risk management frameworks, and secure storage solutions via Gate Web3 Wallet. Designed for informed decision-making, this analysis equips investors with actionable strategies while emphasizing inherent cryptocurrency risks and the importance of professional financial consultation.
Introduction: MLP's Market Position and Investment Value
Matrix Layer Protocol (MLP), as an AI-driven communication and infrastructure protocol designed for decentralized network ecosystems, has been making strides in the blockchain space since its launch in 2024. As of 2026, MLP holds a market capitalization of approximately $319,197, with a circulating supply of 618 million tokens and a current price around $0.0005165. This asset, positioned as an innovative solution for multi-dimensional data transmission, is playing an increasingly important role in supporting future communication scenarios such as IoT, Web3, and the Metaverse.
This article will comprehensively analyze MLP's price trends from 2026 to 2031, combining historical patterns, market supply and demand dynamics, ecosystem development, and macroeconomic conditions to provide investors with professional price forecasts and practical investment strategies.
I. MLP Price History Review and Current Market Status
MLP Historical Price Evolution Trajectory
- 2024: Token launched in November at an initial price of $0.01, reaching a peak of $0.077 by December 31st, demonstrating strong early momentum in the market
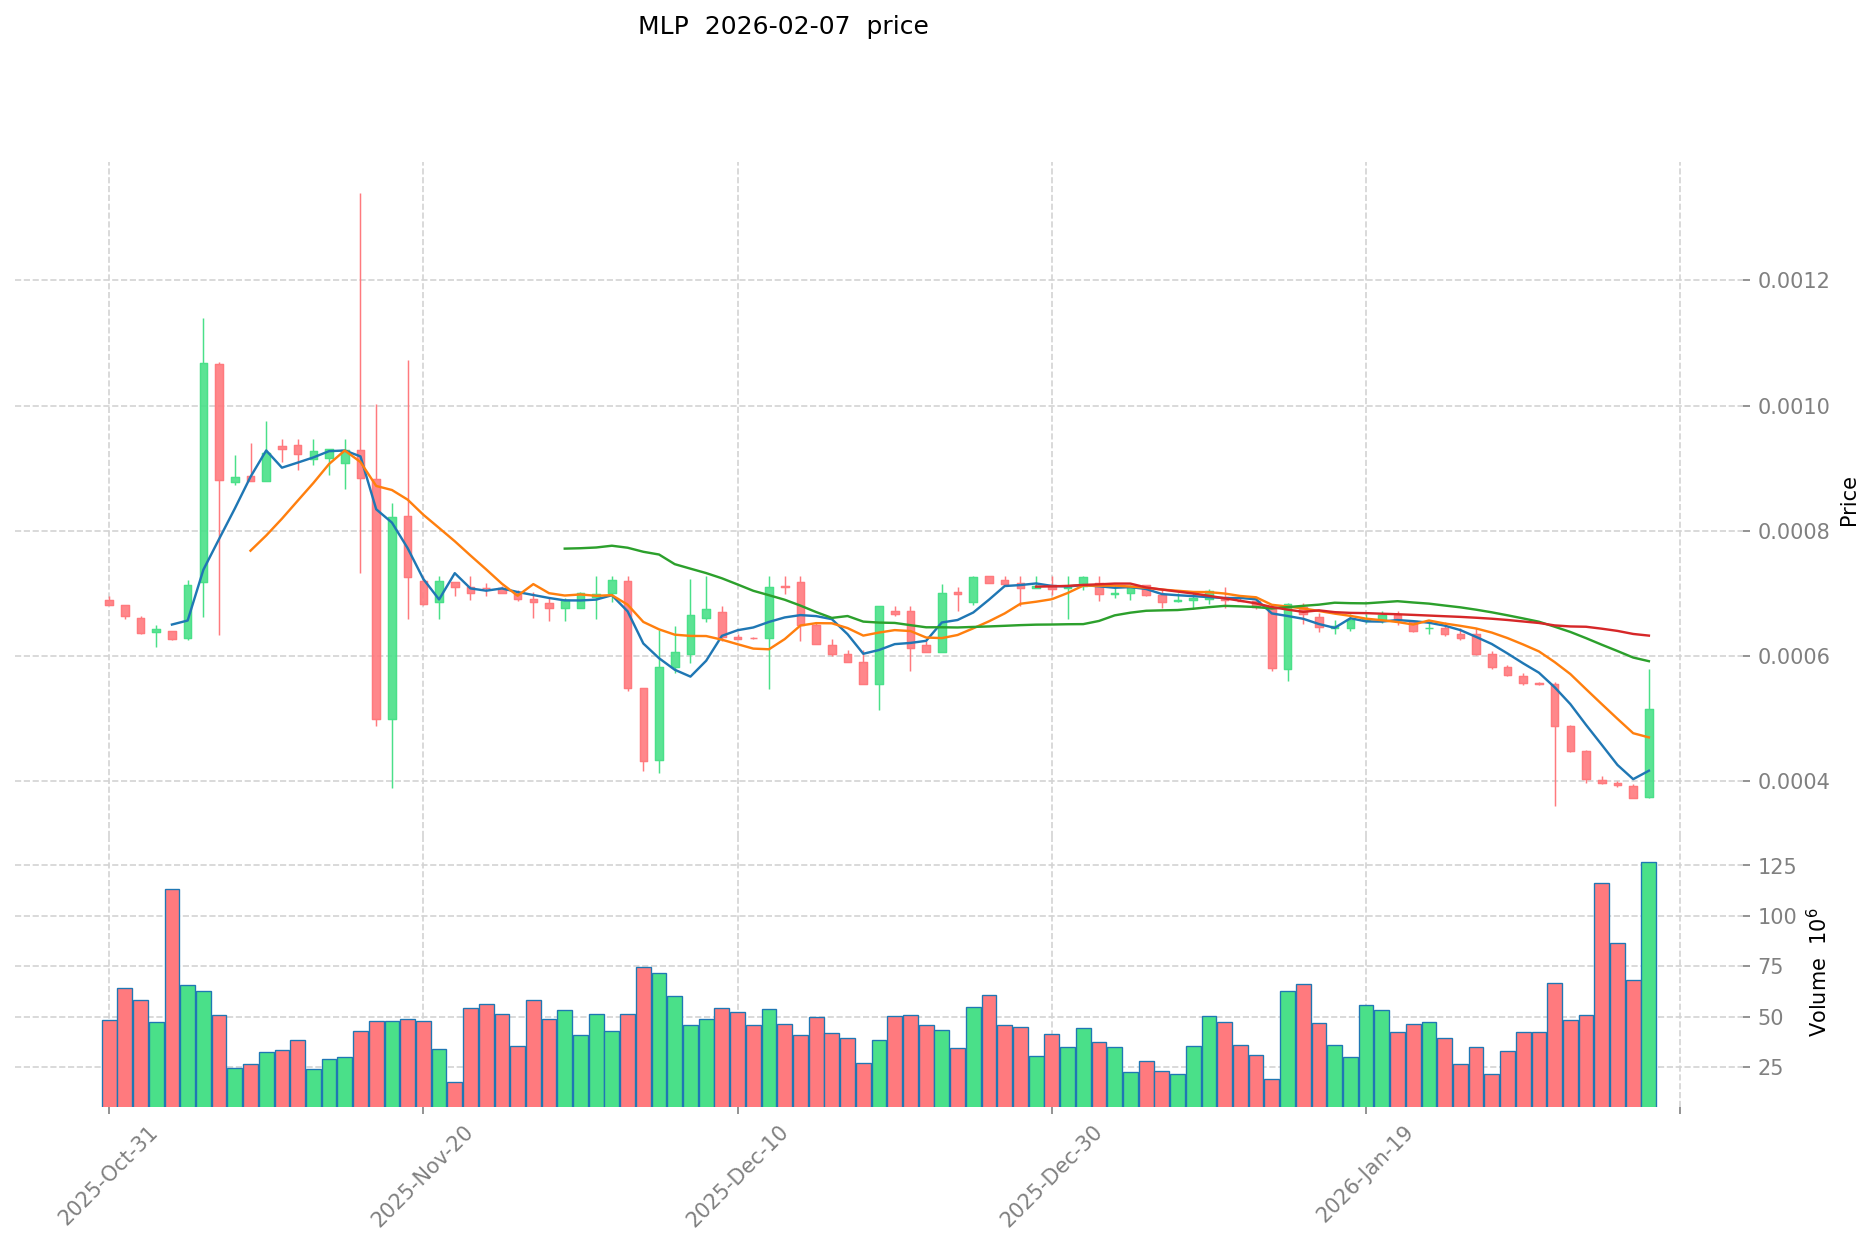
- 2025: Price experienced significant correction throughout the year, declining from December 2024 highs to establish a historical low of $0.00024 in October
- 2026: As of early February, the token trades at $0.0005165, showing a 31.96% increase over the previous 24 hours but remaining substantially below launch levels
MLP Current Market Status
As of February 7, 2026, Matrix Layer Protocol (MLP) is trading at $0.0005165, with a 24-hour trading volume of $39,563.13. The token has displayed mixed short-term performance, gaining 0.38% in the past hour and 31.96% over the last 24 hours. However, longer timeframes reveal continued weakness, with a 4.77% decline over seven days and a 25.24% decrease across thirty days.
The token's annual performance shows a decline of 98.89% from its December 2024 peak of $0.077. Currently, MLP maintains a market capitalization of $319,197 with 618 million tokens in circulation, representing 12.36% of the maximum supply of 5 billion tokens. The fully diluted market cap stands at $2,582,500.
With a market dominance of 0.00010% and a ranking of #3464 across cryptocurrency markets, MLP operates as a relatively small-cap asset within the broader digital asset ecosystem. The token has attracted 15,621 holders and is available on one exchange platform. Market sentiment indicators show extreme fear conditions with a volatility index reading of 6.
Click to view the current MLP market price
MLP Market Sentiment Indicator
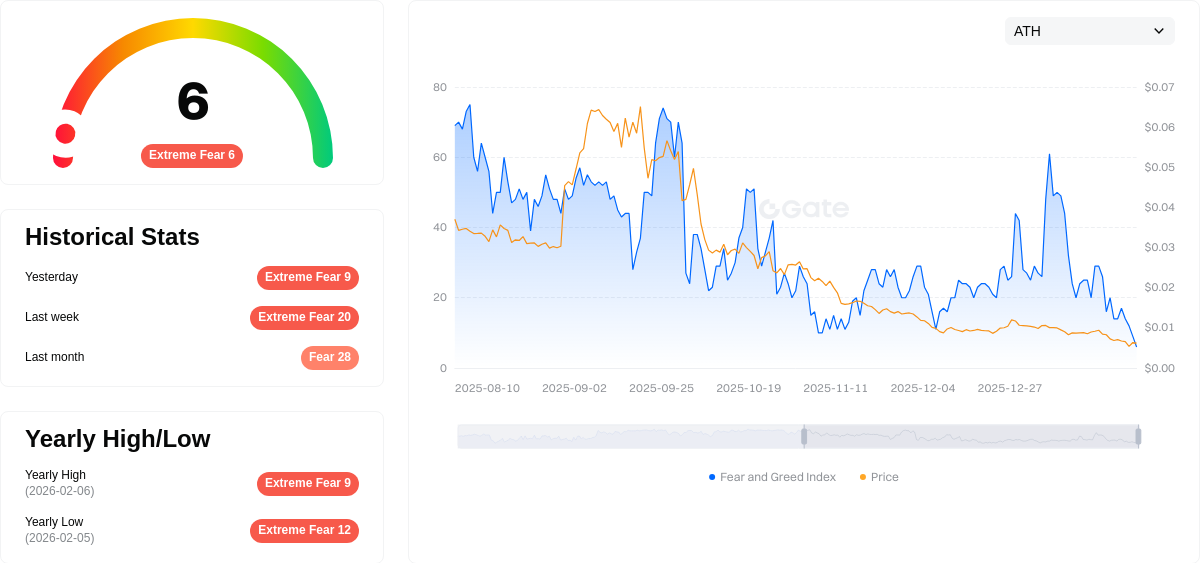
2026-02-07 Fear & Greed Index: 6 (Extreme Fear)
Click to view the current Fear & Greed Index
The crypto market is currently experiencing extreme fear, with the Fear & Greed Index dropping to just 6 points. This exceptional low reading indicates heightened market anxiety and significant pessimism among investors. When the index reaches such extreme levels, it often signals potential oversold conditions. Experienced traders may view this as a contrarian opportunity, as historically, periods of extreme fear have sometimes preceded market recoveries. However, caution remains essential, as further market weakness cannot be ruled out. Investors should carefully assess their risk tolerance and portfolio positioning during such volatile periods.
MLP Holding Distribution
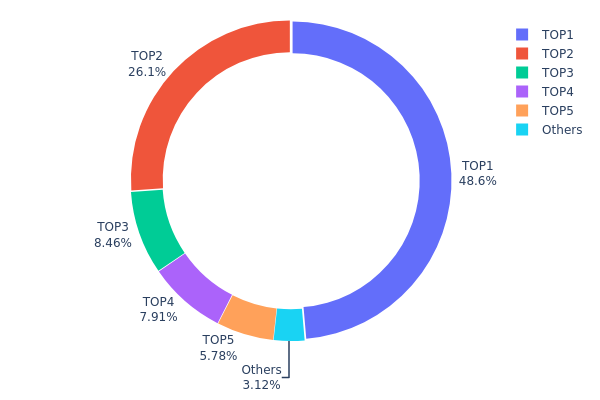
The holding distribution chart illustrates the concentration of MLP tokens across different wallet addresses, providing insights into the asset's decentralization level and potential market dynamics. According to the latest on-chain data, the top five addresses collectively control approximately 96.85% of the total MLP supply, revealing an extremely high concentration pattern. Specifically, the largest holder possesses 48.62% of tokens, while the second and third-ranking addresses hold 26.10% and 8.45% respectively. The remaining addresses outside the top five account for merely 3.15% of circulation.
This highly concentrated distribution structure presents significant implications for market stability and price discovery mechanisms. The dominant position of the top holder, controlling nearly half of the total supply, creates substantial centralization risks. Such concentration amplifies the potential impact of large-scale transactions, as movements from any major holder could trigger considerable price volatility or liquidity disruptions. Furthermore, this distribution pattern suggests limited retail participation and raises concerns about potential market manipulation risks, as coordinated actions among top holders could disproportionately influence price movements.
From a structural perspective, this holding distribution indicates that MLP currently operates with relatively weak decentralization characteristics. The limited token dispersion among a broader holder base suggests the asset remains in its early distribution phase or is primarily held by institutional participants, protocol treasury addresses, or founding team wallets. While concentrated holdings may facilitate governance efficiency in certain protocol designs, it simultaneously constrains organic market development and could deter broader community participation due to perceived centralization risks.
Click to view current MLP Holding Distribution
| Top |
Address |
Holding Qty |
Holding (%) |
| 1 |
0x1434...79475c |
2431382.71K |
48.62% |
| 2 |
0x0d07...b492fe |
1305262.34K |
26.10% |
| 3 |
0x3c5d...f59647 |
422917.96K |
8.45% |
| 4 |
0x456f...5ccf09 |
395467.63K |
7.90% |
| 5 |
0x782d...7d7128 |
289115.61K |
5.78% |
| - |
Others |
155853.75K |
3.15% |
II. Core Factors Influencing MLP's Future Price
Market Sentiment and Technical Analysis
-
Predictive Modeling Approaches: Research indicates that MLP (Multi-Layer Perceptron) models demonstrate strong capabilities in price prediction when combined with technical indicators and historical data patterns. Studies have shown that MLP models can effectively capture complex, non-linear relationships in market data.
-
Technical Indicator Performance: Various technical indicators including momentum, volatility measures, and volume-price correlations serve as key inputs for price forecasting models. The integration of multiple indicator types has proven effective in improving prediction accuracy.
-
Historical Patterns: Historical volatility and momentum effects exhibit clustering phenomena that influence short-term price movements. These patterns, when properly identified through machine learning approaches, can provide valuable signals for price direction.
Volatility and Market Dynamics
-
Implied Volatility Levels: Market volatility characteristics play a crucial role in price formation. Research demonstrates that periods of heightened volatility often precede significant price movements, with prediction models showing improved performance during such periods.
-
Market Structure: The relationship between spot prices and derivative instruments creates interconnected dynamics that impact overall price discovery. Understanding these relationships enhances the ability to forecast near-term price changes.
-
Algorithm Comparison: Studies comparing Random Forest, XGBoost, and MLP models for price prediction reveal that each approach offers distinct advantages. MLP models, particularly when optimized through genetic algorithms (GA-MLP), demonstrate superior performance across multiple evaluation metrics including MSE, MAE, and R² values.
-
Optimization Techniques: The application of genetic algorithms to optimize MLP hyperparameters has shown significant improvements in prediction accuracy, especially in environments characterized by substantial price fluctuations. Optimized models achieve R² values exceeding 0.98 in certain applications.
-
Feature Engineering: The construction of comprehensive feature sets incorporating momentum indicators, volatility measures, and correlation metrics contributes substantially to model effectiveness. Research indicates that 16 distinct features covering various market aspects can significantly enhance predictive power.
Risk Factors and Limitations
-
Model Constraints: Prediction models face inherent limitations related to sample size, data quality, and the assumption of stable market relationships. Small sample problems can reduce model effectiveness, particularly for deep learning approaches.
-
Market Regime Changes: Significant shifts in market conditions may impact model performance, requiring regular recalibration and validation to maintain prediction accuracy.
-
Execution Considerations: While models may demonstrate strong backtested performance, practical implementation faces challenges related to transaction costs, slippage, and the dynamic nature of market microstructure.
III. 2026-2031 MLP Price Forecast
2026 Outlook
- Conservative Forecast: $0.00049 - $0.00052
- Neutral Forecast: Around $0.00052
- Optimistic Forecast: Up to $0.00069 (requires favorable market conditions and increased adoption)
2027-2029 Mid-term Outlook
- Market Stage Expectation: The token may enter a gradual growth phase with moderate volatility, potentially driven by broader market recovery and ecosystem development.
- Price Range Forecast:
- 2027: $0.00047 - $0.00069
- 2028: $0.00047 - $0.00094
- 2029: $0.00055 - $0.0009
- Key Catalysts: Potential factors include enhanced network utility, partnership announcements, and overall crypto market sentiment improvement.
2030-2031 Long-term Outlook
- Baseline Scenario: $0.00056 - $0.00121 (assuming steady ecosystem growth and sustained market interest)
- Optimistic Scenario: $0.0009 - $0.00137 (contingent on significant adoption milestones and favorable regulatory environment)
- Transformative Scenario: Potential to reach upper range of $0.00137 by 2031 (requires breakthrough developments, substantial user base expansion, and strong bull market conditions)
- February 7, 2026: MLP trading around $0.00049 - $0.00069 range (early stage with potential for gradual appreciation)
| Year |
Predicted High Price |
Predicted Average Price |
Predicted Low Price |
Price Change |
| 2026 |
0.00069 |
0.00052 |
0.00049 |
0 |
| 2027 |
0.00069 |
0.0006 |
0.00047 |
17 |
| 2028 |
0.00094 |
0.00065 |
0.00047 |
25 |
| 2029 |
0.0009 |
0.00079 |
0.00055 |
53 |
| 2030 |
0.00121 |
0.00084 |
0.00056 |
63 |
| 2031 |
0.00137 |
0.00102 |
0.0009 |
98 |
IV. MLP Professional Investment Strategy and Risk Management
MLP Investment Methodology
(1) Long-Term Holding Strategy
- Suitable for: Investors who believe in the long-term potential of AI-driven decentralized infrastructure protocols and can tolerate high volatility
- Operational Recommendations:
- Consider accumulating positions during market corrections, given the current 98.89% decline from the all-time high of $0.077
- Monitor project development milestones related to IoT, Web3, and Metaverse integration
- Utilize Gate Web3 Wallet for secure long-term storage of MLP tokens on the BSC network
(2) Active Trading Strategy
- Technical Analysis Tools:
- Volume Analysis: With 24-hour trading volume at $39,563, traders should monitor volume spikes for potential momentum shifts
- Support/Resistance Levels: Current 24-hour range of $0.0003905 (low) to $0.0005267 (high) provides short-term trading boundaries
- Swing Trading Considerations:
- The 31.96% increase in 24 hours suggests potential short-term volatility opportunities
- Consider the -4.77% weekly decline when planning position exits
MLP Risk Management Framework
(1) Asset Allocation Principles
- Conservative Investors: 0.5-1% of crypto portfolio allocation
- Aggressive Investors: 2-3% of crypto portfolio allocation
- Professional Investors: Up to 5% with active hedging strategies
(2) Risk Hedging Approaches
- Position Sizing: Limit single trade exposure to no more than 1% of total capital
- Stop-Loss Implementation: Set stop-loss orders 10-15% below entry points to manage downside risk
(3) Secure Storage Solutions
- Software Wallet Recommendation: Gate Web3 Wallet supports BSC network and provides user-friendly interface for MLP storage
- Multi-Signature Solution: For larger holdings, consider implementing multi-signature wallet arrangements
- Security Precautions: Always verify the contract address (0xdbe3ea3639077a837e767c5d82730254fc933e41) before transactions and never share private keys
V. MLP Potential Risks and Challenges
MLP Market Risks
- Extreme Volatility: The token has experienced a 98.89% decline over the past year, indicating substantial price instability
- Limited Liquidity: With only $39,563 in 24-hour trading volume and listing on one exchange, liquidity constraints may impact trade execution
- Low Market Capitalization: Current market cap of approximately $319,197 suggests higher susceptibility to market manipulation
MLP Regulatory Risks
- AI Technology Oversight: Evolving regulatory frameworks for AI-driven protocols may impact project development and token utility
- Cross-Border Compliance: As a decentralized infrastructure protocol, MLP may face varying regulatory requirements across different jurisdictions
- Token Classification Uncertainty: Regulatory treatment of infrastructure tokens remains unclear in many regions
MLP Technical Risks
- Network Dependency: Operating on BSC (BEP-20 standard) means exposure to underlying blockchain risks and performance limitations
- Project Maturity: Launched in November 2024, the protocol is relatively new with limited operational track record
- Adoption Challenges: Success depends on widespread adoption across IoT, Web3, and Metaverse applications, which remains uncertain
VI. Conclusion and Action Recommendations
MLP Investment Value Assessment
Matrix Layer Protocol presents an interesting proposition for AI-driven decentralized infrastructure, targeting emerging sectors like IoT and Web3. However, the investment carries substantial risks, evidenced by the nearly 99% decline from its all-time high and limited market liquidity. The long-term value proposition depends heavily on successful implementation of its multi-dimensional data transmission solutions and adoption by target industries. Short-term risks include extreme volatility, limited exchange listings, and uncertain market sentiment.
MLP Investment Recommendations
✅ Beginners: Avoid or allocate only minimal exploratory capital (less than 0.5% of portfolio) after thorough research and understanding of high-risk nature
✅ Experienced Investors: Consider small speculative positions (1-2% of crypto portfolio) with strict risk management protocols and regular monitoring
✅ Institutional Investors: Conduct comprehensive due diligence on technology, team, and roadmap before considering any position; maintain active risk monitoring systems
MLP Trading Participation Methods
- Spot Trading: Purchase MLP tokens through Gate.com spot market using USDT or other supported trading pairs
- Dollar-Cost Averaging: Implement gradual accumulation strategy to mitigate timing risk in volatile market conditions
- Portfolio Diversification: Combine MLP holdings with other infrastructure and AI-related tokens to spread sector-specific risks
Cryptocurrency investment carries extremely high risks, and this article does not constitute investment advice. Investors should make prudent decisions based on their own risk tolerance and are advised to consult professional financial advisors. Never invest more than you can afford to lose.
FAQ
What is MLP (Master Limited Partnership) and how does it differ from common stocks?
MLP is a partnership structure where ownership units represent equity stakes, differing from common stocks which represent corporate shares. MLPs offer tax advantages through pass-through taxation, distributing income directly to unitholders rather than the entity level.
What are the main factors affecting MLP price?
MLP prices are primarily influenced by revenue, operating costs, depreciation, and amortization. Long-term energy contracts, market demand, distribution yields, and investor returns also significantly impact pricing dynamics.
How to predict MLP price trends? What analysis methods are available?
Predict MLP price movements using technical analysis (moving averages, chart patterns), fundamental analysis (project metrics, adoption rates), on-chain metrics (transaction volume, holder distribution), and machine learning models. Combine multiple methods for better accuracy.
What are the main risks and advantages of MLP investment?
Advantages: MLP offers stable cash flow, high dividend yields, and attractive returns for long-term investors. Risks: exposure to oil price volatility, market uncertainty, and infrastructure sector cyclicality. Suitable for investors seeking consistent income.
In which industries is MLP commonly found, and why?
MLP is prevalent in finance, healthcare, manufacturing, and retail sectors due to their abundance of structured tabular data. These industries generate extensive column-based datasets that MLPs process optimally for predictive analytics and pattern recognition.
How do MLP's distributions affect its price?
MLP's distributions typically boost its price by attracting investors through high yields, increasing demand. Stable and growing distributions enhance investor confidence, driving upward price momentum.
* The information is not intended to be and does not constitute financial advice or any other recommendation of any sort offered or endorsed by Gate.