This comprehensive guide provides professional price predictions and market analysis for Momentum (MMT), the financial operating system of the tokenized world on the Sui blockchain. Covering MMT's remarkable growth from zero to $500 million liquidity since March 2025, the article examines current market status, token distribution dynamics, and detailed price forecasts spanning 2026-2031. Designed for investors at all levels, it outlines practical strategies including long-term holding and active trading approaches, complemented by robust risk management frameworks emphasizing asset allocation and secure storage via Gate Web3 Wallet. The analysis addresses key challenges including severe token concentration (top three holders controlling 68% of supply), regulatory uncertainties, and technical vulnerabilities. With MMT currently trading at $0.2021 amid market-wide fear sentiment, the guide equips readers with actionable insights and critical risk warnings to make informed investment decisions in this early-stag
Introduction: MMT's Market Position and Investment Value
Momentum (MMT), positioned as the financial operating system of the tokenized world on the Sui blockchain, has achieved significant traction since its launch on March 31, 2025. Within months of its inception, the platform has grown from zero to $500 million in liquidity, onboarded over 2.1 million users, and reached $1.1 billion in daily trading volume. As of January 20, 2026, MMT maintains a market capitalization of approximately $41.25 million, with a circulating supply of 204.10 million tokens and a price hovering around $0.2021. Dubbed the "Robinhood of the tokenized era," this asset is playing an increasingly critical role in building an integrated financial ecosystem that combines multiple core products.
This article will comprehensively analyze MMT's price trajectory from 2026 to 2031, incorporating historical patterns, market supply-demand dynamics, ecosystem development, and macroeconomic conditions to provide investors with professional price forecasts and practical investment strategies.
I. MMT Price History Review and Market Status
MMT Historical Price Evolution Trajectory
- 2025: Momentum launched on March 31, 2025, marking its entry into the cryptocurrency market. The platform rapidly scaled from zero liquidity to $500M, attracting over 2.1 million users and achieving $1.1B in daily trading volume.
- 2025: On November 4, 2025, MMT reached a notable price level of $4.6188, representing a significant milestone in its early trading history.
- 2025: Following the peak in November, the market experienced adjustment. By December 15, 2025, the price declined to $0.1774, reflecting broader market volatility and consolidation patterns.
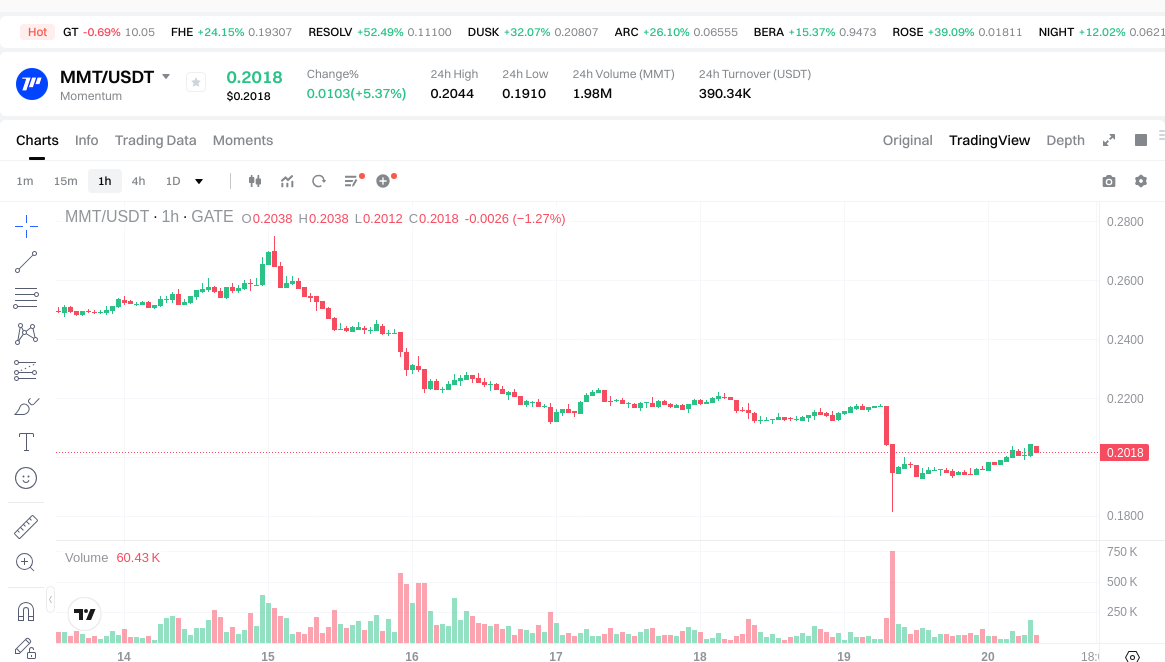
MMT Current Market Status
As of January 20, 2026, MMT is trading at $0.2021, showing a 24-hour increase of 5.19%. The token has experienced varied performance across different timeframes: a modest 0.5% gain over the past hour, while facing headwinds with a 19.13% decline over the past week and a 3.85% decrease over the past month.
The current market capitalization stands at approximately $41.25 million, with a circulating supply of 204.1 million MMT tokens, representing 20.41% of the total supply of 1 billion tokens. The fully diluted valuation is calculated at $202.1 million. Trading volume over the past 24 hours reached $397,595, indicating active market participation.
MMT ranks 593rd in the cryptocurrency market, with a market dominance of 0.0061%. The token is listed on 32 exchanges and operates on the SUI blockchain. The 24-hour trading range fluctuated between a low of $0.1909 and a high of $0.2044.
Momentum is building a financial operating system for the tokenized world, positioning itself as an integrated financial ecosystem. The platform has established itself as a comprehensive trading and liquidity solution within the SUI ecosystem.
Click to view current MMT market price
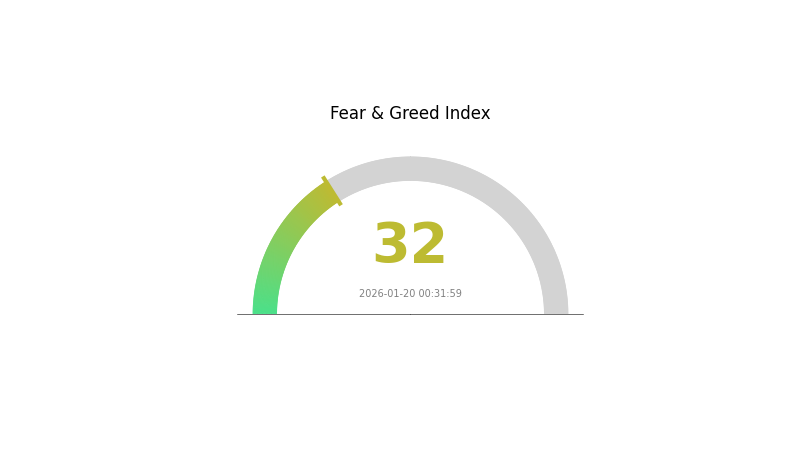
MMT Market Sentiment Index
2026-01-20 Fear and Greed Index: 32 (Fear)
Click to view the current Fear & Greed Index
The crypto market is currently experiencing significant fear sentiment with an index reading of 32. This indicates heightened market anxiety and risk aversion among investors. When fear dominates, volatility typically increases as traders become cautious about positions. Such conditions often present both challenges and opportunities—defensive strategies may be prudent, yet contrarian investors sometimes view extreme fear as a potential buying opportunity. Market participants should monitor emerging developments closely and adjust their risk management accordingly during this period of elevated uncertainty.
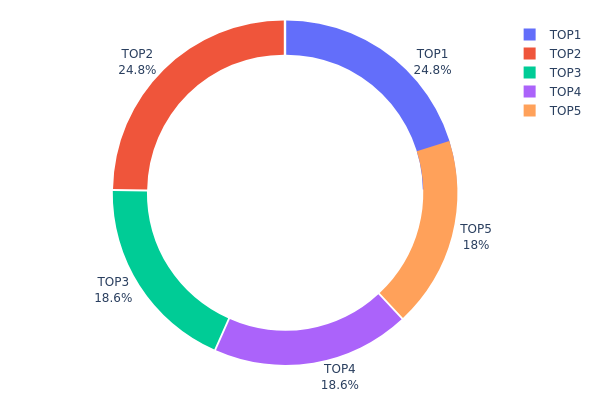
MMT Token Holding Distribution
The token holding distribution chart reveals the allocation pattern of MMT tokens across different wallet addresses, serving as a critical indicator of decentralization and market structure health. By analyzing the concentration of tokens among top holders, we can assess potential risks related to price manipulation and evaluate the overall stability of the token's on-chain ecosystem.
Based on the current data, MMT exhibits an extremely high concentration pattern that raises significant concerns. The top holder controls 247,800K tokens, representing 24.78% of the total supply, while the second and third largest addresses hold 24.78% and 18.57% respectively. Most notably, the top three addresses collectively control approximately 68% of the circulating supply, indicating a severely centralized distribution structure. The negative value (-4.7%) shown in the "Others" category suggests potential data anomalies or locked/burned tokens that warrant further investigation.
This concentration level poses substantial risks to market stability and price discovery mechanisms. With nearly 70% of tokens held by just three addresses, the token is vulnerable to significant price volatility should any of these major holders decide to liquidate their positions. The centralized nature also increases susceptibility to coordinated market manipulation and reduces the token's resilience against external shocks. From a decentralization perspective, this distribution pattern contradicts the fundamental principles of distributed ownership and suggests that MMT's on-chain governance and market dynamics are heavily influenced by a small group of entities, potentially undermining investor confidence in the token's long-term stability.
Click to view current MMT Token Holding Distribution
| Top |
Address |
Holding Qty |
Holding (%) |
| 1 |
0x5b52...03780c |
247800.00K |
24.78% |
| 2 |
0x5b52...03780c |
247800.00K |
24.78% |
| 3 |
0x1b4d...7355c8 |
185724.00K |
18.57% |
| 4 |
0x1b4d...7355c8 |
185724.00K |
18.57% |
| 5 |
0x5dbc...e73a5f |
180000.00K |
18.00% |
| - |
Others |
-47048000 |
-4.7% |
II. Core Factors Affecting MMT's Future Price
Based on the current available information, there is insufficient data regarding MMT's supply mechanisms, institutional dynamics, macroeconomic positioning, and technical developments to provide a comprehensive analysis of the factors that may influence its future price trajectory.
Investors interested in MMT should conduct thorough research through official project channels, blockchain explorers, and verified cryptocurrency data platforms to understand the token's fundamental characteristics before making any investment decisions.
III. 2026-2031 MMT Price Forecast
2026 Outlook
- Conservative Prediction: $0.14731 - $0.2018
- Neutral Prediction: Around $0.2018
- Optimistic Prediction: Up to $0.28454 (requires favorable market conditions and increased adoption)
2027-2029 Outlook
- Market Stage Expectation: MMT is anticipated to enter a period of gradual recovery and stabilization, with price volatility potentially decreasing as the token matures in the market.
- Price Range Predictions:
- 2027: $0.23587 - $0.25533
- 2028: $0.22931 - $0.26171
- 2029: $0.24015 - $0.31424
- Key Catalysts: Sustained growth may be driven by expanding use cases, potential ecosystem partnerships, and broader crypto market sentiment shifts. A projected 20-26% price change suggests moderate momentum building through this period.
2030-2031 Long-term Outlook
- Baseline Scenario: $0.26207 - $0.35323 (assuming steady ecosystem development and stable macroeconomic conditions)
- Optimistic Scenario: $0.31904 - $0.35733 (contingent upon significant platform upgrades, user base expansion, or favorable regulatory developments)
- Transformative Scenario: Potential to approach upper bounds if MMT achieves breakthrough integrations or captures substantial market share in its sector
- 2026-01-20: MMT trading within early-stage range as market participants assess long-term value proposition
| Year |
Predicted High Price |
Predicted Average Price |
Predicted Low Price |
Price Change |
| 2026 |
0.28454 |
0.2018 |
0.14731 |
0 |
| 2027 |
0.25533 |
0.24317 |
0.23587 |
20 |
| 2028 |
0.26171 |
0.24925 |
0.22931 |
23 |
| 2029 |
0.31424 |
0.25548 |
0.24015 |
26 |
| 2030 |
0.35323 |
0.28486 |
0.26207 |
40 |
| 2031 |
0.35733 |
0.31904 |
0.25842 |
57 |
IV. MMT Professional Investment Strategies and Risk Management
MMT Investment Methodology
(1) Long-term Holding Strategy
- Suitable for: Investors with medium to long-term horizons who believe in the tokenized finance ecosystem
- Operational Recommendations:
- Consider accumulating positions during market downturns, particularly when the token trades significantly below its all-time high
- Monitor the platform's user growth metrics and liquidity levels as key indicators of adoption
- Implement a secure storage solution using Gate Web3 Wallet for cold storage of long-term holdings
(2) Active Trading Strategy
- Technical Analysis Tools:
- Volume Analysis: Monitor the $397,595 daily trading volume for signs of accumulation or distribution patterns
- Support and Resistance Levels: Track key price levels around $0.19 (recent low) and $0.20 (current resistance)
- Swing Trading Considerations:
- Consider the token's high volatility with recent 7-day decline of 19.13% as potential opportunity windows
- Set stop-loss orders to manage downside risk given the significant distance from all-time high
MMT Risk Management Framework
(1) Asset Allocation Principles
- Conservative Investors: 1-3% of crypto portfolio allocation
- Moderate Investors: 3-7% of crypto portfolio allocation
- Aggressive Investors: 7-15% of crypto portfolio allocation
(2) Risk Hedging Approaches
- Portfolio Diversification: Balance MMT holdings with established layer-1 tokens and stablecoins
- Position Sizing: Scale into positions gradually rather than deploying full capital at once
(3) Secure Storage Solutions
- Hot Wallet Recommendation: Gate Web3 Wallet for active trading and DeFi interactions on Sui network
- Cold Storage Approach: Transfer long-term holdings to hardware-backed solutions after accumulation
- Security Considerations: Enable two-factor authentication and regularly verify contract addresses before transactions
V. MMT Potential Risks and Challenges
MMT Market Risks
- Price Volatility: The token has experienced a 59.90% decline over one year, demonstrating significant price fluctuation potential
- Liquidity Concerns: While the platform reports $500M in liquidity, individual token liquidity on exchanges should be monitored
- Market Sentiment: Trading at 20.41% of its fully diluted valuation suggests substantial dilution risk if max supply increases
MMT Regulatory Risks
- DeFi Platform Compliance: Tokenized financial platforms may face evolving regulatory scrutiny across jurisdictions
- Securities Classification: Financial operating systems offering various products may attract regulatory attention
- Jurisdictional Uncertainty: Cross-border operations require navigation of multiple regulatory frameworks
MMT Technical Risks
- Smart Contract Vulnerabilities: As a Sui-based protocol, reliance on smart contract security for user funds
- Network Dependency: Platform performance tied to Sui blockchain's stability and scalability
- Integration Complexity: Multi-product ecosystem may introduce additional technical failure points
VI. Conclusion and Action Recommendations
MMT Investment Value Assessment
Momentum presents an ambitious vision as a financial operating system for the tokenized world, having achieved notable user adoption of 2.1 million users and $1.1B in daily trading volume since its March 2025 launch. However, the token's current performance shows significant challenges, trading 95.62% below its all-time high of $4.62 reached in November 2025. The 20.41% market cap to fully diluted valuation ratio indicates substantial dilution potential. While the platform's integration on Sui and its comprehensive product suite offer long-term potential, investors should weigh the early-stage risks against the platform's growth trajectory.
MMT Investment Recommendations
✅ Beginners: Start with minimal allocation (under 2% of crypto portfolio) and focus on understanding the platform's core products before significant investment
✅ Experienced Investors: Consider dollar-cost averaging during periods of market weakness, maintaining strict risk management with position limits of 5-7% of crypto holdings
✅ Institutional Investors: Conduct thorough due diligence on platform security audits, team backgrounds, and regulatory compliance before considering strategic allocations
MMT Trading Participation Methods
- Spot Trading: Execute trades on Gate.com with 32 exchanges currently listing the token
- Gradual Accumulation: Build positions systematically during market retracements to average entry prices
- Platform Participation: Engage with Momentum's native products to understand value proposition firsthand
Cryptocurrency investment carries extremely high risk, and this article does not constitute investment advice. Investors should make prudent decisions based on their own risk tolerance and are advised to consult professional financial advisors. Never invest more than you can afford to lose.
FAQ
What is MMT? What is the use of MMT token?
MMT is a utility token designed for the Web3 ecosystem. It provides governance rights, enables staking rewards, facilitates platform transactions, and powers decentralized applications. MMT holders gain access to exclusive features and participate in community decisions.
MMT has demonstrated strong growth momentum in recent market cycles. Over the past year, MMT has experienced significant appreciation, reflecting increased adoption and market confidence. The token has shown resilience through market fluctuations while maintaining upward trajectory in its price trend.
What are the main factors affecting MMT price?
MMT price is influenced by market demand, trading volume, project development progress, community sentiment, overall crypto market trends, and regulatory news. Positive developments and increased adoption typically drive price appreciation.
What are professional analysts' predictions for MMT's future price?
Analysts project MMT could reach $0.50-$1.20 by 2027, driven by increasing adoption, growing transaction volume, and expanding ecosystem partnerships. Long-term sentiment remains bullish based on fundamental development and market demand.
What are the risks of investing in MMT tokens?
MMT token investments carry market volatility risks, including price fluctuations, liquidity risks, and regulatory uncertainty. Project development delays, competition, and technological changes may impact token value. Always conduct thorough research before investing.
What are the advantages or disadvantages of MMT compared to similar tokens or assets?
MMT offers superior scalability and lower transaction costs through innovative layer-2 solutions. Its community-driven governance provides stronger decentralization compared to competitors. However, newer market entry means less liquidity and shorter track record than established alternatives. MMT's unique deflationary mechanism supports long-term value appreciation.
How to analyze and predict MMT price trends?
Analyze MMT price trends by monitoring transaction volume, market capitalization changes, and on-chain metrics. Track technical indicators like moving averages and support/resistance levels. Consider macroeconomic factors and project developments. Historical data suggests MMT may experience continued growth driven by increased adoption and ecosystem expansion in 2026.
* The information is not intended to be and does not constitute financial advice or any other recommendation of any sort offered or endorsed by Gate.