This comprehensive analysis examines MODE token's price trajectory from 2026 to 2031, combining historical performance data, market dynamics, and ecosystem developments. MODE, a modular DeFi Layer 2 solution backed by Optimism, currently trades at $0.0003224 with $1.86 million market capitalization and over $500 million TVL. The article provides professional price forecasts across conservative, neutral, and optimistic scenarios, with 2031 potential reaching $0.00070 under favorable conditions. Key sections evaluate supply mechanisms, liquidity dynamics, technology development, and holding concentration patterns affecting price movements. Professional investment strategies address long-term holding and active trading approaches, complemented by comprehensive risk management frameworks and secure storage solutions on Gate. Investment recommendations are tailored for beginners, experienced investors, and institutional participants, emphasizing Layer 2 infrastructure fundamentals and ecosystem expansion as critic
Introduction: MODE's Market Position and Investment Value
Mode (MODE) serves as a modular DeFi Layer 2 solution backed by Optimism, having established itself since its launch in 2024 with notable achievements including over $500 million in Total Value Locked (TVL), 300,000 monthly active users, and 50 ecosystem projects. As of February 2026, MODE maintains a market capitalization of approximately $1.86 million, with a circulating supply of about 5.78 billion tokens, trading at around $0.0003224. This Layer 2 infrastructure asset, recognized for its innovative economic model that rewards network growth contributors, is playing an increasingly significant role in the modular blockchain and DeFi ecosystem.
This article will comprehensively analyze MODE's price trajectory from 2026 to 2031, combining historical patterns, market supply-demand dynamics, ecosystem development, and macroeconomic conditions to provide professional price forecasts and practical investment strategies for investors.
I. MODE Price History Review and Market Status
MODE Historical Price Evolution
- 2024: MODE launched on May 7, 2024, with an initial price of $0.1, reaching an all-time high of $0.15 during the same period
- 2024-2025: The token experienced significant downward pressure, declining from its peak value
- 2026: On January 25, 2026, MODE reached its all-time low of $0.0003097
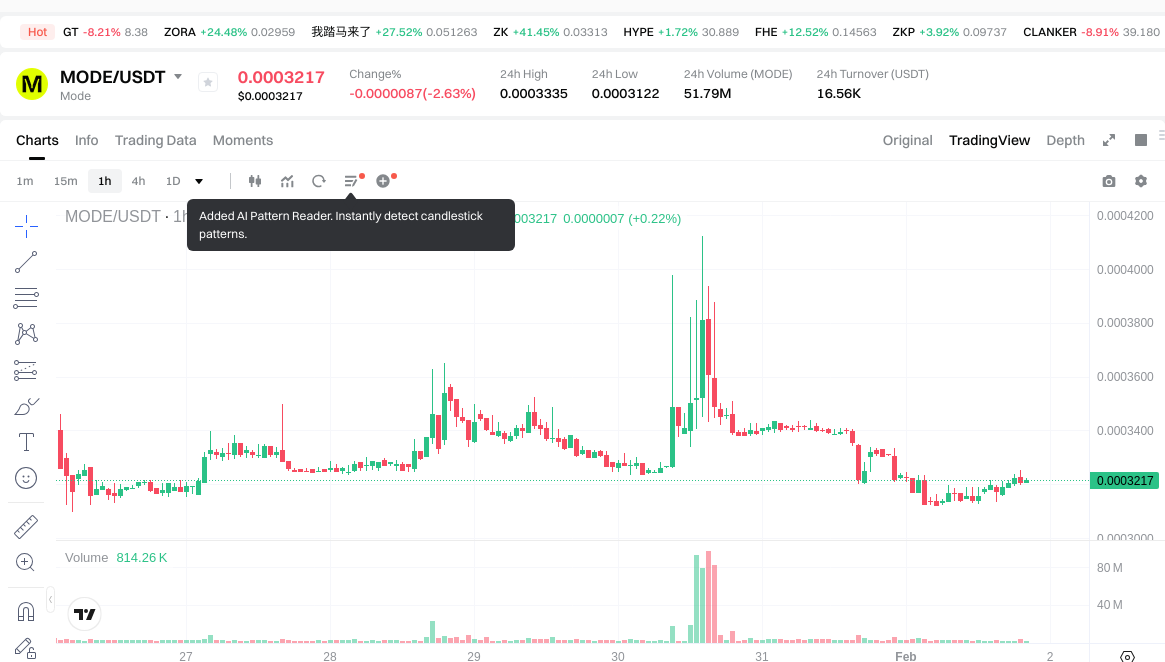
MODE Current Market Situation
As of February 1, 2026, MODE is trading at $0.0003224, showing a 24-hour decrease of 2.39%. The token's 24-hour trading range spans from a low of $0.0003122 to a high of $0.0003335, with a total trading volume of $16,553.61.
The circulating supply stands at 5.78 billion MODE tokens, representing 57.83% of the maximum supply of 10 billion tokens. The current market capitalization is approximately $1.86 million, with a fully diluted market cap of $3.22 million. MODE ranks 2095 in the overall cryptocurrency market, holding a 0.00011% market dominance.
Over different time periods, MODE has shown negative performance across all metrics: down 0.33% in the past hour, down 10.89% over the past week, down 32.72% over the past month, and down 98.66% over the past year. The token has approximately 105,534 holders and is currently listed on 5 exchanges.
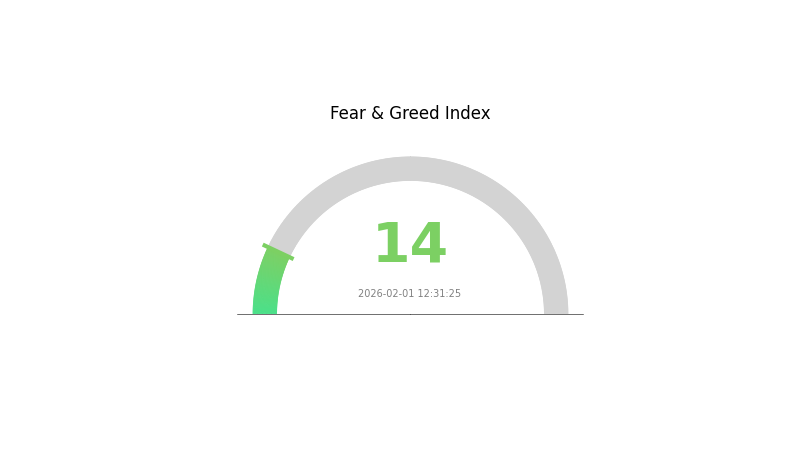
The current crypto market sentiment index stands at 14, indicating an "Extreme Fear" market environment.
Click to view current MODE market price
MODE Market Sentiment Index
2026-02-01 Fear and Greed Index: 14 (Extreme Fear)
Click to view current Fear & Greed Index
The crypto market is experiencing extreme fear, with the index at 14. This exceptionally low reading suggests significant market pessimism and widespread investor anxiety. During such periods, risk assets typically face heavy selling pressure as traders rush to exit positions. However, extreme fear can also present contrarian opportunities for long-term investors seeking entry points at depressed valuations. Market participants should exercise caution and maintain disciplined risk management strategies. Consider dollar-cost averaging or waiting for clearer market signals before making substantial investment decisions.
MODE Holding Distribution
The holding distribution chart reveals the proportion of MODE tokens controlled by different address tiers, serving as a crucial indicator of token concentration and decentralization level. Based on the current data, the top 5 addresses collectively hold 67.48% of the total supply, with the largest holder controlling 22.79% (approximately 2.28 billion tokens), followed by 18.00% and 11.30% respectively. This indicates a relatively high concentration pattern in MODE's on-chain structure, where a small number of major holders dominate the circulating supply.
From a market structure perspective, such concentration levels present both opportunities and risks. The 32.52% held by other addresses suggests some degree of distribution among retail investors and smaller participants, but the dominance of top holders could significantly impact price volatility. Large holders possess substantial influence over market liquidity and price movements, potentially leading to sharp fluctuations during periods of coordinated selling or accumulation. Additionally, this concentration pattern may raise concerns about potential market manipulation risks, as major addresses could theoretically coordinate actions to influence price discovery.
The current holding distribution reflects a market structure that is still in its early development phase, with centralization characteristics typical of emerging projects. While this concentration may facilitate more efficient governance decisions and protocol development coordination, it also indicates limited decentralization progress. Investors should closely monitor any significant changes in top holder positions, as redistribution patterns or large-scale transfers could signal important shifts in market dynamics and token economics.
Click to view current MODE holding distribution
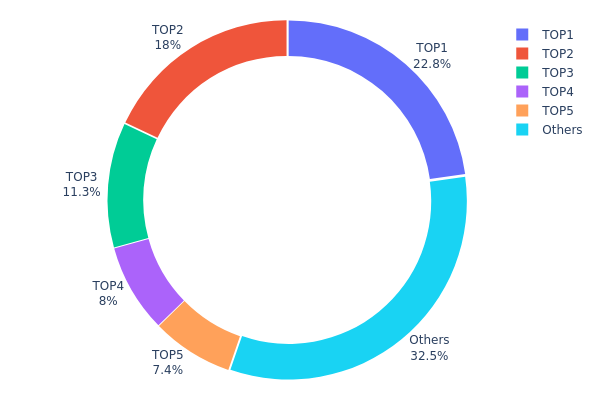
| Top |
Address |
Holding Qty |
Holding (%) |
| 1 |
0x3aEb...7ec974 |
2279408.61K |
22.79% |
| 2 |
0x9cBd...92E53d |
1800000.00K |
18.00% |
| 3 |
0x9289...a94b9c |
1130427.91K |
11.30% |
| 4 |
0xaa97...96FDf8 |
800000.00K |
8.00% |
| 5 |
0x9fE0...27010D |
739804.36K |
7.39% |
| - |
Others |
3250359.12K |
32.52% |
II. Core Factors Influencing MODE's Future Price
Supply Mechanism
- Deflationary Model: MODE adopts a deflationary supply mechanism, which is expected to enhance scarcity and asset value over time.
- Historical Pattern: Deflationary token models have historically contributed to upward price pressure by reducing circulating supply and increasing perceived scarcity among investors.
- Current Impact: The deflationary mechanism may provide fundamental support for MODE's value appreciation as token supply contracts relative to demand.
Market Dynamics and Liquidity
- Liquidity Pools: MODE's price is significantly influenced by liquidity pool dynamics and Automated Market Maker (AMM) algorithms, which determine trading efficiency and price stability.
- Trading Volume: Market liquidity and trading volume serve as primary drivers of price movements, with higher volumes typically supporting more stable price discovery.
- Investor Sentiment: Market psychology and investor confidence play dominant roles in short-term price fluctuations, often amplifying both upward and downward trends.
Technology Development and Ecosystem Expansion
- Ecosystem Growth: MODE is actively expanding its ecosystem, focusing on strategic partnerships and infrastructure development to enhance platform utility.
- Developer Incentives: The project allocates MODE tokens to developers through funding programs, which may create inflationary pressure but simultaneously drives ecosystem development and adoption.
- Demand Dynamics: Growing ecosystem demand for MODE tokens is anticipated to potentially offset inflationary effects from developer token distributions, supporting long-term value appreciation.
III. 2026-2031 MODE Price Prediction
2026 Outlook
- Conservative forecast: $0.00025 - $0.00032
- Neutral forecast: $0.00032
- Optimistic forecast: $0.00036 (requires favorable market conditions and increased adoption)
2027-2029 Outlook
- Market stage expectation: The token may enter a moderate growth phase with gradual price appreciation as the project develops and expands its user base
- Price range forecast:
- 2027: $0.00029 - $0.00039 (approximately 6% increase)
- 2028: $0.00022 - $0.00047 (approximately 13% increase)
- 2029: $0.00027 - $0.00057 (approximately 29% increase)
- Key catalysts: Potential drivers include technological improvements, strategic partnerships, ecosystem expansion, and broader market recovery trends
2030-2031 Long-term Outlook
- Baseline scenario: $0.00032 - $0.00055 (assuming steady development and moderate market conditions)
- Optimistic scenario: $0.00034 - $0.00070 (assuming accelerated adoption and favorable regulatory environment)
- Transformative scenario: Potential reaching $0.00070 (under exceptionally favorable conditions including significant technological breakthroughs and mass adoption)
- 2026-02-01: MODE trading within the predicted range of $0.00025 - $0.00036 (reflecting current market positioning)
| Year |
Predicted High Price |
Predicted Average Price |
Predicted Low Price |
Price Change |
| 2026 |
0.00036 |
0.00032 |
0.00025 |
0 |
| 2027 |
0.00039 |
0.00034 |
0.00029 |
6 |
| 2028 |
0.00047 |
0.00037 |
0.00022 |
13 |
| 2029 |
0.00057 |
0.00042 |
0.00027 |
29 |
| 2030 |
0.00055 |
0.00049 |
0.00032 |
53 |
| 2031 |
0.0007 |
0.00052 |
0.00034 |
62 |
IV. MODE Professional Investment Strategies and Risk Management
MODE Investment Methodology
(I) Long-term Holding Strategy
- Suitable for: Investors seeking exposure to modular DeFi infrastructure with a multi-year investment horizon
- Operational Recommendations:
- Consider accumulating positions during market corrections when the price approaches technical support levels
- Monitor MODE's Total Value Locked (TVL) growth and ecosystem development metrics as fundamental indicators
- Utilize Gate Web3 Wallet for secure storage with regular backup of recovery phrases
(II) Active Trading Strategy
- Technical Analysis Tools:
- Moving Averages: Track 50-day and 200-day moving averages to identify trend reversals and momentum shifts
- Volume Analysis: Monitor 24-hour trading volume patterns to confirm price movements and identify potential breakout scenarios
- Swing Trading Key Points:
- Establish clear entry and exit levels based on recent price ranges between support and resistance zones
- Implement trailing stop-loss orders to protect gains while allowing room for price volatility
MODE Risk Management Framework
(I) Asset Allocation Principles
- Conservative Investors: 1-3% of crypto portfolio allocation
- Active Investors: 3-7% of crypto portfolio allocation
- Professional Investors: 5-10% of crypto portfolio allocation with dynamic rebalancing
(II) Risk Hedging Solutions
- Portfolio Diversification: Balance MODE exposure with established Layer 1 and Layer 2 assets to mitigate sector-specific risks
- Position Sizing: Implement graduated entry strategy with multiple tranches rather than single large positions
(III) Secure Storage Solutions
- Hot Wallet Recommendation: Gate Web3 Wallet for active trading and liquidity provision
- Cold Storage Option: Hardware wallet solutions for long-term holdings exceeding trading needs
- Security Precautions: Enable two-factor authentication, verify contract addresses before transactions, and avoid sharing private keys or seed phrases
V. MODE Potential Risks and Challenges
MODE Market Risks
- High Volatility: MODE has experienced significant price fluctuations, with a 32.72% decline over the past 30 days and 98.66% decline from its historical high
- Liquidity Concerns: With a 24-hour trading volume of approximately $16,554, liquidity may be limited during periods of market stress
- Market Capitalization: Currently ranked #2095 with a market cap of approximately $1.86 million, indicating limited market depth and higher susceptibility to large order impacts
MODE Regulatory Risks
- DeFi Regulation Evolution: Increasing regulatory scrutiny on decentralized finance platforms may impact MODE's operational framework and user adoption
- Cross-jurisdictional Compliance: As a Layer 2 solution operating globally, MODE may face varying regulatory requirements across different jurisdictions
- Smart Contract Legal Status: Ongoing regulatory uncertainty regarding the legal classification of smart contract-based protocols could affect MODE's compliance obligations
MODE Technical Risks
- Layer 2 Security Dependencies: As an Optimism-backed Layer 2 solution, MODE's security relies on the underlying infrastructure and potential vulnerabilities in rollup technology
- Interoperability Challenges: Integration with Celestia and EigenDA introduces additional technical complexity and potential points of failure
- Smart Contract Vulnerabilities: Despite auditing processes, smart contract exploits remain a persistent risk in DeFi protocols
VI. Conclusion and Action Recommendations
MODE Investment Value Assessment
MODE presents as a modular DeFi Layer 2 infrastructure project with notable ecosystem metrics, including over $500 million in TVL and 300,000 monthly users. The project's integration with Optimism, Celestia, and EigenDA demonstrates technical ambition in addressing scalability challenges. However, the token has experienced substantial price depreciation, declining 98.66% from its all-time high, which reflects significant market headwinds and investor risk perception. The relatively low market capitalization and trading volume indicate an early-stage project with considerable growth potential but corresponding high risk. Long-term value proposition depends on continued ecosystem expansion, user adoption, and successful execution of the Flare L3 roadmap.
MODE Investment Recommendations
✅ Beginners: Limit exposure to 1-2% of crypto portfolio; prioritize education about Layer 2 technology and DeFi mechanics before investing; start with small test transactions to understand the ecosystem
✅ Experienced Investors: Consider strategic positions of 3-5% of crypto portfolio; actively monitor TVL trends and ecosystem project launches; implement dollar-cost averaging during periods of technical consolidation
✅ Institutional Investors: Conduct comprehensive due diligence on smart contract security and tokenomics; evaluate MODE as part of broader Layer 2 infrastructure thesis; consider strategic partnerships or ecosystem participation alongside token exposure
MODE Trading Participation Methods
- Spot Trading: Access MODE trading pairs on Gate.com with competitive fees and liquidity aggregation
- DeFi Participation: Engage directly with MODE ecosystem protocols for yield farming and liquidity provision opportunities
- Portfolio Rebalancing: Incorporate MODE as part of periodic portfolio adjustments based on technical and fundamental analysis signals
Cryptocurrency investment carries extremely high risks, and this article does not constitute investment advice. Investors should make prudent decisions based on their own risk tolerance and are advised to consult professional financial advisors. Never invest more than you can afford to lose.
FAQ
What is MODE token? What are its main uses and application scenarios?
MODE is a governance token that empowers holders to participate in platform decision-making. Its primary applications include protocol governance, strategic voting, and ecosystem participation, enabling decentralized management of the Mode network and its development direction.
MODE price prediction uses technical analysis tools including Simple Moving Average (SMA) and Exponential Moving Average (EMA). Analyze trading volume, market trends, and on-chain metrics. Use charting platforms and technical analysis software to identify support/resistance levels and price patterns for forecasting.
MODE has experienced notable volatility recently. Over the past 7 days, the token fluctuated between 1.39 to 2.18, showing significant price swings. Short-term fluctuations remain present, reflecting active market dynamics and investor interest in the MODE ecosystem.
What are the risks of investing in MODE tokens? What should I pay attention to?
MODE tokens face market volatility and technical risks with potential significant price fluctuations. Investors should thoroughly research the project fundamentals and market dynamics before investing. Conduct due diligence and only invest capital you can afford to lose.
What are the advantages and disadvantages of MODE compared to similar tokens?
MODE excels on OP Superchain with strong community engagement and innovative applications. Advantages include 10 billion total supply with 5.5% airdrop allocation and active ecosystem development. Disadvantages include intense market competition and reliance on OP Superchain infrastructure.
What are the technical and fundamental analysis indicators for MODE tokens?
MODE token technical indicators include trading volume and price trends. Fundamental indicators include Market Value to Realized Value ratio (MVRV), Network Value to Transactions ratio (NVT), and Stock-to-Flow ratio for measuring market sentiment.
What are MODE token's future development prospects and growth potential?
MODE currently holds a market cap of $948,588.75 with a ranking of 2048. While not yet widely recognized, MODE demonstrates significant growth potential during bull market cycles, with considerable upside for early adopters.
What are professional analysts' price predictions for MODE?
Professional analysts predict MODE price will rise with increased market demand and technology adoption. Predictions are based on supply dynamics and market trend analysis. Current forecasts indicate potential upside driven by ecosystem growth and institutional interest.
* The information is not intended to be and does not constitute financial advice or any other recommendation of any sort offered or endorsed by Gate.