This comprehensive guide provides expert analysis of Moonriver (MOVR) token pricing from 2026 to 2031, combining historical market data with forward-looking forecasts. MOVR, an EVM-compatible parachain on Kusama, currently trades at $2.36 with a $24.96M market cap. The article examines MOVR's price trajectory from its 2021 launch peak of $494.26 through recent declines, then projects 2026-2031 price ranges: 2026 forecast $1.53-$2.62, with potential growth to $5.33 by 2030 under favorable conditions. Designed for investors seeking Kusama ecosystem exposure, this analysis covers investment methodologies including dollar-cost averaging and active trading strategies, risk management frameworks, and secure storage solutions via Gate Web3 Wallet. Essential considerations include high volatility risks, regulatory challenges, and parachain slot dependencies affecting long-term prospects.
Introduction: MOVR's Market Position and Investment Value
Moonriver (MOVR), positioned as an EVM-compatible blockchain operating as a parachain on the Kusama network, has established itself as a significant player in the multi-chain ecosystem since its launch in 2021. As of 2026, MOVR maintains a market capitalization of approximately $24.96 million, with a circulating supply of around 10.58 million tokens, and its price hovering around $2.36. This asset, recognized for its unique role in bridging Ethereum-based applications to the Kusama ecosystem, continues to play an increasingly vital role in decentralized finance, smart contract deployment, and cross-chain interoperability.
This article provides a comprehensive analysis of MOVR's price trajectory from 2026 to 2031, combining historical patterns, market supply-demand dynamics, ecosystem development, and macroeconomic conditions to offer professional price forecasts and practical investment strategies for investors.
I. MOVR Price History Review and Market Status
MOVR Historical Price Evolution Trajectory
- 2021: MOVR was launched on August 26, 2021, and subsequently experienced significant price volatility. In September 2021, the token reached a notable peak of $494.26 on September 11, 2021, marking a period of strong market interest following its debut as a parachain on the Kusama network.
- 2022-2024: Following the initial peak, MOVR entered a prolonged correction phase, with prices gradually declining as broader cryptocurrency market conditions shifted and initial hype subsided.
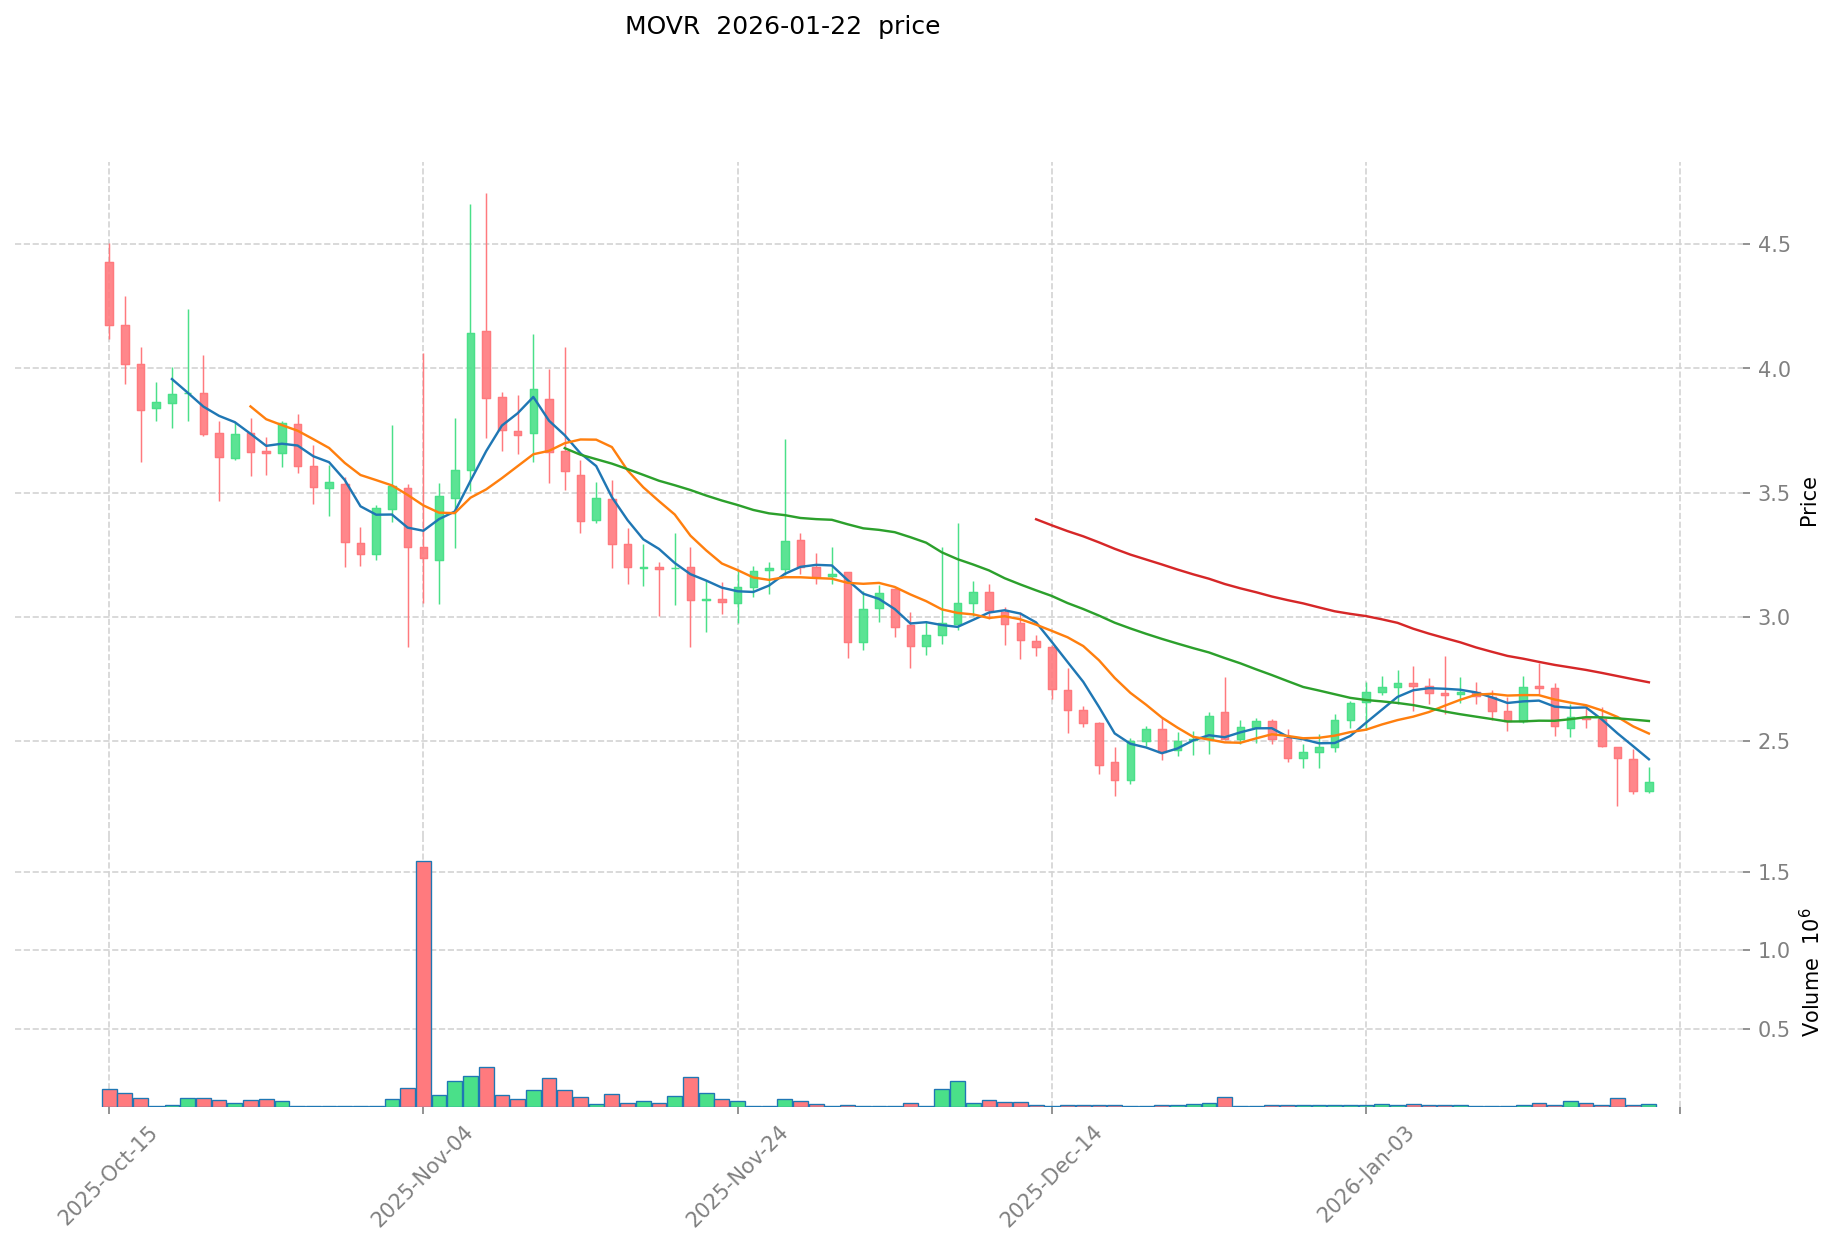
- 2025: The token continued to face downward pressure, with prices dropping substantially. On December 19, 2025, MOVR recorded a low of $2.3, representing a significant decline from previous levels.
MOVR Current Market Status
As of January 22, 2026, MOVR is trading at $2.358, showing a slight increase of 0.21% over the past hour but declining 0.42% in the last 24 hours. The 24-hour trading range has been between $2.293 and $2.395.
Over the past week, MOVR has experienced a decline of 12.98%, while the 30-day performance shows a decrease of 5.94%. The one-year performance indicates a substantial decline of 77.37%, reflecting challenging market conditions.
The token currently holds a market capitalization of approximately $24.96 million, ranking #781 in the cryptocurrency market with a market dominance of 0.00090%. The circulating supply stands at 10.58 million MOVR tokens, representing 97.43% of the total supply of 12.30 million tokens. With 971,966 holders, the token maintains a distributed ownership structure.
The 24-hour trading volume is approximately $45,166, and the fully diluted market cap matches the current market capitalization at $29.01 million, given the high circulation ratio. MOVR is currently listed on 21 exchanges, with Gate.com being among the trading platforms.
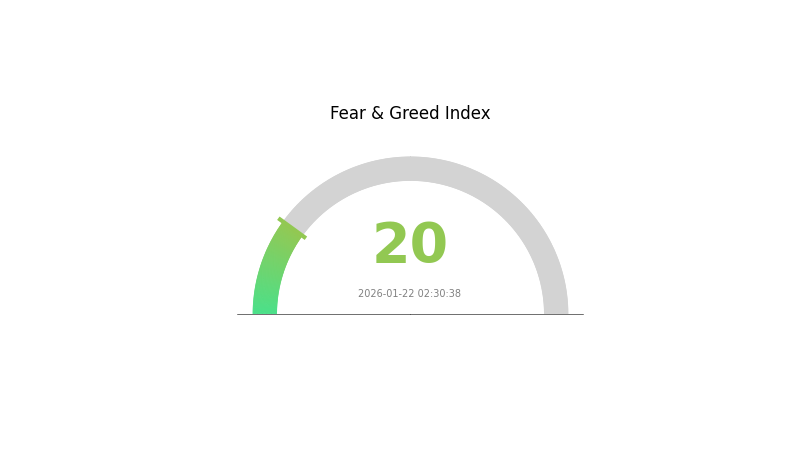
The current crypto market fear and greed index stands at 20, indicating "Extreme Fear" sentiment, which may be influencing trading activity across the broader market.
Click to view the current MOVR market price
Market Sentiment Indicator
01-22-2026 Fear and Greed Index: 20 (Extreme Fear)
Click to view current Fear & Greed Index
The crypto market is currently experiencing extreme fear, with the Fear and Greed Index reading just 20 points. This indicates severe market pessimism and panic selling among investors. During such periods, risk assets face significant downward pressure as uncertainty dominates market sentiment. However, experienced traders often view extreme fear as a potential buying opportunity, as markets historically tend to recover from such lows. Investors should exercise caution and conduct thorough analysis before making trading decisions in this highly volatile environment.
MOVR Holdings Distribution
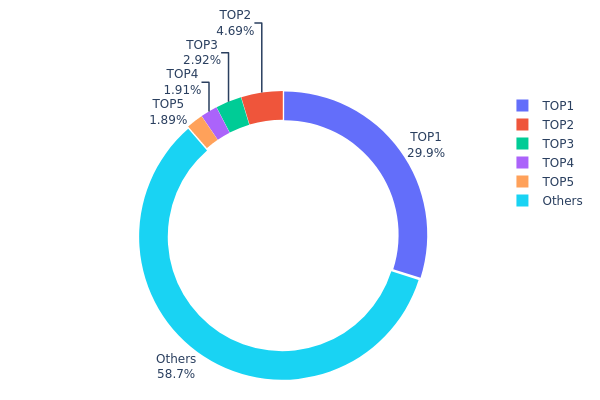
The holdings distribution chart reveals the allocation of MOVR tokens across different wallet addresses, serving as a critical metric for evaluating the degree of decentralization and concentration risk within the Moonriver ecosystem. According to the latest on-chain data, the top address holds approximately 3.676 million MOVR, accounting for 29.88% of the circulating supply, while the top five addresses collectively control 5.280 million tokens, representing 42.92% of total holdings. The remaining 58.74% is distributed among other addresses, indicating a relatively concentrated ownership structure.
This concentration pattern suggests a moderate centralization risk in MOVR's market structure. The dominance of the top holder, controlling nearly 30% of circulating supply, creates potential vulnerability to price manipulation and heightened volatility during large-scale transactions. However, the fact that nearly 60% of tokens remain distributed among smaller holders demonstrates a foundation of community participation. This dual-characteristic structure—significant whale concentration combined with substantial retail distribution—reflects a typical early-stage blockchain project pattern where major stakeholders maintain strategic positions while the ecosystem gradually expands.
From a market dynamics perspective, this holdings distribution indicates that MOVR's price movements may be susceptible to decisions made by major holders, particularly the top address. Any substantial selling pressure from concentrated positions could trigger cascading liquidations or market panic. Conversely, the diverse distribution across thousands of smaller addresses provides a stabilizing effect and suggests genuine ecosystem adoption beyond speculative trading. This balance between concentration and distribution will be crucial for monitoring MOVR's long-term market stability and decentralization trajectory.
Click to view current MOVR Holdings Distribution
| Top |
Address |
Holding Qty |
Holding (%) |
| 1 |
0xf977...41acec |
3676.90K |
29.88% |
| 2 |
0x5a04...4020a3 |
577.01K |
4.68% |
| 3 |
0xb0a3...7e4411 |
359.83K |
2.92% |
| 4 |
0x14d7...632bcc |
234.82K |
1.90% |
| 5 |
0x381d...a362a7 |
232.01K |
1.88% |
| - |
Others |
7223.51K |
58.74% |
II. Core Factors Affecting MOVR's Future Price
Based on the current available information, the key factors that may influence MOVR's price development cannot be comprehensively analyzed at this time. Market participants should conduct their own research and stay informed about developments in the Moonriver ecosystem, broader cryptocurrency market trends, and macroeconomic conditions that typically affect digital asset valuations.
For the most current information about MOVR, users are encouraged to visit Gate.com's official platform and consult multiple reliable sources before making any investment decisions.
III. 2026-2031 MOVR Price Prediction
2026 Outlook
- Conservative Forecast: $1.53 - $2.36
- Neutral Forecast: $2.36
- Optimistic Forecast: $2.62 (subject to favorable market conditions and ecosystem development)
2027-2029 Mid-term Outlook
- Market Phase Expectation: The token may enter a gradual growth phase as the Moonriver ecosystem continues to mature, with potential expansion in DeFi applications and cross-chain interoperability.
- Price Range Forecast:
- 2027: $2.32 - $3.19
- 2028: $2.21 - $3.86
- 2029: $2.78 - $3.95
- Key Catalysts: Enhanced network utility, increased developer activity on the Moonriver platform, and broader adoption of Kusama-based parachains could serve as major drivers for price appreciation.
2030-2031 Long-term Outlook
- Baseline Scenario: $2.15 - $3.65 (assuming steady ecosystem growth and stable market conditions)
- Optimistic Scenario: $4.49 - $5.33 (contingent on significant technological breakthroughs and widespread institutional adoption)
- Transformative Scenario: Prices may reach the upper end of projected ranges if MOVR achieves mainstream recognition as a leading smart contract platform within the Polkadot/Kusama ecosystem, though such outcomes remain highly speculative.
- 2026-01-22: MOVR price predictions suggest a potential range between $1.53 and $2.62 for the current year, with long-term forecasts extending up to $5.33 by 2030 under favorable conditions.
| Year |
Predicted High Price |
Predicted Average Price |
Predicted Low Price |
Price Change |
| 2026 |
2.62071 |
2.361 |
1.53465 |
0 |
| 2027 |
3.18829 |
2.49086 |
2.3165 |
5 |
| 2028 |
3.86182 |
2.83957 |
2.21487 |
20 |
| 2029 |
3.95382 |
3.3507 |
2.78108 |
42 |
| 2030 |
5.3323 |
3.65226 |
2.15483 |
54 |
| 2031 |
4.94151 |
4.49228 |
2.65045 |
90 |
IV. MOVR Professional Investment Strategy and Risk Management
MOVR Investment Methodology
(1) Long-term Holding Strategy
- Suitable for: Investors seeking exposure to Kusama parachain ecosystem and EVM-compatible infrastructure
- Operational Recommendations:
- Consider dollar-cost averaging to mitigate entry point risks, given recent price volatility with 24H change of -0.42% and 7D decline of -12.98%
- Monitor Kusama network developments and parachain slot auction updates as they may impact MOVR utility value
- Storage Solution: Utilize Gate Web3 Wallet for secure storage with support for EVM-compatible networks, enabling direct interaction with Moonriver DApps
(2) Active Trading Strategy
- Technical Analysis Tools:
- Volume Analysis: Monitor 24H trading volume ($45,166.00) relative to market cap ($24.96M) to assess liquidity conditions
- Price Range Indicators: Track 24H price range ($2.293-$2.395) to identify potential support and resistance levels
- Swing Trading Considerations:
- Current price ($2.358) shows proximity to historical low ($2.30 on December 19, 2025), suggesting potential support zone
- Monitor 7-day and 30-day trends (-12.98% and -5.94% respectively) for momentum shifts
MOVR Risk Management Framework
(1) Asset Allocation Principles
- Conservative Investors: 1-3% portfolio allocation considering high volatility (77.37% decline over 1-year)
- Moderate Investors: 3-5% allocation for diversified crypto exposure
- Aggressive Investors: 5-8% allocation with active position management
(2) Risk Hedging Solutions
- Portfolio Diversification: Balance MOVR exposure with other Polkadot/Kusama ecosystem assets and mainstream cryptocurrencies
- Position Sizing: Limit individual position to manageable levels given circulating supply of 10.58M tokens and 97.43% circulation ratio
(3) Secure Storage Solutions
- Software Wallet Recommendation: Gate Web3 Wallet provides integrated access to Moonriver network and DApp ecosystem
- Multi-signature Options: Consider multi-sig setups for larger holdings to enhance security
- Security Precautions: Enable two-factor authentication, regularly update security protocols, and avoid sharing private keys or seed phrases
V. MOVR Potential Risks and Challenges
MOVR Market Risks
- High Volatility: 1-year decline of 77.37% demonstrates significant price instability and market risk exposure
- Limited Liquidity: Market capitalization of $24.96M and ranking at #781 may result in increased slippage during large transactions
- Market Sentiment: Current market dominance of 0.00090% indicates limited mainstream attention compared to leading cryptocurrencies
MOVR Regulatory Risks
- Kusama Ecosystem Dependency: Regulatory actions affecting Kusama network operations could impact Moonriver parachain functionality
- EVM Compatibility Scrutiny: Regulatory frameworks targeting Ethereum-compatible platforms may extend to Moonriver infrastructure
- Cross-chain Bridge Regulations: Increasing regulatory focus on blockchain bridges could affect Moonriver's Ethereum bridge operations
MOVR Technical Risks
- Parachain Slot Dependency: Moonriver's operations rely on maintaining parachain slot access through Kusama's auction mechanism
- Smart Contract Vulnerabilities: EVM compatibility exposes the platform to potential smart contract exploits common in Ethereum-based systems
- Network Congestion: As a parachain, performance may be affected by overall Kusama relay chain capacity and throughput limitations
VI. Conclusion and Action Recommendations
MOVR Investment Value Assessment
Moonriver presents a specialized infrastructure play within the Kusama ecosystem, offering EVM compatibility and parachain functionality. The long-term value proposition centers on its role as a testing ground for Polkadot's Moonbeam network and its utility in supporting DeFi applications. However, significant short-term risks include high volatility evidenced by the 77.37% annual decline, limited liquidity with $24.96M market cap, and dependency on Kusama network developments. The current price near historical lows may present opportunities for risk-tolerant investors, though caution is warranted given ongoing downward momentum.
MOVR Investment Recommendations
✅ Beginners: Start with minimal exposure (1-2% of crypto portfolio) through dollar-cost averaging, focusing on understanding Kusama parachain mechanics before increasing position size
✅ Experienced Investors: Consider 3-5% allocation with active monitoring of technical levels, particularly the $2.30 support zone and network development milestones
✅ Institutional Investors: Evaluate MOVR as part of broader Polkadot/Kusama ecosystem exposure strategy, implementing risk controls appropriate for highly volatile assets
MOVR Trading Participation Methods
- Spot Trading: Access MOVR/USDT pairs on Gate.com with current 24H volume of $45,166.00 for direct ownership and staking opportunities
- Staking Participation: Utilize MOVR tokens for network validation or delegation to earn staking rewards while supporting network consensus
- DeFi Integration: Provide liquidity to Moonriver-based DEX platforms to earn transaction fees, though assess smart contract risks before deployment
Cryptocurrency investment carries extreme risks; this content does not constitute investment advice. Investors should make cautious decisions based on their own risk tolerance and are advised to consult professional financial advisors. Never invest more than you can afford to lose.
FAQ
What is the historical price trend of MOVR tokens?
MOVR has experienced significant volatility since its launch. The token reached peak prices in 2021-2022, followed by corrections. Recently, MOVR has shown recovery momentum with increased adoption on the Moonriver network, supporting upward price potential amid growing DeFi ecosystem development.
What are the main factors affecting MOVR price?
MOVR price is influenced by network adoption, transaction volume, developer activity, market sentiment, cryptocurrency market trends, and Moonriver ecosystem developments. Token utility and DeFi protocol growth on the network also play significant roles in price movements.
What is the future price prediction and prospects for MOVR?
MOVR shows strong growth potential driven by Moonbeam's expanding ecosystem and increasing adoption. With rising DeFi activity and cross-chain functionality, MOVR is positioned for significant appreciation. Long-term outlook remains bullish as the network scales and attracts more developers.
What advantages does MOVR have compared to other Polkadot ecosystem tokens?
MOVR offers superior interoperability as Moonriver, enabling seamless cross-chain interactions. It provides lower transaction costs, faster finality, and robust smart contract compatibility, positioning it as a leading Polkadot parachain solution.
What are the risk factors and investment suggestions for MOVR?
MOVR faces market volatility risks inherent to cryptocurrencies. Investors should diversify portfolios and conduct thorough research. Long-term holders may benefit from MOVR's ecosystem growth and increasing adoption in the Moonbeam network.
* The information is not intended to be and does not constitute financial advice or any other recommendation of any sort offered or endorsed by Gate.