This comprehensive analysis examines Moonriver (MOVR) token's price dynamics and investment potential through 2031. Currently trading at $2.35 with a $24.82 million market cap, MOVR functions as the governance token for the EVM-compatible Moonriver parachain on Kusama. The article evaluates MOVR's market position amid extreme fear sentiment, projects price ranges from $2.20-$3.11 in 2026 to potential $3.20-$5.66 by 2031, and provides professional investment strategies including long-term holding and active trading approaches. Critical analysis covers market risks, liquidity challenges, regulatory uncertainties, and technical vulnerabilities, while offering practical guidance on asset allocation, risk management, and secure storage solutions through Gate trading platform, enabling informed decision-making for diverse investor profiles.
Introduction: MOVR's Market Position and Investment Value
Moonriver (MOVR), as an EVM-compatible blockchain operating as a parachain on the Kusama network, has been facilitating Ethereum-based application deployment since its launch in 2021. As of 2026, MOVR maintains a market capitalization of approximately $24.82 million, with a circulating supply of around 10.58 million tokens, and the price holding at approximately $2.35. This asset, recognized as a functional and governance token within the Kusama ecosystem, is playing an increasingly important role in DeFi applications, cross-chain interoperability, and decentralized governance.
This article will comprehensively analyze MOVR's price trajectory from 2026 to 2031, combining historical patterns, market supply-demand dynamics, ecosystem development, and macroeconomic factors to provide investors with professional price forecasts and practical investment strategies.
I. MOVR Price History Review and Market Status
MOVR Historical Price Evolution Trajectory
- 2021: Moonriver launched as a parachain on Kusama network through crowdloan fundraising, achieving a historical peak price of $494.26 on September 11, 2021, driven by strong initial market enthusiasm for the Kusama ecosystem and EVM-compatible platform.
- 2022-2024: Following the broader cryptocurrency market correction, MOVR experienced significant volatility, with prices declining from earlier highs as market conditions shifted.
- 2025: The token continued facing downward pressure, reaching a historical low of $2.3 on December 19, 2025, reflecting prolonged bearish sentiment in the altcoin sector.
MOVR Current Market Status
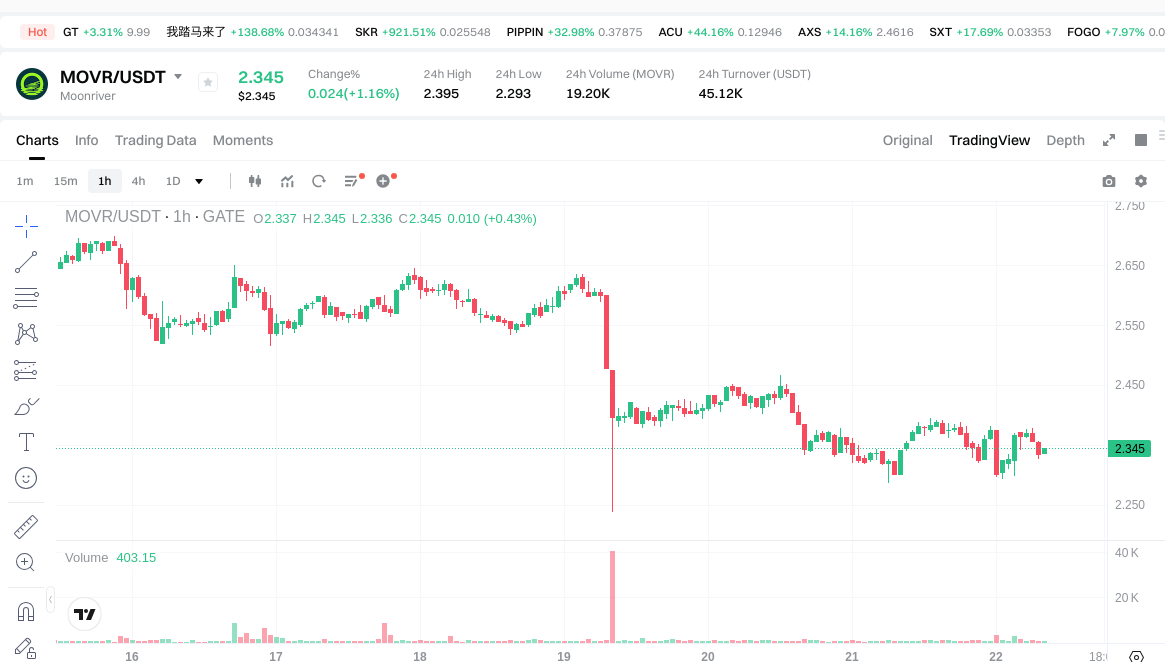
As of January 22, 2026, MOVR is trading at $2.345, showing a 1.55% increase over the past 24 hours. The token has demonstrated mixed short-term performance, with a 0.51% decline over the past hour, while experiencing more pronounced longer-term declines of 13.78% over the past week and 6.55% over the past month. The annual performance indicates a 77.55% decrease, reflecting the challenging market conditions faced by the project.
The 24-hour trading range has fluctuated between $2.293 and $2.395, with a total trading volume of $44,537.49. The current market capitalization stands at approximately $24.82 million, with a circulating supply of 10,584,725 MOVR tokens out of a total supply of 12,304,237 tokens, representing a circulation ratio of 97.43%. The fully diluted market capitalization is $28.85 million, closely aligned with the current market cap due to the high circulation ratio.
MOVR maintains a market dominance of 0.00090% within the broader cryptocurrency market and currently ranks #780 by market capitalization. The token is listed on 21 exchanges, with Gate.com providing trading access. The project has attracted a holder base of 971,971 addresses, indicating sustained community engagement despite price fluctuations.
The current market sentiment index registers at 20, classified as "Extreme Fear," reflecting cautious investor attitudes toward MOVR and the broader crypto market environment.
Click to view the current MOVR market price
Market Sentiment Indicator
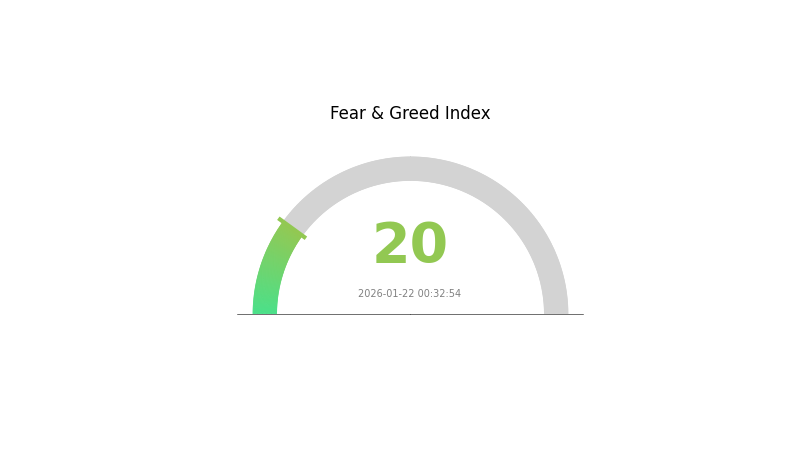
2026-01-22 Fear and Greed Index: 20 (Extreme Fear)
Click to view current Fear & Greed Index
The cryptocurrency market is currently experiencing extreme fear, with the Fear and Greed Index dropping to 20. This exceptionally low reading indicates that market participants are overwhelmingly pessimistic, driven by significant selling pressure and widespread negative sentiment. When fear reaches such extreme levels, it often signals potential market bottoms, as excessive pessimism may create contrarian buying opportunities for long-term investors. However, traders should remain cautious and conduct thorough analysis before making investment decisions during such volatile periods.
MOVR Holding Distribution
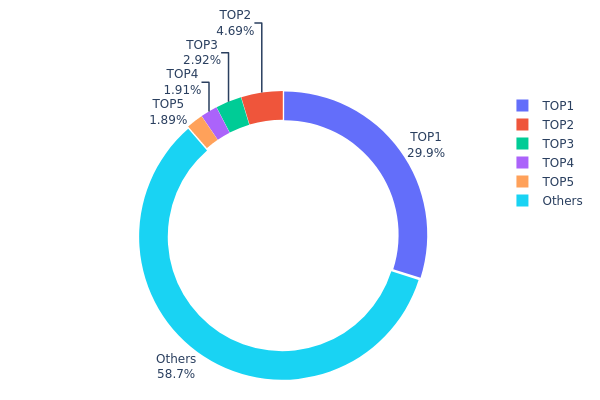
The holding distribution chart reflects the allocation of MOVR tokens across different addresses within the blockchain network. This metric serves as a critical indicator of decentralization level and potential market manipulation risks, revealing the degree of token concentration among major holders.
According to the current data, MOVR exhibits a moderate to high concentration pattern. The top holder controls approximately 29.88% of the total supply with 3.676 million tokens, representing a significant concentration risk. The top five addresses collectively hold 41.26% of the circulating supply, while the remaining 58.74% is distributed among other market participants. This distribution structure suggests that a relatively small number of addresses maintain substantial influence over the token's market dynamics.
Such concentration levels present both opportunities and challenges for market stability. On one hand, large holders typically possess long-term conviction in the project's fundamentals, potentially providing price stability during market turbulence. On the other hand, the substantial holdings concentrated in few addresses increase susceptibility to significant price volatility should these major holders decide to liquidate their positions. The current distribution pattern indicates moderate decentralization risk, where coordinated actions by top addresses could materially impact market liquidity and price discovery mechanisms. This structure warrants careful monitoring by investors, particularly regarding on-chain movement patterns from these major addresses.
Click to view current MOVR Holding Distribution
| Top |
Address |
Holding Qty |
Holding (%) |
| 1 |
0xf977...41acec |
3676.90K |
29.88% |
| 2 |
0x5a04...4020a3 |
577.01K |
4.68% |
| 3 |
0xb0a3...7e4411 |
359.83K |
2.92% |
| 4 |
0x14d7...632bcc |
234.82K |
1.90% |
| 5 |
0x381d...a362a7 |
232.01K |
1.88% |
| - |
Others |
7223.51K |
58.74% |
II. Core Factors Influencing MOVR's Future Price
Based on the available information, specific details regarding supply mechanisms, institutional holdings, macroeconomic factors, and technical developments for MOVR are not currently documented in the provided materials. A comprehensive analysis of these factors requires access to official project documentation, on-chain data, and market reports.
For the most accurate and up-to-date information about Moonriver (MOVR), users are encouraged to conduct their own research through official channels and consult multiple sources before making any investment decisions.
III. 2026-2031 MOVR Price Forecast
2026 Outlook
- Conservative Forecast: $2.20-$2.34
- Neutral Forecast: $2.34-$2.78
- Optimistic Forecast: $2.78-$3.11 (contingent on sustained ecosystem growth and broader market stability)
2027-2029 Mid-Term Outlook
- Market Phase Expectation: Potential transition from accumulation to early expansion phase, supported by ongoing platform developments and increasing adoption
- Price Range Forecasts:
- 2027: $2.51-$3.49
- 2028: $2.86-$4.42
- 2029: $3.12-$4.14
- Key Catalysts: Network utility expansion, strategic partnerships, and overall cryptocurrency market sentiment improvements
2030-2031 Long-Term Outlook
- Baseline Scenario: $2.05-$4.82 (assuming stable market conditions and moderate adoption rates)
- Optimistic Scenario: $3.20-$5.66 (driven by accelerated ecosystem development and increased institutional interest)
- Transformative Scenario: Potential upside above $5.66 (requires exceptional market conditions, major technical breakthroughs, and significant mainstream adoption)
- 2026-01-22: MOVR trading within established accumulation range as market participants assess long-term fundamentals
| Year |
Predicted High Price |
Predicted Average Price |
Predicted Low Price |
Price Change |
| 2026 |
3.11486 |
2.342 |
2.20148 |
0 |
| 2027 |
3.49239 |
2.72843 |
2.51016 |
16 |
| 2028 |
4.41678 |
3.11041 |
2.86158 |
32 |
| 2029 |
4.13996 |
3.7636 |
3.12378 |
60 |
| 2030 |
4.82117 |
3.95178 |
2.05492 |
68 |
| 2031 |
5.65855 |
4.38647 |
3.20212 |
87 |
IV. MOVR Professional Investment Strategy and Risk Management
MOVR Investment Methodology
(1) Long-term Holding Strategy
- Target Investors: Investors who believe in the development potential of the Kusama ecosystem and cross-chain interoperability, suitable for those with risk tolerance and willingness to hold for over 1 year
- Operational Recommendations:
- Consider building positions in batches when MOVR price experiences significant pullbacks from historical levels, avoiding concentrated investments at high points
- Monitor the development progress of the Moonriver network and ecosystem projects, as well as the overall development status of the Kusama parallel chain ecosystem
- Utilize Gate Web3 Wallet for asset storage to ensure private key security and facilitate participation in on-chain governance and staking
(2) Active Trading Strategy
- Technical Analysis Tools:
- Moving Averages: Observe the support and resistance levels formed by the 30-day and 90-day moving averages to identify potential entry and exit points
- Volume Analysis: Pay attention to the relationship between price changes and trading volume; significant volume increases may signal trend reversals
- Band Trading Key Points:
- Based on recent price fluctuations (24H +1.55%, 7D -13.78%, 30D -6.55%), consider short-term trading within a reasonable volatility range
- Set strict stop-loss levels, recommended at 5-8% below the entry price, to control single trade risk
MOVR Risk Management Framework
(1) Asset Allocation Principles
- Conservative Investors: Allocate no more than 1-2% of total crypto assets to MOVR
- Aggressive Investors: May allocate 3-5% of total crypto assets to MOVR
- Professional Investors: Based on deep research and risk hedging capabilities, may allocate 5-10% of total crypto assets
(2) Risk Hedging Solutions
- Diversified Investment: Combine MOVR with other assets in the Kusama ecosystem (such as KSM) and mainstream crypto assets to reduce single-asset risk
- Regular Rebalancing: Review and adjust portfolio proportions quarterly or semi-annually to maintain appropriate risk exposure levels
(3) Secure Storage Solutions
- Hot Wallet Recommendation: Gate Web3 Wallet, convenient for daily trading and participation in DeFi activities
- Cold Storage Solution: For large holdings intended for long-term storage, consider using hardware wallets to store private keys offline
- Security Precautions: Never share private keys or mnemonic phrases; enable two-factor authentication; regularly update wallet software; be vigilant against phishing websites and scam messages
V. MOVR Potential Risks and Challenges
MOVR Market Risks
- High Volatility: MOVR has experienced a decline of over 77% in the past year, with significant price fluctuations that may result in substantial short-term losses
- Liquidity Risk: With a 24-hour trading volume of approximately $44,537, relatively low liquidity may make it difficult to execute large transactions at ideal prices
- Market Sentiment Impact: As a relatively small-cap project (market cap ranking around 780), MOVR is susceptible to overall crypto market sentiment fluctuations
MOVR Regulatory Risks
- Policy Uncertainty: Changes in cryptocurrency regulatory policies across different countries and regions may affect MOVR's trading and usage
- Compliance Challenges: As EVM-compatible blockchain projects develop, they may face increasing compliance review requirements
- Cross-border Transaction Restrictions: Certain jurisdictions may impose restrictions on cryptocurrency cross-border transactions, affecting MOVR's global liquidity
MOVR Technical Risks
- Smart Contract Vulnerabilities: Although Moonriver is EVM-compatible, smart contract code may contain undiscovered security vulnerabilities
- Network Dependency Risk: Moonriver operates as a parachain on the Kusama network; any technical issues with the Kusama main network could affect Moonriver's normal operation
- Competition Pressure: Facing competition from other EVM-compatible chains (such as other parachains and Layer 2 solutions), market share may be impacted
VI. Conclusion and Action Recommendations
MOVR Investment Value Assessment
MOVR, as a functional and governance token of the Moonriver network, has certain long-term value propositions. As an EVM-compatible parachain in the Kusama ecosystem, Moonriver provides developers with convenient cross-chain development tools and interoperability potential. However, the project currently faces considerable challenges, including significant price declines over the past year, relatively low market liquidity, and intense competition. Short-term investment risks remain high, and investors should carefully evaluate their risk tolerance.
MOVR Investment Recommendations
✅ Beginners: It is recommended to first gain a thorough understanding of blockchain technology and the Kusama ecosystem; start with small investments to familiarize yourself with market volatility characteristics; avoid following trends blindly
✅ Experienced Investors: Consider building positions in batches at relatively low price levels; closely monitor Moonriver ecosystem development and technical update progress; set reasonable stop-loss and take-profit levels
✅ Institutional Investors: Conduct in-depth due diligence, including technical architecture analysis, team background checks, and competitive landscape assessment; consider MOVR as part of a diversified portfolio for ecosystem layout; establish comprehensive risk management mechanisms
MOVR Trading Participation Methods
- Spot Trading: Trade MOVR spot on Gate.com, suitable for medium to long-term holding or short-term band operations
- Staking Participation: Stake MOVR to become a validator or delegator, participate in network consensus, and earn staking rewards
- DeFi Ecosystem Participation: Provide liquidity for decentralized exchanges (DEX) built on the Moonriver blockchain to earn a portion of transaction fees
Cryptocurrency investment carries extremely high risks; this article does not constitute investment advice. Investors should make prudent decisions based on their own risk tolerance and are advised to consult professional financial advisors. Never invest more than you can afford to lose.
FAQ
What is MOVR token and what is its purpose?
MOVR is the native token of Moonriver network, enabling governance participation, transaction fees, and staking rewards. It powers the ecosystem's DeFi applications and smart contract operations on this Polkadot parachain.
What are the main factors affecting MOVR price?
MOVR price is primarily influenced by network activity and adoption on Moonriver, market sentiment, trading volume, Bitcoin and Ethereum price movements, ecosystem developments, and overall cryptocurrency market conditions.
How to conduct technical analysis and price prediction for MOVR?
Analyze MOVR using key indicators: support/resistance levels, moving averages, RSI, and MACD. Monitor trading volume trends, market sentiment, and on-chain metrics. Study historical price patterns and correlation with broader market cycles for informed predictions.
What advantages does MOVR have compared to other Layer 2 solution tokens?
MOVR offers superior interoperability across multiple blockchains, lower transaction costs, faster confirmation times, and a robust ecosystem with extensive DeFi integration. Its Moonbeam network enables seamless Ethereum compatibility while supporting diverse blockchain connections, giving it a competitive edge in the Layer 2 landscape.
What are the risks to consider when investing in MOVR tokens?
MOVR token risks include market volatility, liquidity fluctuations, regulatory changes in blockchain sectors, smart contract vulnerabilities, and competition from other Layer 1 solutions. Monitor network activity and technological developments carefully.
* The information is not intended to be and does not constitute financial advice or any other recommendation of any sort offered or endorsed by Gate.