This comprehensive MSQ price prediction analysis examines MSQUARE's utility token positioned across real estate, advertising, and employment platforms. Starting from MSQ's current price of $0.5144 with $7.8 million market cap, the article projects price movements through 2031, forecasting a slight 2% decline in 2026 followed by recovery and growth phases. The analysis combines historical price patterns, market sentiment analysis, and ecosystem development factors to provide multiple scenarios: conservative ($0.38-$0.50), neutral ($0.50), and optimistic ($0.61+) forecasts. Professional investment strategies include long-term holding with phased position building and active trading using technical analysis tools. The framework emphasizes strict risk management through asset allocation guidelines (1-8% of crypto portfolio based on investor type) and secure storage via Gate Web3 Wallet. Key risks include high volatility, limited liquidity across 2 exchanges, and regulatory uncertainties for payment tokens, making
Introduction: MSQ's Market Position and Investment Value
MSQUARE (MSQ), positioned as a utility token for real economy platforms, has been developing its ecosystem since its launch in 2022. As of 2026, MSQ maintains a market capitalization of approximately $7.8 million, with around 15.16 million tokens in circulation and a current price hovering near $0.51. This asset, designed as a "multi-platform payment solution", is playing an increasingly significant role in connecting real estate information services, advertising platforms, and global talent employment sectors.
This article will comprehensively analyze MSQ's price trends from 2026 to 2031, combining historical patterns, market supply and demand dynamics, ecosystem development, and macroeconomic conditions to provide investors with professional price forecasts and practical investment strategies.
I. MSQ Price History Review and Market Status
MSQ Historical Price Evolution Trajectory
- 2022: MSQ token launched in April with a publish price of 1 USD, marking the initial market entry of MSQUARE's payment ecosystem.
- 2025: In May, the token reached a peak price of 24 USD, representing a substantial upward movement from its launch price.
- 2025: Throughout December, the price experienced downward pressure, declining to 0.3737 USD by December 12.
MSQ Current Market Status
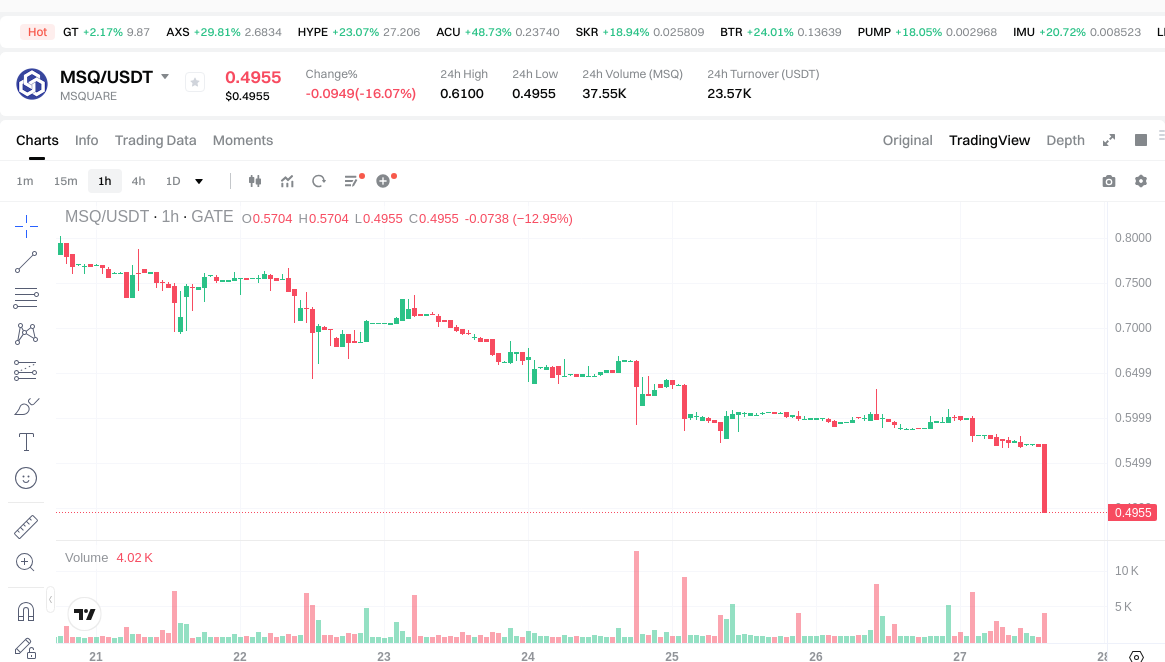
As of January 27, 2026, MSQ is trading at 0.5144 USD, showing notable volatility across different timeframes. The token has declined by 9.84% over the past hour and 10.65% over the past 24 hours, with a 24-hour trading range between 0.5142 USD and 0.61 USD.
Over extended periods, the downward trend becomes more pronounced. The 7-day price movement shows a decline of 34.1%, while the 30-day performance indicates a decrease of 21.82%. The annual performance reveals an 87.48% decline from year-ago levels.
The token maintains a market capitalization of approximately 7.8 million USD, with a circulating supply of 15,155,874 MSQ tokens out of a total supply of 25,916,431 tokens, representing a circulation ratio of 58.38%. The fully diluted market capitalization stands at approximately 13.3 million USD. MSQ currently holds a market ranking of 1327 and accounts for 0.00042% of the overall cryptocurrency market share.
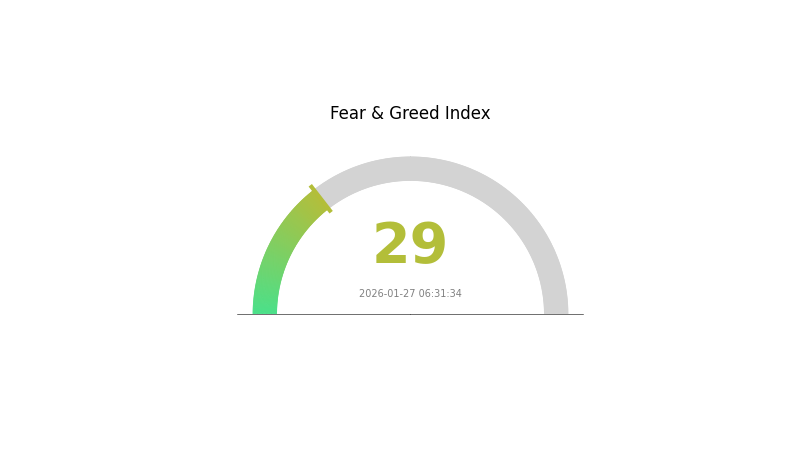
The 24-hour trading volume registers at 21,973.33 USD across 2 exchanges. With 11,022 holders recorded, the token demonstrates a distributed ownership structure. The current market sentiment index stands at 29, indicating a fear-oriented market environment.
Click to view current MSQ market price
MSQ Market Sentiment Index
01-27-2026 Fear and Greed Index: 29 (Fear)
Click to view the current Fear & Greed Index
The crypto market is experiencing a fearful sentiment with the Fear and Greed Index standing at 29. This reading indicates heightened market anxiety and cautious investor behavior. During periods of fear, experienced traders often view market pullbacks as potential buying opportunities, while risk-averse investors may prefer to wait for stability signals. Monitor key support levels and market developments closely, as sentiment shifts can create significant trading opportunities on Gate.com's trading platform.
MSQ Holding Distribution
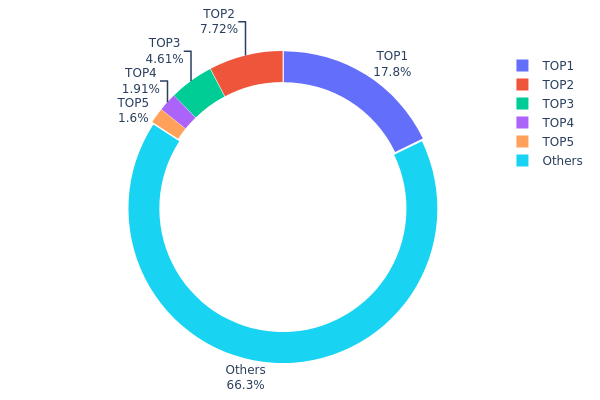
The holding distribution chart reveals the allocation of token supply across different wallet addresses, serving as a key indicator of decentralization and potential market manipulation risks. For MSQ, the current data shows a relatively concentrated holding structure that warrants careful examination.
The top holder controls approximately 17.83% (4.62M tokens) of the total supply, while the second and third largest addresses hold 7.71% and 4.61% respectively. The top five addresses collectively account for 33.64% of the circulating supply, with the remaining 66.36% distributed among other participants. This concentration level suggests a moderate centralization risk, as the top three holders alone control nearly 30% of all tokens. Such distribution patterns could potentially amplify price volatility, particularly if large holders decide to liquidate their positions simultaneously.
From a market structure perspective, this holding pattern presents both opportunities and concerns. While the 66.36% distribution among smaller holders indicates some degree of community participation, the significant influence of top addresses means that major price movements could be triggered by relatively few entities. The current structure suggests that MSQ's on-chain ecosystem may be susceptible to whale movements, potentially leading to increased volatility during periods of heightened trading activity.
Click to view current MSQ Holding Distribution
| Top |
Address |
Holding Qty |
Holding (%) |
| 1 |
0xee3e...ddca37 |
4621.75K |
17.83% |
| 2 |
0x6dc2...48cb43 |
2000.00K |
7.71% |
| 3 |
0x446d...93e83f |
1195.62K |
4.61% |
| 4 |
0xef96...7c2c61 |
493.89K |
1.90% |
| 5 |
0x3fa4...a16b56 |
413.96K |
1.59% |
| - |
Others |
17191.22K |
66.36% |
II. Core Factors Influencing MSQ's Future Price
Market Volatility
- Cryptocurrency Market Dynamics: The cryptocurrency market's inherent high volatility directly impacts MSQ's price performance. Historical trends demonstrate that market turbulence frequently triggers significant value fluctuations in MSQ.
- Historical Patterns: Past market cycles reveal that MSQ experiences pronounced price movements during periods of heightened market volatility, with values responding sharply to broader crypto market conditions.
- Current Impact: MSQ's price trajectory remains sensitive to real-time market sentiment, with trading activity influenced by global news events, regulatory developments, and overall market liquidity conditions.
Technical Innovation and Ecosystem Development
- Machine Learning Integration: Advanced machine learning algorithms and quantitative models are becoming central to market analysis frameworks. These sophisticated analytical tools enable more precise price prediction models and trading strategy optimization.
- High-Frequency Trading Strategies: The deployment of high-frequency trading methodologies introduces new dynamics to MSQ's price discovery mechanism, potentially increasing market efficiency while contributing to short-term price volatility.
- Market Demand Drivers: MSQ's future valuation depends significantly on adoption trends, institutional participation levels, and the development of use cases within its ecosystem, with each factor contributing to long-term price sustainability.
Macroeconomic Environment
- Regulatory Influence: Cryptocurrency-specific regulatory actions and policy announcements continue to exert substantial influence on MSQ's price behavior. Both positive regulatory clarity and restrictive measures can trigger immediate market reactions.
- Market Sentiment Dynamics: The crypto market demonstrates high sensitivity to sentiment shifts. Positive developments such as strategic partnerships or increased adoption rates may drive demand growth, while negative news related to security concerns or regulatory crackdowns could precipitate price declines.
III. 2026-2031 MSQ Price Prediction
2026 Outlook
- Conservative Forecast: $0.38008 - $0.5001
- Neutral Forecast: Around $0.5001
- Optimistic Forecast: Up to $0.60512 (requires favorable market conditions)
Based on the analytical data, MSQ is expected to experience a slight decline of approximately 2% in 2026, with price movements anticipated within a range of $0.38008 to $0.60512. The average trading price is projected to stabilize around $0.5001, reflecting a potential consolidation phase as the market adjusts to prevailing conditions.
2027-2029 Outlook
- Market Phase Expectation: Recovery and growth phase with increasing volatility
- Price Range Predictions:
- 2027: $0.30394 - $0.68524
- 2028: $0.5199 - $0.66844
- 2029: $0.50207 - $0.66943
- Key Catalysts: Market adoption trends, technological developments, and broader cryptocurrency market sentiment
The mid-term projection suggests MSQ may enter a recovery trajectory starting in 2027, with a potential price increase of 7% and an average price near $0.55261. By 2028, the growth momentum could accelerate to approximately 20%, with prices stabilizing between $0.5199 and $0.66844. The trend is expected to continue into 2029, with a projected 25% increase and an average price of $0.64368, indicating strengthening market confidence.
2030-2031 Long-term Outlook
- Baseline Scenario: $0.6106 - $0.68938 (assuming steady market development)
- Optimistic Scenario: $0.65655 - $0.8614 (with enhanced ecosystem growth)
- Transformative Scenario: Potential to reach $0.8614 (under exceptionally favorable conditions including significant adoption and market expansion)
Looking toward the longer term, MSQ shows potential for continued appreciation. The 2030 forecast indicates a 27% price increase with an average of $0.65655, while 2031 projections suggest a 30% growth trajectory. The price range for 2031 extends from $0.45089 to $0.8614, with an average price of $0.67297, reflecting the possibility of sustained upward momentum if market conditions remain supportive.
| Year |
Predicted High Price |
Predicted Average Price |
Predicted Low Price |
Price Change |
| 2026 |
0.60512 |
0.5001 |
0.38008 |
-2 |
| 2027 |
0.68524 |
0.55261 |
0.30394 |
7 |
| 2028 |
0.66844 |
0.61892 |
0.5199 |
20 |
| 2029 |
0.66943 |
0.64368 |
0.50207 |
25 |
| 2030 |
0.68938 |
0.65655 |
0.6106 |
27 |
| 2031 |
0.8614 |
0.67297 |
0.45089 |
30 |
IV. MSQ Professional Investment Strategy and Risk Management
MSQ Investment Methodology
(I) Long-term Holding Strategy
- Target Investors: Investors seeking exposure to real economy platform payment tokens with moderate risk tolerance
- Operational Recommendations:
- Consider MSQ as part of a diversified cryptocurrency portfolio focused on utility tokens
- Monitor the development progress of MSQUARE's three platforms (Metastar, MOAD, and K-PAL) for adoption indicators
- Implement a phased position building approach rather than lump-sum investment given current market volatility
- Storage Solution: Gate Web3 Wallet supports MATIC network tokens, providing secure storage for MSQ tokens with user-controlled private keys
(II) Active Trading Strategy
- Technical Analysis Tools:
- Moving Averages: Use 20-day and 50-day moving averages to identify trend directions, noting MSQ has experienced significant downward pressure with -34.1% change over 7 days
- Volume Analysis: Monitor the 24-hour trading volume ($21,973.33) relative to market cap to assess liquidity conditions before entering positions
- Swing Trading Considerations:
- Given the current trading range between $0.5142 (24h low) and $0.61 (24h high), set tight stop-loss orders
- Consider the substantial gap between current price ($0.5144) and all-time high ($24 on May 26, 2025) when assessing risk-reward ratios
MSQ Risk Management Framework
(I) Asset Allocation Principles
- Conservative Investors: 1-2% of cryptocurrency portfolio allocation
- Aggressive Investors: 3-5% of cryptocurrency portfolio allocation
- Professional Investors: Up to 8% with active hedging strategies
(II) Risk Hedging Solutions
- Position Sizing: Limit single position exposure considering MSQ's relatively small market cap of $7.79 million
- Profit Taking: Establish predetermined profit-taking levels, particularly given the -87.48% decline over the past year
(III) Secure Storage Solutions
- Hot Wallet Recommendation: Gate Web3 Wallet for convenient trading and platform utility usage
- Cold Storage Option: Hardware wallet solutions for long-term holdings exceeding trading requirements
- Security Precautions: Enable two-factor authentication, never share private keys, and verify contract address (0x6A8Ec2d9BfBDD20A7F5A4E89D640F7E7cebA4499) when conducting transactions on the Polygon network
V. MSQ Potential Risks and Challenges
MSQ Market Risks
- High Volatility: MSQ has demonstrated substantial price volatility, with a -34.1% decline over 7 days and -87.48% over the past year
- Limited Liquidity: With only 2 exchange listings and daily trading volume of approximately $21,973, position entry and exit may face liquidity constraints
- Low Market Capitalization: Current market cap of $7.79 million places MSQ in a vulnerable position relative to broader market movements
MSQ Regulatory Risks
- Payment Token Classification: As MSQ functions as a payment method across multiple platforms, regulatory changes affecting payment tokens could impact utility and adoption
- Cross-border Payment Regulations: The K-PAL platform's international payment features may face evolving compliance requirements in different jurisdictions
- Platform Service Compliance: Real estate information services (Metastar) and employment facilitation (K-PAL) may encounter sector-specific regulatory scrutiny
MSQ Technical Risks
- Platform Dependency: Token value relies heavily on adoption of MSQUARE's three platforms (Metastar, MOAD, K-PAL)
- Network Dependency: As a Polygon network token, MSQ's functionality depends on the Polygon blockchain's continued operation and security
- Smart Contract Risk: Potential vulnerabilities in the token contract (0x6A8Ec2d9BfBDD20A7F5A4E89D640F7E7cebA4499) could affect token security
VI. Conclusion and Action Recommendations
MSQ Investment Value Assessment
MSQ presents a utility-focused value proposition tied to real economy platforms spanning real estate information, advertising services, and international talent placement. With a circulating supply of 15.16 million tokens (58.38% of total supply) and current market dominance of 0.00042%, the token remains in early adoption stages. The significant price decline from its May 2025 all-time high of $24 to the current price of $0.5144 reflects either market correction or fundamental challenges. The token's utility across three operational platforms provides potential long-term value, though current market conditions indicate heightened short-term risk. Investors should weigh the established platform ecosystem against limited liquidity and substantial recent price depreciation.
MSQ Investment Recommendations
✅ Beginners: Start with minimal allocation (under 1% of crypto portfolio), prioritize education about MSQUARE's platform ecosystem, and avoid leveraged positions given current volatility
✅ Experienced Investors: Consider MSQ as a speculative utility token position with strict position sizing (2-3% maximum), implement dollar-cost averaging during stable periods, and monitor platform adoption metrics
✅ Institutional Investors: Conduct thorough due diligence on platform revenue models and user adoption, assess liquidity constraints before position building, and evaluate partnership opportunities with MSQUARE ecosystem
MSQ Trading Participation Methods
- Spot Trading: Purchase MSQ tokens on Gate.com with fiat or cryptocurrency, benefiting from direct ownership and platform utility access
- Platform Utility Usage: Acquire MSQ tokens for direct payment on Metastar, MOAD, or K-PAL platforms to access service discounts
- Gradual Accumulation: Implement systematic purchase plans during periods of reduced volatility to minimize timing risk
Cryptocurrency investment carries extremely high risk, and this article does not constitute investment advice. Investors should make prudent decisions based on their own risk tolerance and are advised to consult professional financial advisors. Never invest more than you can afford to lose.
FAQ
What is the historical price movement of MSQ? What major fluctuation events occurred in the past?
MSQ has experienced significant price volatility driven by major economic events and market cycles. Notable fluctuations occurred during 2021-2022 global market downturns and 2023 policy shifts. Key drivers include market sentiment, regulatory changes, and broader crypto market trends affecting trading volume.
What are the main factors affecting MSQ price? How to analyze market sentiment, technical analysis, and fundamentals respectively?
MSQ price is influenced by market sentiment, technical factors, and fundamentals. Market sentiment reflects investor psychology and social trends. Technical analysis examines price patterns and trading volume. Fundamental analysis evaluates project development, tokenomics, and adoption metrics.
What are professional analysts' price predictions for MSQ? What are the basis and methodology of these predictions?
MSQ price predictions by analysts are based on market trends, trading volume analysis, and fundamental indicators. Methodologies include technical analysis, on-chain data evaluation, and market sentiment assessment to forecast potential price movements.
Common tools include moving averages, RSI, MACD, and Bollinger Bands. Use them by combining multiple indicators for comprehensive analysis to improve prediction accuracy and identify trend reversals effectively.
What are the risks of MSQ price prediction trading and how to manage them?
MSQ price prediction trading involves market volatility and liquidity risks. Effective risk management includes portfolio diversification by combining MSQ with mainstream cryptocurrencies, and strict position sizing based on your risk tolerance and capital allocation strategy.
How does MSQ's price volatility and prediction difficulty compare to similar assets?
MSQ exhibits moderate volatility typical of emerging crypto assets. Its price movements are influenced by market sentiment and trading volume, making predictions moderately challenging but feasible through technical and fundamental analysis compared to established assets.
* The information is not intended to be and does not constitute financial advice or any other recommendation of any sort offered or endorsed by Gate.