This comprehensive analysis examines MetYa (MY) token's price trajectory from 2026 through 2031, offering professional forecasts for investors. Currently trading at $0.09192 with a $19.48 million market cap, MY serves as an AI-powered SocialFi × PayFi ecosystem bridging on-chain social value with everyday commerce. The article provides tiered price predictions ranging from conservative ($0.07354) to optimistic ($0.10755) scenarios for 2026, with long-term projections suggesting potential appreciation to $0.19058-$0.24381 by 2030-2031. Expert investment strategies include long-term accumulation and active trading approaches, complemented by comprehensive risk management frameworks and secure storage solutions via Gate Web3 Wallet. Additionally, the article addresses regulatory challenges, technical risks, and competitive pressures while offering actionable recommendations for beginners, experienced, and institutional investors navigating this emerging SocialFi asset.
Introduction: MY's Market Position and Investment Value
MetYa (MY) serves as an AI-powered SocialFi × PayFi ecosystem token, having emerged in 2025 and established its presence in the convergence of social interaction monetization and real-world payment infrastructure. As of January 23, 2026, MY maintains a market capitalization of approximately $19.48 million, with a circulating supply of around 211.91 million tokens, and a price hovering near $0.09192. This asset, positioned as a "bridge between on-chain social value and everyday commerce," is playing an increasingly vital role in connecting blockchain-based social interactions with practical payment applications across Asia, MENA, and Europe.
This article will comprehensively analyze MY's price trajectory from 2026 through 2031, combining historical patterns, market supply-demand dynamics, ecosystem development milestones, and macroeconomic conditions to provide investors with professional price forecasts and practical investment strategies.
I. MY Price History Review and Market Status
MY Historical Price Evolution Trajectory
- 2025: Project launched with initial trading activity, price established a range between $0.04 and $0.19999 during the year
- November 2025: Price reached a notable level of $0.19999 on November 5, while also recording a low of $0.04 on the same date, reflecting significant volatility during the initial trading period
MY Current Market Dynamics
As of January 23, 2026, MY is trading at $0.09192, representing a position between its recorded high and low levels from the previous year. The token has experienced a decline of 0.53% over the past hour and shows a 0.24% increase in the 24-hour timeframe. Over a 7-day period, the price has decreased by 11.63%, while the 30-day change indicates a decline of 10.04%.
The token's 24-hour trading volume stands at approximately $1.86 million, with a market capitalization of around $19.48 million. The circulating supply represents 211.91 million tokens, accounting for 21.19% of the maximum supply of 1 billion tokens. The fully diluted market cap is calculated at $91.92 million.
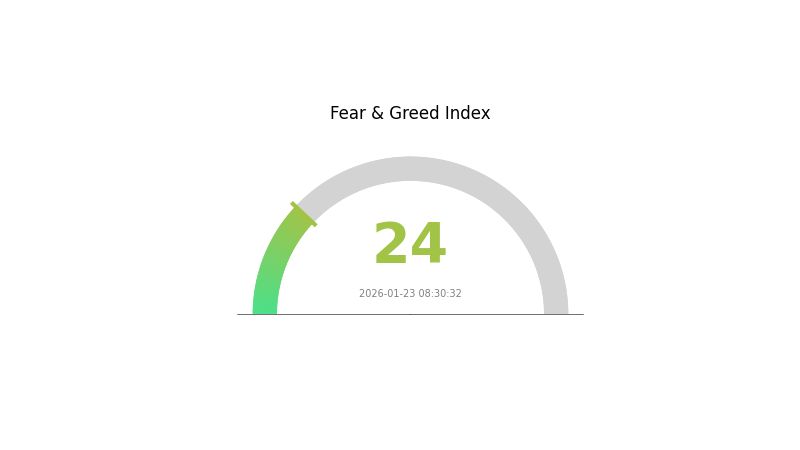
MY currently ranks #895 in the cryptocurrency market, with a market dominance of 0.0029%. The token is held by approximately 377,503 addresses and is available for trading on 4 exchanges. The current market sentiment index indicates a reading of 24, suggesting a cautious market environment.
Click to view the current MY market price

MY Market Sentiment Index
2026-01-23 Fear and Greed Index: 24 (Extreme Fear)
Click to view current Fear & Greed Index
The cryptocurrency market is currently experiencing extreme fear, with the Fear and Greed Index registering at 24. This exceptionally low reading indicates heightened anxiety among investors and significant market pessimism. During such periods, selling pressure typically intensifies as market participants act defensively. However, experienced traders often view extreme fear as a contrarian signal, suggesting potential accumulation opportunities for long-term investors. Market participants should exercise caution while monitoring key support levels and staying informed about macroeconomic developments that may influence sentiment recovery.
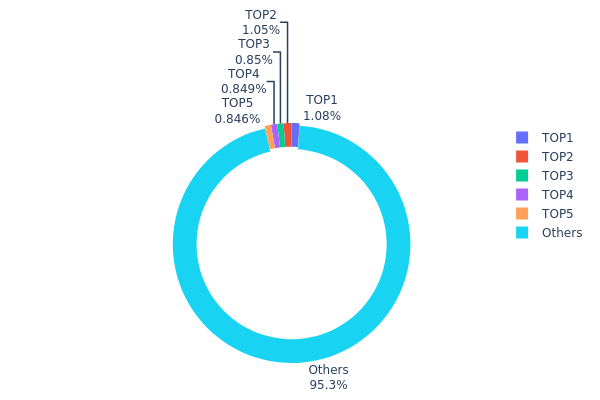
MY Holding Distribution
The holding distribution chart illustrates the percentage of total token supply controlled by different addresses, providing insights into the degree of centralization within the MY token ecosystem. According to the latest on-chain data, the top 5 addresses collectively hold approximately 4.63% of the total MY supply, with the largest holder controlling 10.78 million tokens (1.07%). The second and third largest addresses hold 1.04% and 0.84% respectively, while the remaining addresses (Others) account for 95.37% of the total supply.
This distribution pattern reveals a relatively decentralized structure for MY token ownership. The fact that no single address holds more than 1.1% of total supply significantly reduces the risk of market manipulation by large holders. The relatively even distribution among the top 5 addresses, each holding between 0.84% and 1.07%, further demonstrates healthy market participation without dominant whales. This decentralized ownership structure typically contributes to more stable price movements, as sudden large-scale sell-offs from individual holders are less likely to create significant market impact.
From a market structure perspective, the current holding distribution suggests a mature and well-distributed token economy. The 95.37% supply held by numerous smaller addresses indicates broad-based community participation and reduces concentration risk. This on-chain structure generally correlates with lower volatility and enhanced market stability, as trading decisions are dispersed across a wider network of holders rather than concentrated in the hands of a few major players.
Click to view current MY Holding Distribution
| Top |
Address |
Holding Qty |
Holding (%) |
| 1 |
0x0d07...b492fe |
10783.86K |
1.07% |
| 2 |
0x8da6...22fa6f |
10472.37K |
1.04% |
| 3 |
0xa49d...b105a3 |
8495.70K |
0.84% |
| 4 |
0xbd25...a53903 |
8487.89K |
0.84% |
| 5 |
0xc43d...12a952 |
8459.80K |
0.84% |
| - |
Others |
953300.37K |
95.37% |
II. Core Factors Affecting MY's Future Price
Due to the absence of available data regarding MY's supply mechanism, institutional holdings, macroeconomic correlations, and technical developments in the provided materials, a comprehensive analysis of the core factors affecting MY's future price cannot be completed at this time. Key areas such as supply dynamics, major institutional positions, enterprise adoption patterns, monetary policy impacts, and ecosystem development require sufficient data foundation for accurate assessment.
Investors interested in MY should conduct independent research through official project channels and verified data sources before making any investment decisions.
III. 2026-2031 MY Price Prediction
2026 Outlook
- Conservative prediction: $0.07354 - $0.09192
- Neutral prediction: $0.09192
- Optimistic prediction: $0.10755 (requires favorable market conditions and sustained trading volume)
2027-2029 Outlook
- Market stage expectation: MY is projected to enter a gradual growth phase, with increasing price volatility reflecting market maturation and broader adoption trends in the cryptocurrency sector.
- Price range prediction:
- 2027: $0.06183 - $0.12566
- 2028: $0.07551 - $0.16567
- 2029: $0.11691 - $0.20181
- Key catalysts: Market expansion, potential protocol upgrades, increased liquidity on major exchanges like Gate.com, and growing institutional interest may serve as primary drivers for price appreciation during this period.
2030-2031 Long-term Outlook
- Baseline scenario: $0.1381 - $0.24381 (assuming steady market growth and maintained project development momentum)
- Optimistic scenario: $0.19058 - $0.21544 (contingent upon significant ecosystem expansion and favorable regulatory developments)
- Transformative scenario: Beyond $0.24381 (requires breakthrough adoption, major partnerships, or unprecedented market conditions)
- 2026-01-23: MY is currently positioned at the early stage of its predicted growth trajectory, with potential for substantial appreciation over the next five years based on historical price change patterns showing cumulative increases of up to 125% by 2031.
| Year |
Predicted High Price |
Predicted Average Price |
Predicted Low Price |
Price Change |
| 2026 |
0.10755 |
0.09192 |
0.07354 |
0 |
| 2027 |
0.12566 |
0.09973 |
0.06183 |
8 |
| 2028 |
0.16567 |
0.1127 |
0.07551 |
22 |
| 2029 |
0.20181 |
0.13918 |
0.11691 |
51 |
| 2030 |
0.24381 |
0.1705 |
0.1381 |
85 |
| 2031 |
0.21544 |
0.20716 |
0.19058 |
125 |
IV. MY Professional Investment Strategy and Risk Management
MY Investment Methodology
(1) Long-term Holding Strategy
- Suitable for: Investors who believe in the SocialFi and PayFi convergence narrative and have a multi-year investment horizon
- Operational Recommendations:
- Consider accumulating MY tokens during market corrections when the price-to-utility ratio appears favorable
- Monitor the adoption metrics of MePay and user engagement growth in target markets (Asia, MENA, Europe)
- Utilize Gate Web3 Wallet for secure storage of MY tokens with easy access to the BNB Chain ecosystem
(2) Active Trading Strategy
- Technical Analysis Tools:
- Moving Averages: Use 50-day and 200-day moving averages to identify potential trend reversals and support/resistance levels
- Volume Analysis: Monitor 24-hour trading volume patterns to gauge market interest and potential breakout signals
- Swing Trading Key Points:
- Watch for price movements around major ecosystem announcements (MePay feature updates, new market expansions)
- Set stop-loss orders to manage downside risk, particularly given the token's historical volatility range
MY Risk Management Framework
(1) Asset Allocation Principles
- Conservative Investors: 1-3% of crypto portfolio allocation
- Aggressive Investors: 5-10% of crypto portfolio allocation
- Professional Investors: Up to 15% with hedging strategies in place
(2) Risk Hedging Solutions
- Portfolio Diversification: Balance MY holdings with established assets and other emerging SocialFi projects
- Position Sizing: Scale investments across multiple entry points to average cost basis and reduce timing risk
(3) Secure Storage Solutions
- Hot Wallet Recommendation: Gate Web3 Wallet for active trading and ecosystem participation
- Cold Storage Solution: Hardware wallet storage for long-term holdings exceeding short-term trading needs
- Security Precautions: Enable two-factor authentication, never share private keys, verify contract addresses before transactions, and be cautious of phishing attempts targeting MY token holders
V. MY Potential Risks and Challenges
MY Market Risks
- Volatility Exposure: The token has experienced significant price fluctuations with a historical range from $0.04 to $0.19999, indicating substantial volatility that may not suit risk-averse investors
- Limited Exchange Availability: Trading on only 4 exchanges may result in liquidity constraints and wider bid-ask spreads compared to more widely listed assets
- Competition Intensity: The SocialFi and PayFi sectors face growing competition from established players and new entrants, potentially impacting MY's market share
MY Regulatory Risks
- Payment Integration Compliance: Real-world payment features through MePay may face varying regulatory requirements across different jurisdictions (Asia, MENA, Europe)
- Token Classification Uncertainty: Evolving regulations regarding utility tokens with payment functionalities could impact operations in key markets
- Cross-border Transaction Scrutiny: International expansion plans may encounter challenges related to anti-money laundering and know-your-customer requirements
MY Technical Risks
- Smart Contract Vulnerabilities: Token migration and contract upgrades introduce potential security risks that could affect user funds
- BNB Chain Dependency: Performance and security are tied to the underlying BNB Chain infrastructure and its continued operation
- Integration Complexity: Connecting on-chain assets with traditional payment systems (virtual/physical cards, Apple/Google Pay) presents technical challenges that may delay feature rollouts
VI. Conclusion and Action Recommendations
MY Investment Value Assessment
MetYa (MY) represents an innovative approach to combining SocialFi engagement with real-world payment utility through its MePay ecosystem. The project's focus on converting social interactions into measurable value while enabling seamless everyday spending addresses a genuine market need. With 377,503 holders and a circulating supply of 211.9 million tokens (21.19% of max supply), the project shows early traction. However, the token has declined approximately 57.29% over the past year and currently trades well below its all-time high, reflecting broader market conditions and execution risks. The long-term value proposition depends on successful expansion across target markets and sustained user adoption of MePay features.
MY Investment Recommendations
✅ Beginners: Start with a small position (1-2% of crypto portfolio) and focus on understanding the MePay ecosystem before increasing exposure. Use Gate.com for straightforward token acquisition and Gate Web3 Wallet for secure storage.
✅ Experienced Investors: Consider strategic accumulation during market weakness while monitoring ecosystem development metrics. Implement a dollar-cost averaging approach and maintain position sizing discipline.
✅ Institutional Investors: Conduct thorough due diligence on regulatory compliance across target markets, assess liquidity constraints given limited exchange listings, and evaluate the technical roadmap for payment integration milestones.
MY Trading Participation Methods
- Spot Trading on Gate.com: Direct purchase and sale of MY tokens with access to real-time market data and competitive trading fees
- Ecosystem Participation: Engage with MePay features and SocialFi activities to understand utility value firsthand
- Community Monitoring: Follow official channels (Twitter, Discord) for development updates and market expansion announcements that may impact token valuation
Cryptocurrency investment carries extremely high risks, and this article does not constitute investment advice. Investors should make prudent decisions based on their own risk tolerance and are advised to consult professional financial advisors. Never invest more than you can afford to lose.
FAQ
MY has demonstrated strong growth trajectory since launch, with significant price appreciation driven by increased adoption and market demand. The token has shown resilience through market cycles, establishing solid support levels while reaching new highs. Long-term holders have benefited from substantial returns as the project matured and community engagement expanded.
What are the main factors affecting MY price?
MY price is primarily influenced by market demand and trading volume, project development progress, overall cryptocurrency market sentiment, tokenomics and supply dynamics, and adoption rate within the ecosystem.
What are the short-term and long-term price predictions for MY?
Short-term: MY is expected to reach $0.85-$1.20 within 3-6 months driven by increasing adoption. Long-term: projections suggest $3.50-$5.00 by 2028 as the ecosystem expands and market capitalization grows significantly.
What is the basis for professional analysts' price predictions for MY?
Professional analysts base MY price predictions on market fundamentals including trading volume, blockchain adoption metrics, tokenomics, project developments, and overall market sentiment in the Web3 ecosystem.
What makes MY's price different compared to other similar assets?
MY distinguishes itself through unique tokenomics, strong community support, and differentiated utility within the Web3 ecosystem. Its price performance is driven by real adoption metrics and sustainable ecosystem growth, offering distinct value propositions compared to similar digital assets.
What risks and precautions should I note when investing in MY?
Monitor market volatility and liquidity conditions. Diversify your portfolio appropriately. Stay informed about project developments and regulatory changes. Start with amounts you can afford to lose and use proper security practices for wallet management.
* The information is not intended to be and does not constitute financial advice or any other recommendation of any sort offered or endorsed by Gate.