This comprehensive article analyzes MetYa (MY), an AI-powered SocialFi×PayFi ecosystem token currently trading at $0.09257 with a $19.62M market cap. It provides professional price analysis spanning 2026-2031, combining historical market data, supply-demand dynamics, and ecosystem development trends to guide investment decisions. The article examines MY's market position, holdings distribution showing healthy decentralization with top holders controlling only 4.63% of supply, and detailed price outlooks ranging from conservative ($0.05546-$0.09243 in 2026) to optimistic scenarios ($0.19687 by 2031). It presents three investment methodologies including long-term holding and active trading strategies on Gate, coupled with comprehensive risk management frameworks for different investor profiles. The guide addresses regulatory compliance challenges, technical integration risks, and market volatility concerns while offering practical recommendations for beginners, experienced traders, and institutional investors s
Introduction: MY's Market Position and Investment Value
MetYa (MY), as an AI-powered SocialFi × PayFi ecosystem token, has been actively developing its real-world payment and social interaction integration since its launch. As of 2026, MY maintains a market capitalization of approximately $19.62 million, with a circulating supply of around 211.91 million tokens, and its price stabilizes at approximately $0.09257. This asset, recognized for its innovative approach to bridging on-chain assets with real-world payments through MePay (the upgraded MetyaCard), is playing an increasingly significant role in the convergence of social finance and payment infrastructure, particularly across Asia, MENA, and European markets.
This article will comprehensively analyze MY's price trajectory from 2026 to 2031, combining historical patterns, market supply-demand dynamics, ecosystem development, and macroeconomic environments to provide investors with professional price forecasts and practical investment strategies.
I. MY Price History Review and Market Status
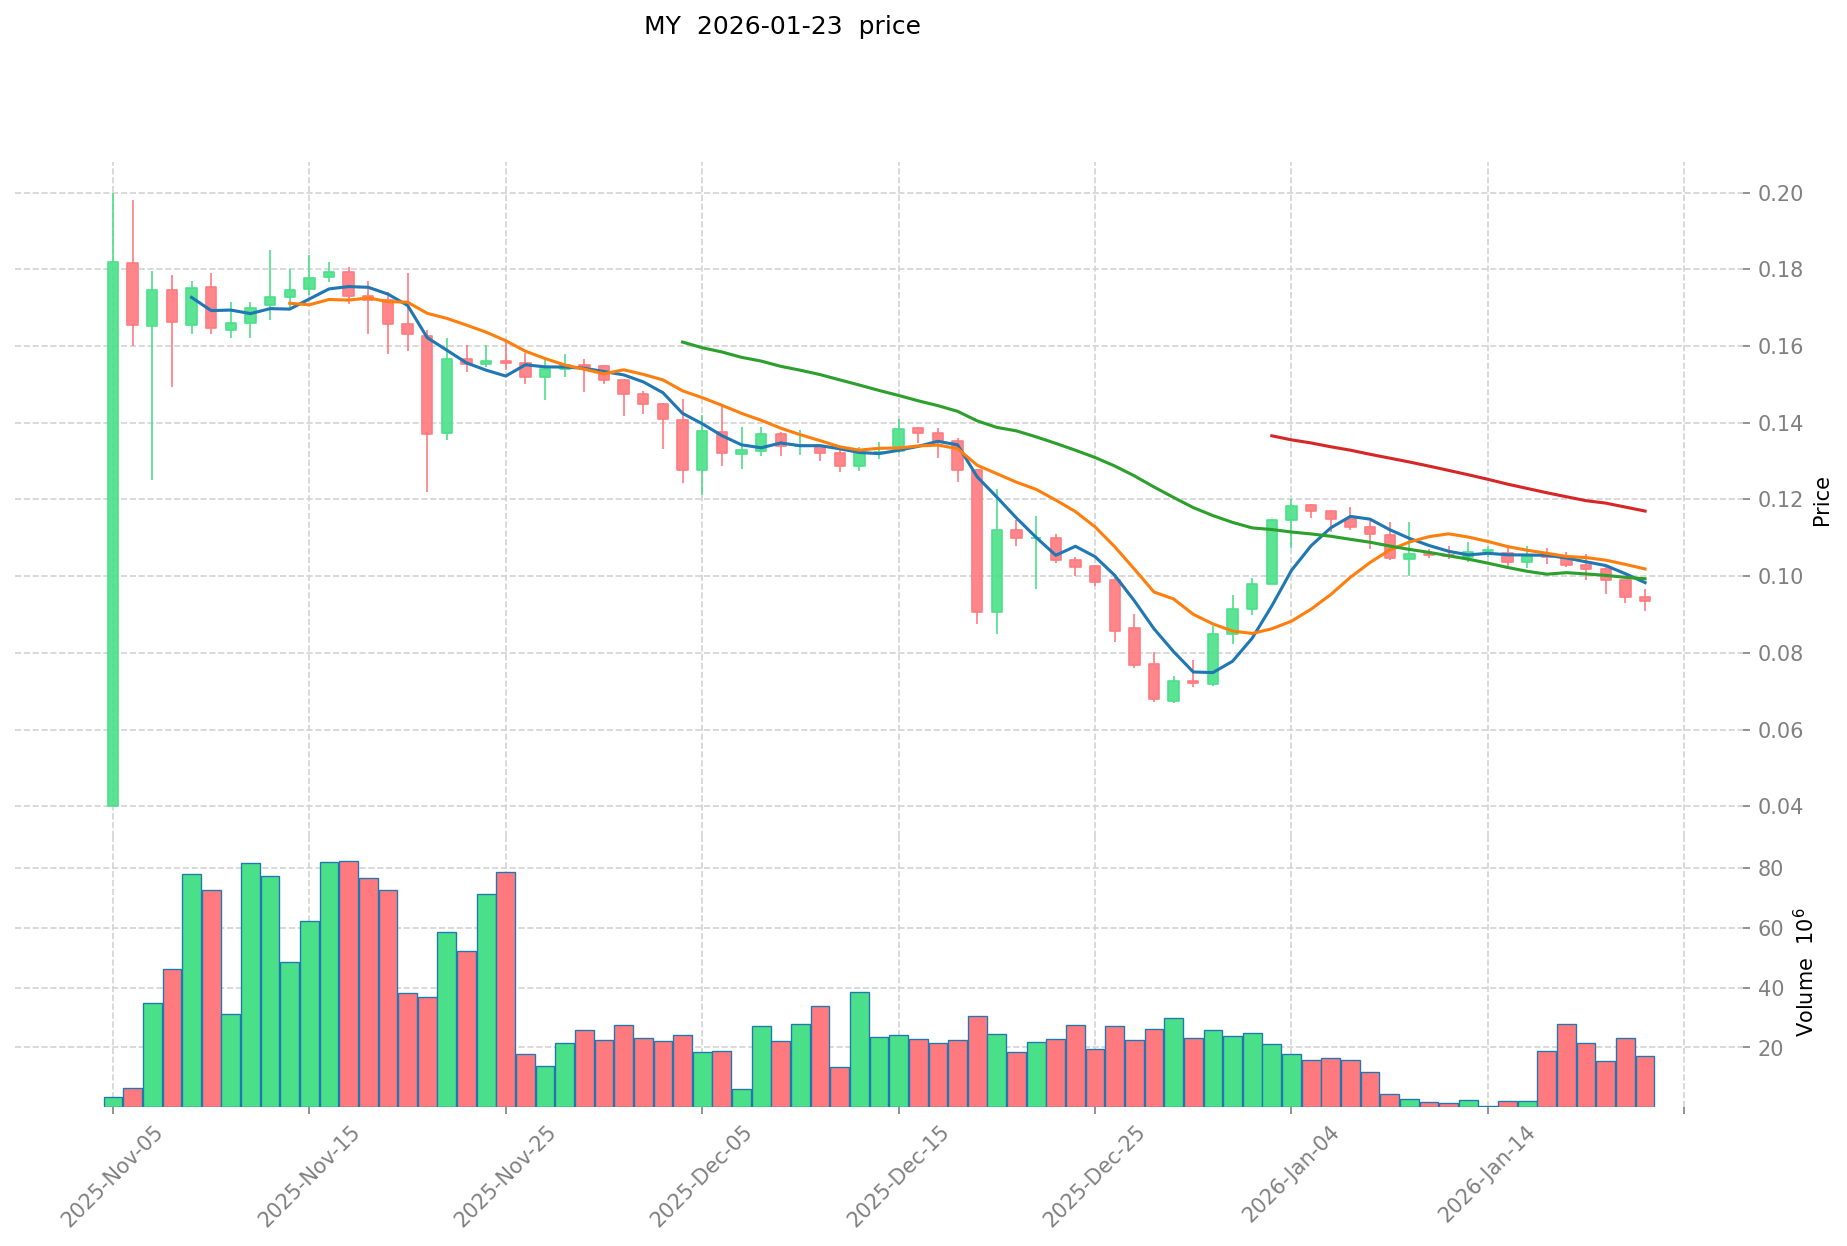
MY Historical Price Evolution Trajectory
- 2025: Launched on November 5th, price experienced significant volatility with ATH at $0.19999 and ATL at $0.04
- Recent period: Token underwent contract/ticker migration on BNB Chain to align with brand upgrade and ecosystem expansion
- Current phase: Price declined approximately 58.63% over the past year, reflecting broader market adjustments
MY Current Market Situation
As of January 23, 2026, MY is trading at $0.09257, showing a modest increase of 0.83% over the past 24 hours. The token demonstrated intraday volatility with a 24-hour high of $0.09517 and low of $0.09079.
The current market capitalization stands at approximately $19.62 million, with a circulating supply of 211.91 million tokens representing 21.19% of the total supply of 1 billion tokens. The fully diluted market cap is calculated at $92.57 million. MY maintains a market dominance of 0.0029% within the broader cryptocurrency ecosystem.
Over different timeframes, MY has shown varied performance: a 0.36% gain in the past hour, a decline of 10.74% over the past week, and a 9.13% decrease over the past 30 days. The 24-hour trading volume reached approximately $1.93 million across 4 exchanges where the token is listed.
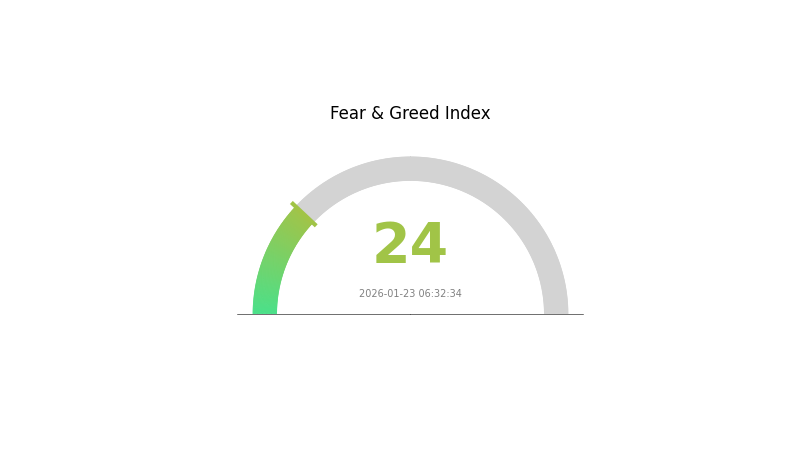
The token has attracted a community of 377,503 holders on the BNB Chain, indicating growing adoption of the Metya ecosystem. Current market sentiment reflects a cautious environment, with the crypto fear and greed index registering 24, indicating extreme fear conditions.
Click to check the current MY market price
MY Market Sentiment Indicator
2026-01-23 Fear and Greed Index: 24 (Extreme Fear)
Click to view the current Fear & Greed Index
The cryptocurrency market is currently experiencing extreme fear with the Fear and Greed Index at 24. This reading indicates significant market pessimism and heightened investor anxiety. During periods of extreme fear, market volatility tends to increase as investors become cautious with their positions. Historically, such extreme sentiment levels have often preceded market recoveries, as they typically represent oversold conditions. Traders and investors should remain vigilant while monitoring key support levels and fundamental developments in the market.
MY Holdings Distribution
The holdings distribution chart illustrates the allocation of MY tokens across different blockchain addresses, revealing the degree of decentralization and concentration within the token's ownership structure. This metric serves as a crucial indicator of market health, as it directly impacts price stability, governance effectiveness, and the potential for market manipulation.
Based on the current data, MY demonstrates a relatively decentralized holdings structure with a healthy distribution pattern. The top five addresses collectively hold approximately 4.63% of the total supply, with the largest single holder controlling only 1.07% (10.78M tokens). This modest concentration level suggests a well-dispersed ownership model, which typically enhances market resilience against coordinated sell pressure. The remaining 95.37% of tokens are distributed among numerous other addresses, indicating broad community participation and reducing the risk of price manipulation by any single entity or small group of whales.
From a market structure perspective, this distribution pattern provides several positive implications for MY's ecosystem stability. The absence of dominant holders minimizes the risk of sudden large-scale liquidations that could trigger cascading price drops. Additionally, the balanced distribution supports more organic price discovery mechanisms and reduces vulnerability to whale-driven volatility spikes. This decentralized ownership structure aligns with healthy tokenomics principles and suggests a mature market environment where price movements are more likely to reflect genuine supply-demand dynamics rather than concentrated holder actions.
Click to view current MY Holdings Distribution
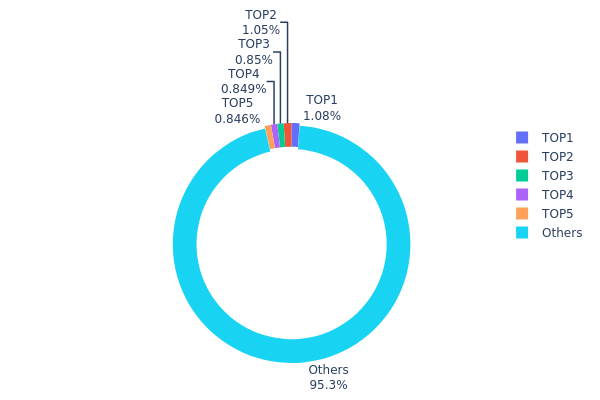
| Top |
Address |
Holding Qty |
Holding (%) |
| 1 |
0x0d07...b492fe |
10783.86K |
1.07% |
| 2 |
0x8da6...22fa6f |
10472.37K |
1.04% |
| 3 |
0xa49d...b105a3 |
8495.70K |
0.84% |
| 4 |
0xbd25...a53903 |
8487.89K |
0.84% |
| 5 |
0xc43d...12a952 |
8459.80K |
0.84% |
| - |
Others |
953300.37K |
95.37% |
II. Core Factors Affecting MY's Future Price
Based on the available information, there is currently insufficient data to provide a comprehensive analysis of the core factors affecting MY's future price. The following key areas would typically influence cryptocurrency valuations:
Supply Mechanism
No specific information is available regarding MY's supply mechanism, including tokenomics, emission schedules, or deflationary features.
Institutional and Whale Activity
There is no available data on institutional holdings, corporate adoption, or regulatory policies specifically related to MY at this time.
Macroeconomic Environment
While macroeconomic factors generally affect the broader cryptocurrency market, specific impacts on MY cannot be determined without additional data regarding its market positioning and correlation with traditional financial instruments.
Technical Development and Ecosystem Building
No information is currently available about MY's technical roadmap, planned upgrades, or ecosystem applications.
Note: This analysis is limited by the lack of source material. For accurate investment decisions, please conduct thorough research and consult multiple reliable sources regarding MY's fundamentals, team background, technological innovations, and market positioning.
III. 2026-2031 MY Price Prediction
2026 Outlook
- Conservative prediction: $0.05546 - $0.09243
- Neutral prediction: approximately $0.09243
- Optimistic prediction: up to $0.11831 (requires favorable market conditions and increased adoption)
2027-2029 Mid-term Outlook
- Market stage expectation: MY is anticipated to enter a gradual growth phase, with price volatility potentially stabilizing as the project matures and gains broader market recognition
- Price range predictions:
- 2027: $0.0569 - $0.13487
- 2028: $0.06246 - $0.12613
- 2029: $0.09481 - $0.14036
- Key catalysts: Technological development milestones, ecosystem expansion, strategic partnerships, and overall cryptocurrency market sentiment could serve as primary drivers for price appreciation
2030-2031 Long-term Outlook
- Baseline scenario: $0.10144 - $0.13174 (assuming steady project development and moderate market growth)
- Optimistic scenario: $0.13174 - $0.1436 (driven by significant adoption increases and favorable regulatory environment)
- Transformative scenario: approaching $0.19687 (contingent upon exceptional technological breakthroughs, mass adoption, or major institutional partnerships)
- 2026-01-23: MY displays early-stage market characteristics with price predictions ranging from $0.05546 to $0.11831, reflecting current market positioning and growth potential
| Year |
Predicted High Price |
Predicted Average Price |
Predicted Low Price |
Price Change |
| 2026 |
0.11831 |
0.09243 |
0.05546 |
0 |
| 2027 |
0.13487 |
0.10537 |
0.0569 |
13 |
| 2028 |
0.12613 |
0.12012 |
0.06246 |
29 |
| 2029 |
0.14036 |
0.12313 |
0.09481 |
33 |
| 2030 |
0.1436 |
0.13174 |
0.10144 |
42 |
| 2031 |
0.19687 |
0.13767 |
0.08811 |
48 |
IV. MY Professional Investment Strategy and Risk Management
MY Investment Methodology
(1) Long-term Holding Strategy
- Suitable for: Investors who believe in the long-term potential of AI-powered SocialFi × PayFi ecosystems and are willing to hold through market volatility
- Operational Recommendations:
- Consider accumulating MY tokens during market dips when the price approaches key support levels
- Monitor the development progress of MePay integration with Apple/Google Pay and expansion into Asia, MENA, and Europe regions
- Store tokens in secure wallets such as Gate Web3 Wallet for long-term holding, ensuring private key security
(2) Active Trading Strategy
- Technical Analysis Tools:
- Moving Averages: Use 50-day and 200-day moving averages to identify trend directions and potential reversal points
- Volume Analysis: Monitor 24-hour trading volume (currently $1.93M) to confirm price movements and identify potential breakouts
- Swing Trading Key Points:
- Pay attention to the 24-hour price range ($0.09079 - $0.09517) to identify support and resistance levels
- Consider the token's recent performance showing 0.83% gain in 24 hours but -10.74% decline over 7 days for timing entries and exits
MY Risk Management Framework
(1) Asset Allocation Principles
- Conservative Investors: 1-3% of crypto portfolio
- Aggressive Investors: 5-8% of crypto portfolio
- Professional Investors: Up to 10% of crypto portfolio with active hedging strategies
(2) Risk Hedging Solutions
- Portfolio Diversification: Combine MY with established cryptocurrencies and stablecoins to reduce concentration risk
- Position Sizing: Start with smaller positions and scale up as the project demonstrates adoption milestones
(3) Secure Storage Solutions
- Hot Wallet Recommendation: Gate Web3 Wallet for convenient trading and staking participation
- Cold Storage Option: Hardware wallets for long-term holdings, especially for larger positions
- Security Precautions: Never share private keys, enable two-factor authentication, and be cautious of phishing attempts
V. MY Potential Risks and Challenges
MY Market Risks
- High Volatility: MY has experienced significant price fluctuations, with a 58.63% decline over the past year, indicating substantial market volatility
- Limited Liquidity: With a market cap of approximately $19.62M and ranking at #893, the token may face liquidity challenges during large transactions
- Market Sentiment Dependency: As a SocialFi project, success heavily relies on user adoption and engagement levels
MY Regulatory Risks
- Payment Integration Compliance: MePay's connection to real-world payments (virtual/physical cards) may face regulatory scrutiny in different jurisdictions
- Cross-border Operations: Expansion plans across Asia, MENA, and Europe require compliance with varied regulatory frameworks
- Token Classification: Regulatory authorities in different regions may classify MY differently, affecting its trading and usage
MY Technical Risks
- Smart Contract Vulnerabilities: As a BEP-20 token on BNB Chain, MY is subject to potential smart contract bugs or exploits
- Platform Dependency: Heavy reliance on BNB Chain infrastructure means any network issues could affect MY functionality
- Integration Complexity: The planned Apple/Google Pay integration presents technical challenges that may delay roadmap execution
VI. Conclusion and Action Recommendations
MY Investment Value Assessment
MetYa (MY) represents an innovative approach combining SocialFi and PayFi elements with AI-powered features, targeting real-world payment use cases through MePay. With a circulating supply of 211.9M tokens (21.19% of max supply) and a fully diluted market cap of $92.57M, the project has potential upside if adoption materializes. However, the significant year-over-year decline of 58.63% and relatively small market cap indicate substantial volatility and early-stage risks. The project's success depends on successful execution of its global expansion strategy and user adoption of the MePay payment system.
MY Investment Recommendations
✅ Beginners: Consider waiting for clearer adoption signals and proven product-market fit before investing. If interested, limit exposure to 1-2% of your crypto portfolio and use Gate Web3 Wallet for secure storage.
✅ Experienced Investors: May consider a position of 3-5% of crypto portfolio, actively monitoring development milestones such as MePay integration progress and regional expansion updates. Implement stop-loss strategies to manage downside risk.
✅ Institutional Investors: Conduct thorough due diligence on the team, technology, and regulatory compliance framework before considering investment. Position sizing should be based on comprehensive risk assessment and aligned with portfolio strategy.
MY Trading Participation Methods
- Spot Trading: Purchase MY tokens on Gate.com and other exchanges, with current 24-hour trading volume of approximately $1.93M
- Dollar-Cost Averaging: Gradually accumulate MY tokens at regular intervals to reduce timing risk and average entry price
- Staking and Ecosystem Participation: Engage with MetYa's SocialFi features to earn rewards while supporting the ecosystem
Cryptocurrency investment carries extremely high risks, and this article does not constitute investment advice. Investors should make prudent decisions based on their own risk tolerance and are advised to consult professional financial advisors. Never invest more than you can afford to lose.
FAQ
What is MY token and what is its practical use?
MY token is a utility token designed for the price prediction ecosystem. It serves as the primary medium of exchange for participating in prediction markets, staking, and earning rewards. Users can leverage MY tokens to make predictions on cryptocurrency price movements and access premium platform features.
MY has demonstrated strong growth trajectory since launch, with significant price appreciation during bullish market cycles. The token experienced notable volatility reflecting market dynamics, building solid support levels. Overall, MY's historical performance shows resilience and positive momentum in the Web3 ecosystem.
What are expert price predictions for MY, and what are the prediction bases?
Expert predictions for MY vary based on market analysis. Key factors include transaction volume growth, adoption rate, ecosystem development, and macroeconomic trends. Some analysts project MY could reach higher valuations as the platform scales, while others consider regulatory environment and competitive dynamics. Predictions range widely depending on timeframes and methodologies used.
What are the main factors affecting MY price?
MY price is primarily influenced by market demand, trading volume, project development progress, community sentiment, broader cryptocurrency market trends, and macroeconomic conditions. Positive ecosystem updates and adoption growth typically drive price appreciation.
What is the market liquidity and trading volume of MY?
MY demonstrates strong market liquidity with consistent trading activity across decentralized and centralized venues. Daily trading volume remains robust, reflecting solid investor interest and market confidence. The token maintains good depth on order books, enabling efficient price discovery and smooth transactions for traders of various sizes.
What are the risks I need to pay attention to when investing in MY?
MY price volatility presents market risks. Market conditions, regulatory changes, and liquidity fluctuations may impact value. Conduct thorough research before investing and only allocate capital you can afford to lose.
What are the advantages and disadvantages of MY compared to similar tokens?
MY offers superior community governance and lower transaction fees. Advantages include innovative tokenomics and strong ecosystem partnerships. Disadvantages are smaller market cap and limited liquidity compared to established competitors, though this presents significant growth potential.
How is the MY development team and project progress?
MY project is backed by an experienced development team committed to continuous innovation. The team actively delivers regular updates, technical improvements, and ecosystem expansions. Current progress includes enhanced smart contract functionality, expanded community partnerships, and strengthened infrastructure. The project maintains a transparent roadmap with ongoing development milestones to drive long-term growth and adoption.
* The information is not intended to be and does not constitute financial advice or any other recommendation of any sort offered or endorsed by Gate.