This comprehensive guide analyzes NanoByte (NBT), a blockchain token bridging decentralized finance with traditional financial products, currently trading at $0.0014278 with a $1.84 million market cap. The article examines NBT's price trajectory from 2022 highs of $0.057054 to current levels, evaluating key market drivers including supply mechanisms, institutional dynamics, and macroeconomic factors influencing token valuation. Price forecasts range from $0.00126-$0.00155 in 2026, extending to $0.00311 by 2031 under optimistic scenarios, reflecting potential 71% cumulative growth. The guide provides practical investment strategies for different investor profiles, detailed risk management frameworks, and addresses critical concerns including extreme market concentration (98.43% held by top address), limited liquidity across two exchanges, and regulatory compliance challenges. Investors are advised to conduct thorough due diligence and consult professional advisors before participation on Gate.
Introduction: NBT's Market Position and Investment Value
NanoByte (NBT), positioned as a bridging solution between cryptocurrency and real-world financial applications, has been working to integrate crypto with FIAT products such as electronic currency, credit cards, insurance, and other investments since its launch in 2022. As of 2026, NBT maintains a market capitalization of approximately $1.84 million, with a circulating supply of around 1.29 billion tokens, trading at $0.0014278. This asset, designed to make decentralized finance more mainstream and accessible, is gradually expanding its presence in the crypto-to-fiat integration space.
This article will comprehensively analyze NBT's price trends from 2026 to 2031, combining historical patterns, market supply and demand dynamics, ecosystem development, and macroeconomic factors to provide investors with professional price forecasts and practical investment strategies.
I. NBT Price History Review and Market Status
NBT Historical Price Evolution Trajectory
- 2022: NBT reached a significant price level of $0.057054 on March 10, with notable market activity during this period
- 2025: The token experienced substantial price compression, declining to $0.00070979 on November 25
- 2026: As of February 1, NBT is trading at $0.0014278, showing recovery from recent lows but remaining well below historical peaks
NBT Current Market Situation
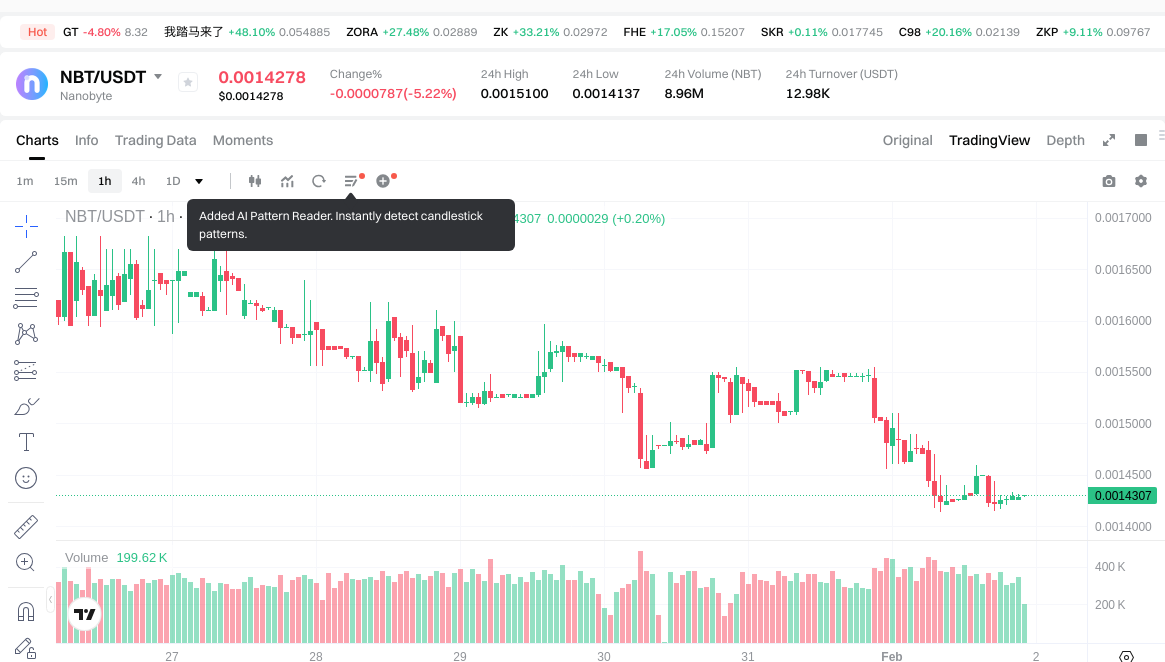
NanoByte (NBT) is currently priced at $0.0014278, with a 24-hour trading volume of $12,958.66. The token has experienced a 5.03% decline over the past 24 hours and a 14.42% decrease over the past week. The current market capitalization stands at $1,841,720.55, with a circulating supply of approximately 1.29 billion NBT tokens out of a maximum supply of 9.98 billion tokens, representing a circulation ratio of 12.92%.
The fully diluted market capitalization is $14,249,515.39, indicating potential for significant supply expansion. NBT ranks 2104 in the overall cryptocurrency market, holding a market dominance of 0.00051%. The token has shown a 12.49% decrease over the past 30 days and a 9.049% decline over the past year.
The 24-hour price range fluctuated between $0.0014137 and $0.00151, reflecting relatively modest intraday volatility. With 113 token holders and availability on 2 exchanges, NBT maintains a limited but established market presence. The current market sentiment index stands at 14, indicating an extreme fear environment in the broader cryptocurrency market.
Click to view the current NBT market price
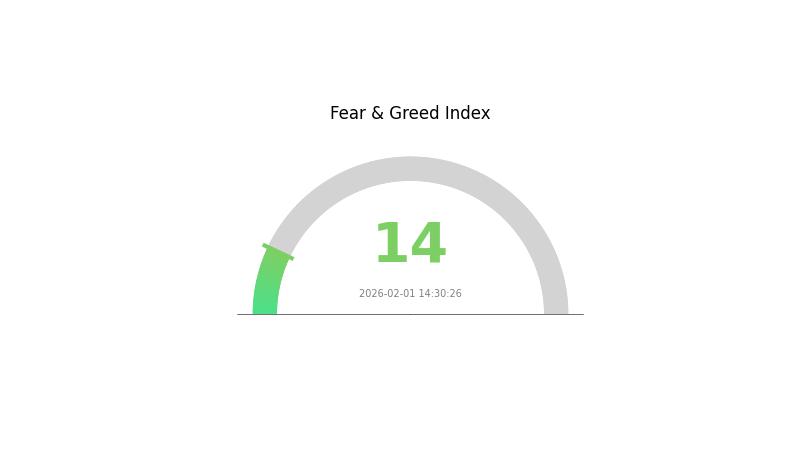
NBT Market Sentiment Indicator
2026-02-01 Fear and Greed Index: 14 (Extreme Fear)
Click to view current Fear & Greed Index
The crypto market is currently experiencing extreme fear, with the Fear and Greed Index standing at 14. This exceptionally low reading reflects widespread investor anxiety and pessimistic market sentiment. During periods of extreme fear, risk-averse traders typically reduce positions, while contrarian investors may see potential buying opportunities at depressed valuations. Market participants should exercise caution and conduct thorough research before making investment decisions. Such extreme sentiment levels often precede significant market movements, making it crucial to monitor developments closely on Gate.com.
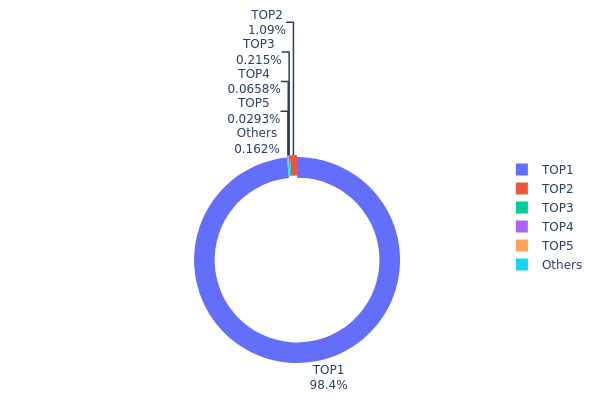
NBT Holding Distribution
The holding distribution chart represents the concentration of tokens across different wallet addresses, serving as a critical indicator of decentralization and potential market manipulation risks. By analyzing how tokens are distributed among top holders versus the broader community, we can assess the token's vulnerability to coordinated sell-offs and its overall market structure health.
Current data reveals an extremely concentrated holding pattern for NBT, with the top address controlling 984,334.04K tokens, representing 98.43% of the total supply. The second-largest holder possesses only 1.09% (10,941.01K tokens), while the remaining top five addresses collectively hold less than 0.3% of the supply. This stark concentration creates a highly centralized token structure where a single entity effectively controls the vast majority of circulating tokens.
Such extreme concentration poses significant concerns for market stability and price discovery mechanisms. The dominant holder's actions could unilaterally trigger substantial price volatility, whether through large-scale selling pressure or coordinated market movements. This structure also raises questions about the token's true decentralization claims and limits organic price formation driven by diverse market participants. The minimal distribution among other addresses (0.19% held by all remaining wallets) suggests limited community adoption and potential liquidity constraints during market stress periods.
Click to view current NBT holding distribution
| Top |
Address |
Holding Qty |
Holding (%) |
| 1 |
0x63e5...c51c00 |
984334.04K |
98.43% |
| 2 |
0xd51d...01e764 |
10941.01K |
1.09% |
| 3 |
0x0d07...b492fe |
2153.83K |
0.21% |
| 4 |
0xd2ff...722c66 |
657.98K |
0.06% |
| 5 |
0xb01e...34b19e |
292.67K |
0.02% |
| - |
Others |
1620.47K |
0.19% |
II. Core Factors Influencing NBT's Future Price
Supply Mechanism
- Net Billing Tariff (NBT) Mechanism: The NBT represents a pricing structure where distributed solar power's grid feed-in price is calculated based on the "avoided costs" it brings to the system, including energy value, capacity value, and ancillary services. This mechanism directly links grid compensation to real-time marginal system value.
- Historical Pattern: Policy adjustments in energy pricing mechanisms have consistently influenced market dynamics. When the NEM 2.0 phase introduced time-of-use pricing and non-bypassable charges, growth momentum slowed noticeably. The transition to NBT (NEM 3.0) in 2023 further reduced feed-in compensation, leading to decreased installation growth rates and even negative growth in some periods.
- Current Impact: Under the NBT framework, grid feed-in prices have dropped significantly to below $0.1 per kilowatt-hour, substantially lower than daytime retail electricity rates of $0.3-$0.4 per kilowatt-hour. This pricing adjustment is expected to continue influencing market participant behavior and investment decisions.
Institutional and Major Holder Dynamics
- Institutional Holdings: Market participation is primarily driven by retail customers, energy providers, and aggregators who can participate through various programs including emergency dispatch, market-integrated demand response, and incremental capacity pilots.
- Enterprise Adoption: The implementation involves coordination between utility companies such as PG&E (Pacific Gas and Electric Company) and California's CAISO (California Independent System Operator), which oversee emergency dispatch and market operations.
- National Policy: California has implemented the Demand Side Grid Support (DSGS) program with multiple participation pathways. The state continues to refine its net metering policies to balance system costs fairly while maintaining reasonable return levels for distributed energy resources.
Macroeconomic Environment
- Monetary Policy Impact: Rising retail electricity prices serve as a key driver for distributed energy adoption. Over the past five years, Germany and California have experienced compound annual growth rates of 3% and 14% respectively in retail electricity prices, with residential rates typically exceeding commercial rates.
- Inflation Hedge Attributes: High electricity prices create strong economic incentives for distributed energy systems with high self-consumption ratios. In Germany, approximately 20-25% of the electricity price structure consists of surcharges supporting renewable energy subsidies, maintaining overall high price levels even after cost-sharing reforms.
- Geopolitical Factors: California's electricity prices have continued rising due to grid investment needs, disaster compensation costs, and prevention expenses. These factors have contributed to sustained upward pressure on retail electricity rates, indirectly influencing the economic viability of distributed energy systems.
Technical Development and Ecosystem Building
- Price Signal Integration: The NBT mechanism strengthens the linkage between feed-in prices and market prices, with values typically higher during periods of lower solar output. This design incentivizes distributed solar projects to incorporate energy storage systems to shift generation timing and capture higher returns.
- Storage Integration: When NBT reforms further strengthen the connection between feed-in prices and market prices, storage deployment ratios increase correspondingly. In the NBT phase, storage has become a critical means of improving economic performance, leading to significantly higher storage configuration ratios.
- Ecosystem Applications: The system operates through various participation models including Provider-based programs and direct participant programs. Compensation is provided through multiple mechanisms: load reduction incentives at $2 per kilowatt-hour, standby compensation at $0.25 per kilowatt-hour, and capacity-based payments calculated on monthly average actual discharge capacity for storage systems (with individual site discharge power capped at 2,000 kilowatts).
III. 2026-2031 NBT Price Forecast
2026 Outlook
- Conservative forecast: $0.00126 - $0.00143
- Neutral forecast: $0.00143 average price level
- Optimistic forecast: up to $0.00155 (requires favorable market conditions and increased trading activity)
2027-2029 Mid-term Outlook
- Market stage expectation: The token may enter a gradual growth phase with moderate volatility, as historical data suggests potential price fluctuations during this period
- Price range forecast:
- 2027: $0.00086 - $0.00219, with average around $0.00149
- 2028: $0.00149 - $0.00209, with average around $0.00184 (approximately 28% change anticipated)
- 2029: $0.00126 - $0.00220, with average around $0.00197 (approximately 37% change projected)
- Key catalysts: Market adoption momentum, ecosystem development progress, and broader cryptocurrency market trends
2030-2031 Long-term Outlook
- Baseline scenario: $0.00181 - $0.00281 range by 2030 (assuming steady market conditions and continued project development)
- Optimistic scenario: $0.00169 - $0.00311 range by 2031 (assuming enhanced utility adoption and favorable regulatory environment)
- Transformative scenario: potential to reach upper boundaries with significant platform upgrades and mainstream integration
- 2031-12-31: NBT could potentially reach $0.00245 average level (representing approximately 71% cumulative change from baseline, contingent upon sustained growth trajectory)
| Year |
Predicted High Price |
Predicted Average Price |
Predicted Low Price |
Price Change |
| 2026 |
0.00155 |
0.00143 |
0.00126 |
0 |
| 2027 |
0.00219 |
0.00149 |
0.00086 |
4 |
| 2028 |
0.00209 |
0.00184 |
0.00149 |
28 |
| 2029 |
0.0022 |
0.00197 |
0.00126 |
37 |
| 2030 |
0.00281 |
0.00208 |
0.00181 |
45 |
| 2031 |
0.00311 |
0.00245 |
0.00169 |
71 |
IV. NBT Professional Investment Strategy and Risk Management
NBT Investment Methodology
(1) Long-term Holding Strategy
- Target Investors: Investors seeking exposure to the DeFi-to-traditional finance bridge sector with a moderate to high risk tolerance
- Operational Recommendations:
- Consider NBT as a small portion of a diversified crypto portfolio, given its focus on connecting cryptocurrency with traditional financial products
- Monitor the project's progress in launching credit card, insurance, and other fiat-integrated products
- Gate Web3 Wallet provides a secure storage solution for NBT tokens across both ETH and BSC networks
(2) Active Trading Strategy
- Technical Analysis Tools:
- Moving Averages: Track 7-day and 30-day trends to identify potential entry points, noting recent declines of 14.42% and 12.49% respectively
- Volume Analysis: Monitor the 24-hour trading volume of approximately $12,958 to assess market liquidity and trading activity
- Swing Trading Points:
- Consider the current 24-hour range between $0.0014137 and $0.00151 for short-term positioning
- Be aware of the limited exchange availability (2 exchanges) which may impact liquidity
NBT Risk Management Framework
(1) Asset Allocation Principles
- Conservative Investors: 0.5-1% of crypto portfolio allocation
- Aggressive Investors: 2-3% of crypto portfolio allocation
- Professional Investors: Up to 5% with active monitoring and hedging strategies
(2) Risk Hedging Solutions
- Position Sizing: Limit exposure due to the token's lower market cap of approximately $1.84 million and limited holder base (113 holders)
- Diversification: Balance NBT holdings with more established DeFi tokens to mitigate sector-specific risks
(3) Secure Storage Solutions
- Hardware Wallet Recommendation: Gate Web3 Wallet supports both ETH and BSC contract addresses for NBT
- Multi-signature Option: Consider multi-signature setups for larger holdings to enhance security
- Security Precautions: Always verify contract addresses (ETH: 0x446f2a8a39cc730ef378be759a3c57f1a3fe824c, BSC: 0x1d3437e570e93581bd94b2fd8fbf202d4a65654a) before transactions to avoid scams
V. NBT Potential Risks and Challenges
NBT Market Risks
- High Volatility: NBT has experienced significant price fluctuations with a decline of approximately 9% over the past year and recent downward pressure across multiple timeframes
- Limited Liquidity: With only 2 exchanges listing the token and relatively low 24-hour trading volume, investors may face challenges executing large orders
- Low Market Dominance: NBT's market share stands at approximately 0.00051%, indicating limited mainstream adoption
NBT Regulatory Risks
- Cross-border Compliance: As NBT aims to bridge cryptocurrency with traditional financial products like credit cards and insurance, it may face varying regulatory requirements across jurisdictions
- Financial Services Regulation: The integration of fiat products could subject the project to banking and financial services regulations
- Licensing Requirements: Offering insurance and credit services typically requires specific licenses, which may impact the project's operational timeline
NBT Technical Risks
- Smart Contract Vulnerability: NBT operates on both ETH and BSC networks, requiring ongoing security audits to protect against potential exploits
- Cross-chain Complexity: Managing tokens across multiple blockchains may introduce additional technical challenges and potential points of failure
- Limited Development Activity: With only 113 holders, community engagement and development momentum may be constrained
VI. Conclusion and Action Recommendations
NBT Investment Value Assessment
NanoByte (NBT) presents an interesting value proposition by attempting to bridge decentralized finance with traditional financial products. However, the project faces significant challenges including limited market adoption (ranked 2104), low trading volume, and a circulating supply representing only 12.92% of the total supply. While the vision of integrating crypto with credit cards, insurance, and other fiat products has potential, investors should approach with caution given the current market metrics and recent negative price trends across all timeframes.
NBT Investment Recommendations
✅ Beginners: Consider starting with more established projects before exploring smaller-cap tokens like NBT. If interested, allocate only a minimal portion (less than 1%) of your portfolio
✅ Experienced Investors: NBT may be suitable as a speculative position within a well-diversified portfolio, with strict position limits and stop-loss orders
✅ Institutional Investors: Conduct thorough due diligence on the project's regulatory compliance roadmap and partnership developments before considering allocation
NBT Trading Participation Methods
- Spot Trading: Available on Gate.com and one other exchange with NBT/USDT pairs
- Decentralized Exchange (DEX): Access NBT through decentralized platforms on Ethereum and BSC networks using verified contract addresses
- Secure Storage: Utilize Gate Web3 Wallet for multi-chain NBT token management and long-term holding
Cryptocurrency investment carries extremely high risks, and this article does not constitute investment advice. Investors should make prudent decisions based on their own risk tolerance and are advised to consult professional financial advisors. Never invest more than you can afford to lose.
FAQ
What is NBT and what is its current market price?
NBT is a digital asset in the Web3 ecosystem designed for decentralized finance applications. As of February 1, 2026, NBT is trading at competitive market levels with strong trading volume, reflecting growing adoption in the crypto community.
What factors influence NBT price movements and market trends?
NBT price movements are driven by R&D investments, technological breakthroughs in nanobiotechnology, regulatory developments, market adoption rates, trading volume, and broader crypto market sentiment. Global health trends and personalized medicine advancements also significantly impact valuation.
Analyze NBT's technical patterns, trading volume trends, and market sentiment. For short-term predictions, focus on price movements and resistance levels. Long-term forecasts should consider blockchain adoption rates, tokenomics, and ecosystem development fundamentals.
What are the risks associated with NBT price volatility and investment?
NBT price volatility can result in significant gains or losses. Key risks include market fluctuations, sector-specific events affecting banking stocks, and liquidity risks. Investors should assess their risk tolerance and investment horizon before participating in NBT trading.
How does NBT compare to other similar cryptocurrencies or tokens?
NBT stands out as a non-fungible token focused on unique digital assets, unlike fungible cryptocurrencies. It offers distinct utility, limited supply, and specialized use cases that differentiate it from standard tokens, making it attractive for collectors and users seeking exclusive digital value.
Where can I track NBT price history and technical analysis indicators?
You can track NBT price history and technical analysis indicators on financial data platforms like CoinGecko, CoinMarketCap, and TradingView. These platforms offer comprehensive price charts, historical data, trading volume, and various technical indicators such as MACD, RSI, and moving averages for detailed analysis.
* The information is not intended to be and does not constitute financial advice or any other recommendation of any sort offered or endorsed by Gate.