This comprehensive analysis examines NIZA's market position and investment outlook from 2026 to 2031. Currently trading at $0.0566 with an $8.5 million market cap, NIZA faces significant concentration risk with top holders controlling 88% of supply. The article evaluates price drivers including supply dynamics, market sentiment, ecosystem development, and macroeconomic conditions. Price forecasts range from conservative scenarios ($0.046-$0.057) to optimistic outlooks ($0.09-$0.12 by 2031). Professional investment strategies encompass long-term holding, staking opportunities, and active trading approaches, complemented by robust risk management frameworks. Key challenges include high volatility, regulatory uncertainties, and smart contract vulnerabilities. Suitable for investors of all levels seeking diversified exposure through Gate exchange, with emphasis on dollar-cost averaging and secure storage solutions.
Introduction: NIZA's Market Position and Investment Value
Niza Global (NIZA), as a digital asset designed to power a secure, transparent, and user-friendly ecosystem, has been working to establish its presence in the crypto market since its launch in September 2025. As of January 2026, NIZA maintains a market capitalization of approximately $8.5 million, with a circulating supply of 150 million tokens and a current price hovering around $0.0566. This asset, positioned as a utility token for seamless trading, staking, and platform participation, is gradually expanding its role within the Niza Global ecosystem.
This article will comprehensively analyze NIZA's price trends from 2026 to 2031, combining historical patterns, market supply-demand dynamics, ecosystem development, and macroeconomic conditions to provide investors with professional price forecasts and practical investment strategies.
I. NIZA Price History Review and Current Market Status
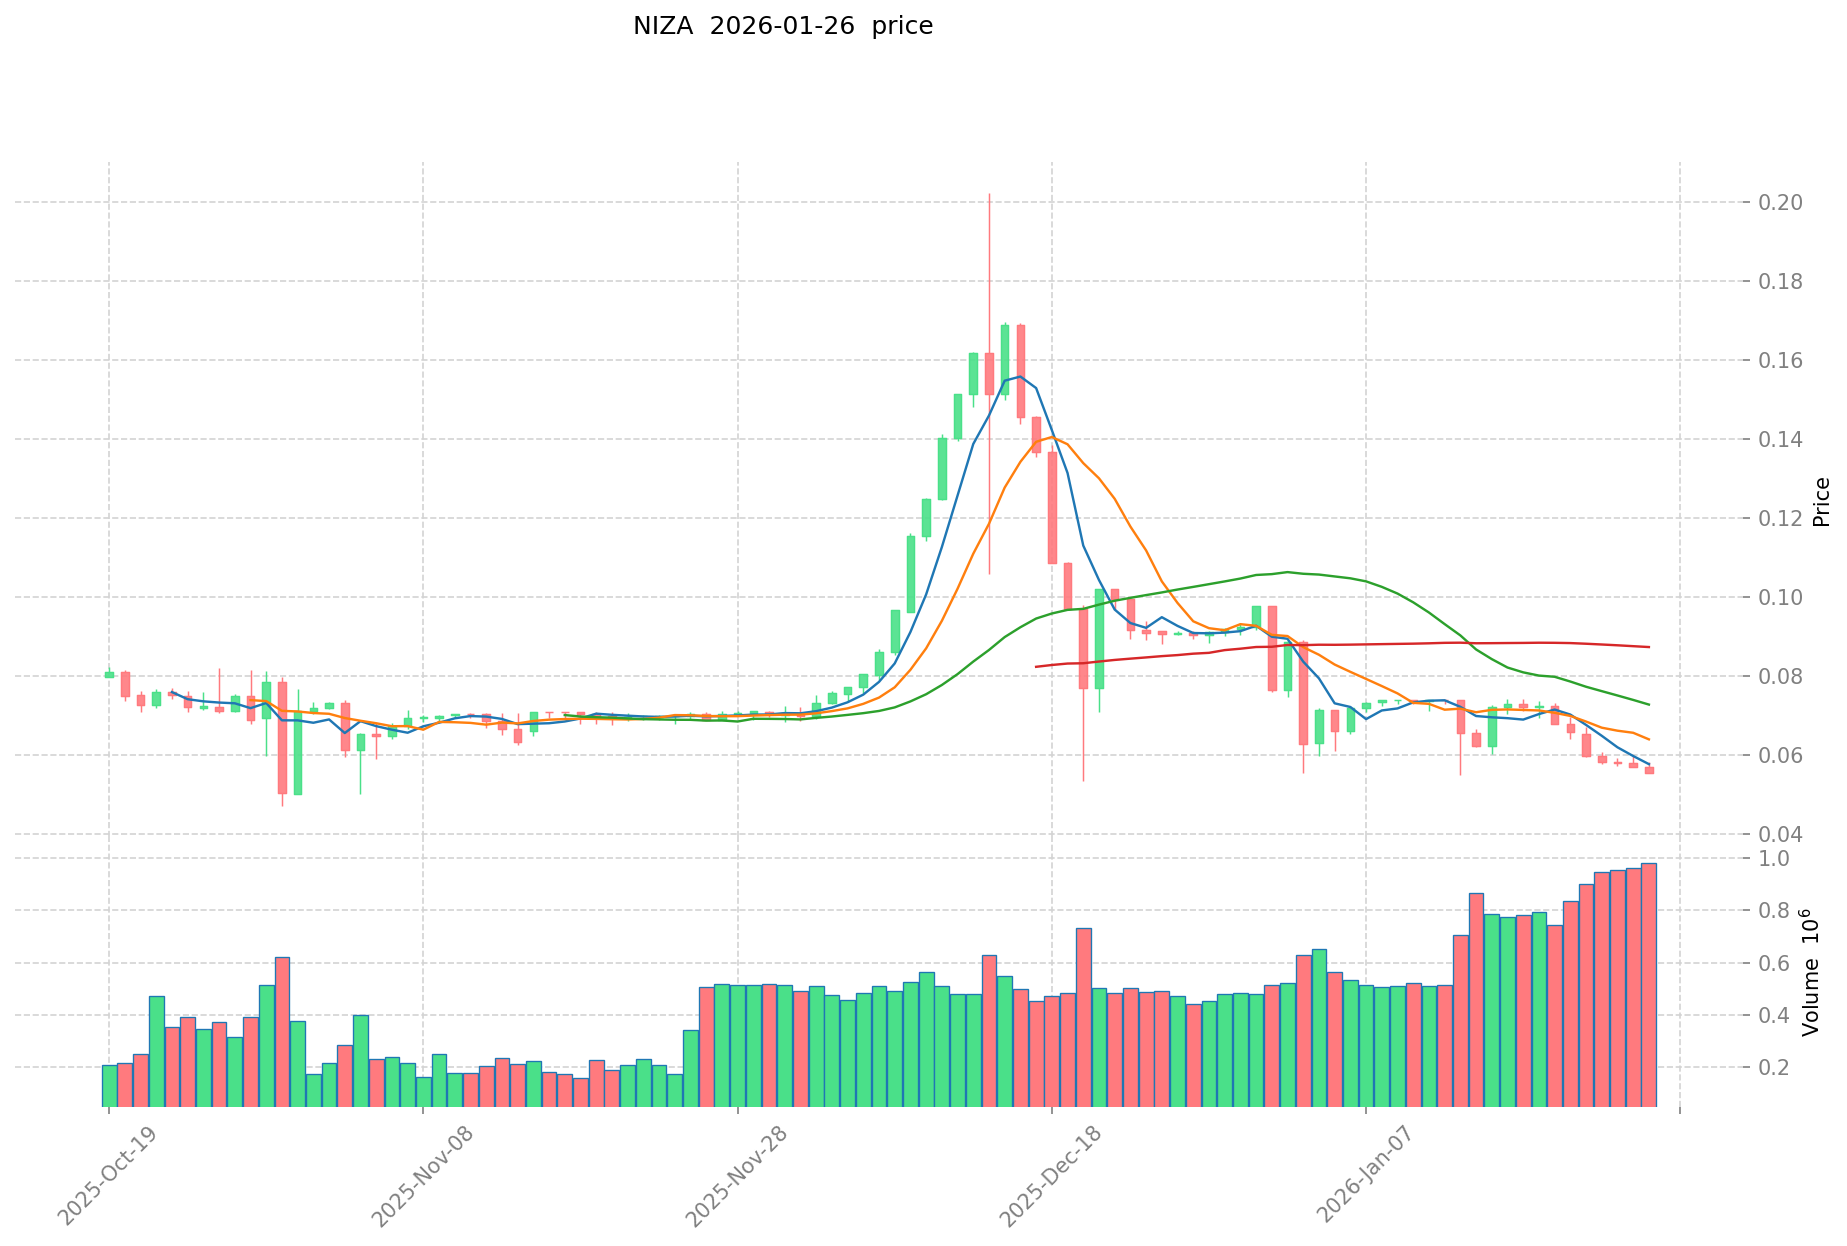
NIZA Historical Price Evolution Trajectory
- September 2025: NIZA reached its all-time high of $0.366666 and all-time low of $0.001 during its initial trading period, demonstrating high volatility in its early stage
- 2025-2026: The token experienced a significant decline of 86.72% from its historical peak, with the price adjusting from approximately $0.426 to current levels
- Recent 30 days: NIZA underwent a 37.04% correction, decreasing by approximately $0.033 from previous monthly levels
NIZA Current Market Status
As of January 27, 2026, NIZA is trading at $0.056644, with a 24-hour trading volume of $54,550.17. The token shows a modest 1.95% increase over the past 24 hours, with an intraday high of $0.057215 and low of $0.055001.
The current market capitalization stands at $8.50 million, with a fully diluted valuation matching the market cap at $8.50 million, indicating 100% of tokens are in circulation. The total and circulating supply both equal 150 million NIZA tokens, representing complete token distribution. The project maintains a market dominance of 0.00027% within the broader cryptocurrency ecosystem.
NIZA is currently ranked #1,284 in the cryptocurrency market and is listed on 4 exchanges. The token has attracted 3,341 holders since its launch. Short-term momentum shows a 1.16% gain over the past hour, while the 7-day performance reflects an 18.45% decline, indicating recent market pressure.
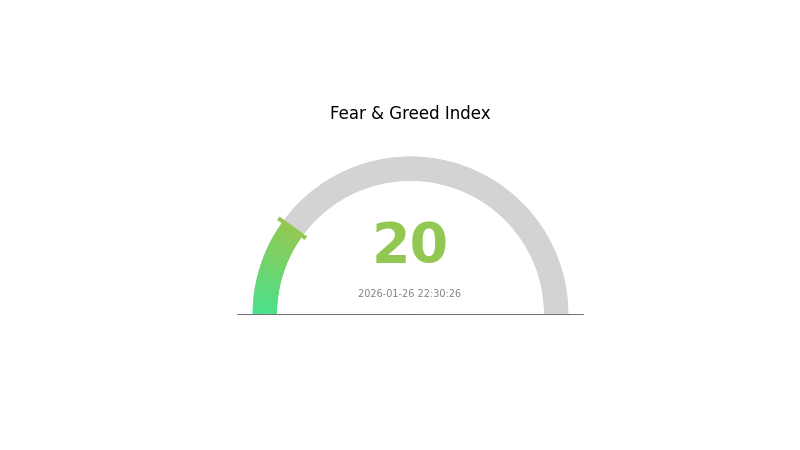
The cryptocurrency fear and greed index currently stands at 20, signaling "Extreme Fear" in the broader market sentiment, which may be influencing NIZA's recent price movements alongside other digital assets.
Click to view the current NIZA market price
NIZA Market Sentiment Index
2026-01-26 Fear and Greed Index: 20 (Extreme Fear)
Click to view the current Fear & Greed Index
The cryptocurrency market is experiencing extreme fear with an index reading of 20. This low score indicates heightened market anxiety and pessimistic sentiment among investors. During periods of extreme fear, market participants often exhibit cautious behavior, leading to potential selling pressure and price volatility. However, historically, such extreme readings have sometimes presented contrarian buying opportunities for long-term investors. Traders should remain vigilant, monitor market developments closely, and maintain disciplined risk management strategies. Understanding the fear and greed dynamics can help inform more informed investment decisions in the current volatile market environment.
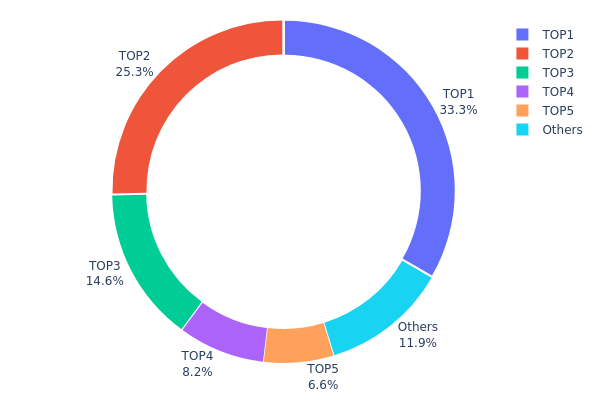
NIZA Holdings Distribution
The holdings distribution chart illustrates the concentration of token ownership across different wallet addresses, serving as a critical metric for assessing decentralization levels and potential market manipulation risks. By examining the percentage of total supply held by top addresses, analysts can gauge the degree of whale control and evaluate the token's structural stability on-chain.
According to the current data, NIZA exhibits significant concentration in its holdings structure. The top five addresses collectively control approximately 88.06% of the total token supply, with the leading address alone holding 33.33% (50,000K tokens). The second-largest holder possesses 25.29% (37,935.29K tokens), while the remaining top three addresses account for 14.64%, 8.20%, and 6.60% respectively. Only 11.94% of the supply is distributed among other addresses, indicating a highly centralized ownership pattern.
This concentration level presents notable implications for market dynamics. The dominant position of top holders creates elevated vulnerability to price manipulation, as large-scale sell-offs by any major holder could trigger substantial volatility. The limited distribution among smaller addresses suggests restricted retail participation and potential liquidity constraints during high-volume trading periods. Such structural characteristics typically correlate with increased price sensitivity to whale activities and reduced resilience against coordinated market actions. From a decentralization perspective, this distribution pattern reflects a relatively nascent stage of token circulation, where broader community adoption and diversified ownership remain developing aspects of the project's on-chain ecosystem.
Click to view current NIZA Holdings Distribution
| Top |
Address |
Holding Qty |
Holding (%) |
| 1 |
0xc200...0dfb68 |
50000.00K |
33.33% |
| 2 |
0x472e...65d989 |
37935.29K |
25.29% |
| 3 |
0x377c...69be0f |
21960.00K |
14.64% |
| 4 |
0x8ff9...6944a5 |
12302.67K |
8.20% |
| 5 |
0x211d...dc2203 |
9906.00K |
6.60% |
| - |
Others |
17896.04K |
11.94% |
II. Core Factors Influencing NIZA's Future Price
Supply Mechanism
-
Market Demand and Trading Volume: NIZA's price trajectory is closely tied to trading activity levels and investor participation. Higher trading volumes typically indicate increased market interest, which can drive short-term price momentum. Conversely, periods of lower liquidity may contribute to price consolidation or decline.
-
Historical Patterns: According to available data, NIZA demonstrated significant volatility during its initial listing period, with reported first-day gains reaching substantial levels. Such early-stage price movements often reflect initial market discovery phases rather than sustainable long-term trends.
-
Current Implications: In the near term, NIZA's price may continue to exhibit fluctuation within a certain range as the market seeks equilibrium. Trading volume and liquidity conditions will remain key determinants of short-term price action.
Institutional and Large Holder Activity
-
Institutional Positioning: Specific data regarding institutional holdings of NIZA was not available in the reference materials. Institutional participation, when present, can provide market depth and stability, though its absence does not necessarily indicate lack of potential.
-
Enterprise Adoption: Information regarding corporate adoption of NIZA was not found in the provided materials. Broader industry trends show that enterprise engagement with digital assets often correlates with increased legitimacy and utility, though this varies significantly by project.
-
Regulatory Environment: The reference materials did not contain specific policy statements regarding NIZA at the national level. Generally, the regulatory landscape for digital assets continues to evolve globally, with policy developments potentially affecting market sentiment and adoption trajectories.
Macroeconomic Environment
-
Monetary Policy Impact: While specific projections were not detailed in the materials, central bank policies regarding interest rates and monetary conditions historically influence risk asset valuations, including digital currencies. Shifts in monetary stance can affect capital flows into or out of cryptocurrency markets.
-
Inflation Dynamics: The materials did not provide direct analysis of NIZA's characteristics as an inflation hedge. Generally, certain digital assets have been viewed by some market participants as potential stores of value during inflationary periods, though performance varies.
-
Geopolitical Considerations: Broader economic factors and international developments can influence cryptocurrency markets through changes in investor risk appetite. However, specific geopolitical impacts on NIZA were not detailed in the available information.
Technical Development and Ecosystem Building
-
Project Development Milestones: The achievement of technical roadmap objectives and developmental progress can influence market perception and investor confidence. Reference materials indicated that project development milestones represent a factor in price expectations, though specific upcoming milestones for NIZA were not elaborated.
-
Application Ecosystem: Information regarding decentralized applications or ecosystem projects specifically associated with NIZA was not available in the provided materials. The development of practical use cases and applications can contribute to long-term value creation in digital asset projects.
-
Network Effects: While not specifically detailed for NIZA, broader cryptocurrency market dynamics suggest that user adoption, network growth, and ecosystem development can create positive feedback loops that support value appreciation over time.
III. 2026-2031 NIZA Price Prediction
2026 Outlook
- Conservative forecast: $0.04618 - $0.05702
- Neutral forecast: $0.05702 (average price scenario)
- Optimistic forecast: $0.07241 (contingent on favorable market conditions and increased adoption)
2027-2029 Outlook
- Market stage expectation: NIZA may enter a gradual growth phase with strengthening fundamentals and expanding ecosystem development
- Price range forecast:
- 2027: $0.03948 - $0.07442, with an anticipated 14% price change from 2026 baseline
- 2028: $0.04383 - $0.08279, projecting a 22% cumulative increase
- 2029: $0.04418 - $0.08151, estimated 34% growth trajectory
- Key catalysts: Technological improvements, broader market acceptance, strategic partnerships, and potential integration with emerging blockchain applications
2030-2031 Long-term Outlook
- Baseline scenario: $0.06702 - $0.10881 by 2030 (assuming steady ecosystem development and market maturity)
- Optimistic scenario: $0.06192 - $0.11728 by 2031 (predicated on accelerated adoption and positive regulatory environment)
- Transformative scenario: Prices reaching upper ranges contingent on breakthrough technological developments or major institutional adoption
- 2031-01-27: NIZA could potentially achieve an average price of $0.09382, representing approximately 65% growth from 2026 levels (subject to market dynamics and project execution)
| Year |
Predicted High Price |
Predicted Average Price |
Predicted Low Price |
Price Change |
| 2026 |
0.07241 |
0.05702 |
0.04618 |
0 |
| 2027 |
0.07442 |
0.06472 |
0.03948 |
14 |
| 2028 |
0.08279 |
0.06957 |
0.04383 |
22 |
| 2029 |
0.08151 |
0.07618 |
0.04418 |
34 |
| 2030 |
0.10881 |
0.07884 |
0.06702 |
39 |
| 2031 |
0.11728 |
0.09382 |
0.06192 |
65 |
IV. NIZA Professional Investment Strategy and Risk Management
NIZA Investment Methodology
(1) Long-term Holding Strategy
- Suitable for: Retail and institutional investors seeking exposure to a secure, transparent digital ecosystem with staking utility
- Operational Recommendations:
- Consider accumulating NIZA during market corrections, given the current price is approximately 84.55% below its all-time high of $0.366666
- Monitor staking opportunities on the Niza Global platform to generate passive income while holding
- Implement a secure storage solution using Gate Web3 Wallet for BSC-based assets, ensuring private key protection and regular backup procedures
(2) Active Trading Strategy
- Technical Analysis Tools:
- Moving Averages: Use 20-day and 50-day moving averages to identify trend direction; current 7-day decline of 18.45% suggests short-term bearish momentum
- Volume Analysis: Monitor the 24-hour trading volume of $54,550 relative to market cap to assess liquidity conditions and potential breakout signals
- Swing Trading Points:
- Entry consideration near recent 24-hour low of $0.055001, with stop-loss placed below key support levels
- Take-profit targets could be set near 24-hour high of $0.057215 or psychological resistance levels, adjusting for volatility
NIZA Risk Management Framework
(1) Asset Allocation Principles
- Conservative Investors: 1-3% of crypto portfolio allocation
- Aggressive Investors: 5-10% of crypto portfolio allocation
- Professional Investors: Up to 15% with active hedging strategies
(2) Risk Hedging Solutions
- Diversification Strategy: Balance NIZA holdings with established cryptocurrencies and stablecoins to reduce concentration risk
- Position Sizing: Utilize dollar-cost averaging to mitigate the impact of short-term price volatility, particularly given the 30-day decline of 37.04%
(3) Secure Storage Solutions
- Software Wallet Recommendation: Gate Web3 Wallet for convenient access to BSC-based NIZA tokens with multi-layer security features
- Cold Storage Solution: For larger holdings, consider transferring NIZA to hardware wallets after initial accumulation
- Security Precautions: Enable two-factor authentication, verify contract address (0x3065930e06307eecf872304299ce9be2a2f6bce0) before transactions, and avoid sharing private keys or seed phrases
V. NIZA Potential Risks and Challenges
NIZA Market Risks
- High Volatility: The token has experienced an 86.72% decline over the past year, indicating significant price fluctuation potential that may result in substantial losses
- Limited Market Depth: With a 24-hour trading volume of approximately $54,550 and market cap of $8.50 million, liquidity constraints may impact large order execution
- Concentration Risk: With only 3,341 holders and listing on 4 exchanges, the token faces concentration risk that could affect price stability
NIZA Regulatory Risks
- Evolving Compliance Landscape: As regulatory frameworks for digital assets continue to develop globally, NIZA may face compliance challenges that could impact its accessibility or trading status
- Cross-border Trading Restrictions: Potential limitations on token trading or usage in certain jurisdictions may reduce market reach and adoption
- Exchange Listing Uncertainty: Changes in exchange policies or regulatory requirements could affect NIZA's trading availability on current platforms
NIZA Technical Risks
- Smart Contract Vulnerabilities: As a BSC BEP-20 token, NIZA is subject to potential smart contract bugs or exploits that could compromise user funds
- Platform Dependency: The token's utility is closely tied to the Niza Global platform; technical issues or delays in platform development may impact token value proposition
- Network Congestion: During periods of high BSC network activity, transaction costs and confirmation times may increase, affecting user experience
VI. Conclusion and Action Recommendations
NIZA Investment Value Assessment
NIZA Global presents a digital asset focused on creating a secure, transparent ecosystem with utility across trading, staking, and platform participation. While the token benefits from BSC infrastructure and aims to serve both retail and institutional users, investors should carefully weigh the long-term value proposition against current market challenges. The significant price decline of 86.72% year-over-year and 37.04% over 30 days reflects considerable short-term headwinds, though the 100% circulating supply and defined maximum supply of 150 million tokens provide transparency on token economics.
NIZA Investment Recommendations
✅ Beginners: Start with minimal allocation (1-2% of crypto portfolio) and utilize dollar-cost averaging to build positions gradually while learning about the Niza Global ecosystem
✅ Experienced Investors: Consider tactical positions with strict risk management, monitoring staking opportunities and platform developments while maintaining diversified exposure
✅ Institutional Investors: Conduct thorough due diligence on Niza Global's roadmap and partnerships, considering pilot allocations with appropriate hedging strategies and compliance review
NIZA Trading Participation Methods
- Spot Trading: Purchase NIZA through Gate.com and other supported exchanges, ensuring verification of contract address before transactions
- Staking Programs: Explore staking opportunities on the Niza Global platform to generate passive returns while supporting ecosystem security
- Secure Storage: Transfer tokens to Gate Web3 Wallet for self-custody management with enhanced security features
Cryptocurrency investment carries extremely high risks. This article does not constitute investment advice. Investors should make prudent decisions based on their own risk tolerance and are advised to consult professional financial advisors. Never invest more than you can afford to lose.
FAQ
What is NIZA? What are its practical applications and value?
NIZA is a digital asset powering the Niza Global ecosystem, enabling seamless transactions, staking, and participation. It provides transparent infrastructure with real utility for users seeking secure, decentralized financial solutions.
What are the main factors affecting NIZA price?
NIZA price is primarily driven by supply and demand dynamics. Market sentiment, trading volume, investor behavior, and overall cryptocurrency market trends significantly influence its price movements. Regulatory developments and adoption rates also play important roles in price fluctuation.
NIZA reached an all-time high of $0.200762 and an all-time low of $0.00005705. As of January 26, 2026, the price ranges between $0.060237 and $0.08909, demonstrating significant volatility and growth potential in its market journey.
How to make long-term price predictions for NIZA?
NIZA long-term price predictions are based on market trends and historical data analysis. For 2026, average prices are projected between $0.000019 and $0.000037. Current market conditions and trading volume significantly influence these forecasts.
What risks should I be aware of when investing in NIZA?
NIZA investment carries market volatility and price uncertainty risks. Cryptocurrency markets fluctuate rapidly, requiring careful consideration. Future trends are unpredictable, so assess your risk tolerance independently before investing.
What are the advantages or disadvantages of NIZA compared to other mainstream cryptocurrencies?
NIZA offers high transaction speed and low fees, making it more efficient than traditional payments. However, it has lower transaction volume and lower adoption rates compared to mainstream cryptocurrencies like Bitcoin and Ethereum.
* The information is not intended to be and does not constitute financial advice or any other recommendation of any sort offered or endorsed by Gate.