This comprehensive guide provides expert analysis of Nosana (NOS) token price trends and investment opportunities from 2026 to 2031. The article examines NOS's market position, currently trading at $0.2674 with a $22.3 million market cap, alongside detailed price forecasts and technical analysis. Covering historical performance, core market drivers, and ecosystem development, the analysis projects NOS could reach $0.482 by 2031 under baseline scenarios. The guide offers practical investment strategies including long-term holding and active trading approaches, complemented by comprehensive risk management frameworks. Whether you're a beginner or experienced investor, discover actionable insights on NOS trading on Gate, technical indicators, secure wallet solutions, and crucial risk considerations for navigating this volatile digital asset.
Introduction: NOS Market Position and Investment Value
Nosana (NOS), as a decentralized CPU-based computing platform revolutionizing DevOps solutions, has been developing since its launch in 2022. As of 2026, NOS holds a market capitalization of approximately $22.3 million, with a circulating supply of around 83.4 million tokens, and its price maintains at approximately $0.2674. This asset, which democratizes CPU cloud computing by connecting blockchain developers and services to a global computing power pool, is playing an increasingly vital role in decentralized infrastructure and CI/CD solutions.
This article will comprehensively analyze NOS price trends from 2026 to 2031, combining historical patterns, market supply and demand dynamics, ecosystem development, and macroeconomic conditions to provide investors with professional price forecasts and practical investment strategies.
I. NOS Price History Review and Market Status
NOS Historical Price Evolution Trajectory
- 2022: Token launched in January with an initial offering price of $0.03, marking the project's entry into the cryptocurrency market
- 2023: Price experienced significant volatility, reaching a historical low of $0.01046656 in October, reflecting broader market challenges
- 2024: Notable recovery occurred with price climbing to a historical high of $7.83 in March, demonstrating strong market interest
- 2025-2026: Price underwent substantial correction from peak levels, experiencing a decline of approximately 90.03% over the year
NOS Current Market Status
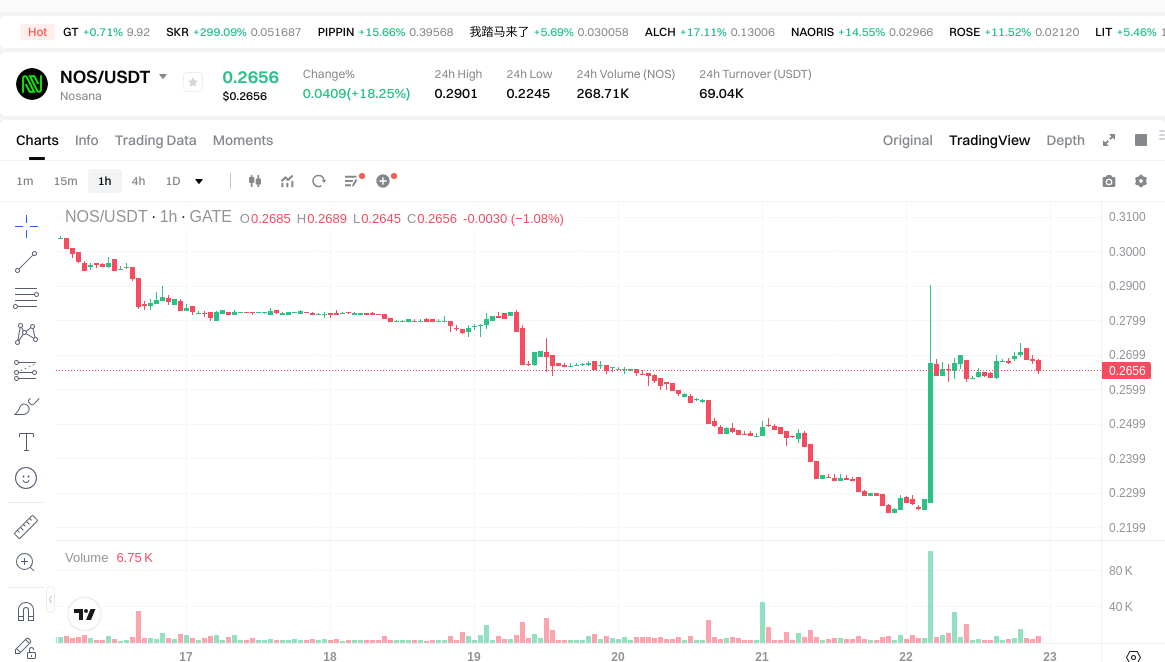
As of January 22, 2026, NOS is trading at $0.2674, representing a 19.59% increase over the past 24 hours. The token has shown mixed performance across different timeframes, with a 27.24% gain over the past 30 days, while facing a 12.59% decline over the past week.
The current market capitalization stands at approximately $22.30 million, with NOS ranking 830th among cryptocurrencies. The token maintains a market share of 0.00084%, with 83.4 million tokens in circulation, representing 83.4% of the total supply of 100 million tokens. The fully diluted market capitalization reaches $26.74 million.
Within the last 24 hours, NOS has traded between a low of $0.2245 and a high of $0.2901, with total trading volume reaching $67,778.35. The token is currently listed on 8 exchanges and has attracted 47,419 holders. The ratio between market capitalization and fully diluted valuation stands at 83.4%, indicating a relatively high proportion of tokens already in circulation.
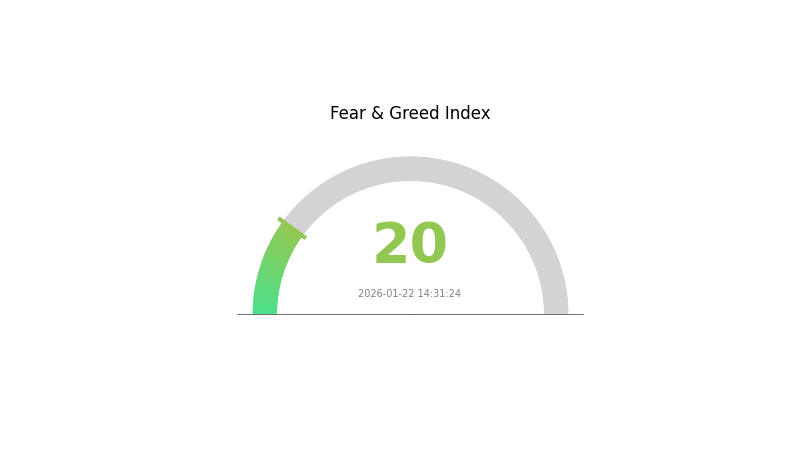
The broader cryptocurrency market sentiment index registers at 20, indicating extreme fear among market participants, which may influence NOS price movements in the near term.
Click to view current NOS market price
NOS Market Sentiment Index
2026-01-22 Fear and Greed Index: 20 (Extreme Fear)
Click to view the current Fear & Greed Index
The NOS market is experiencing extreme fear conditions today. With the fear and greed index at 20, investor sentiment has reached a critical low point, indicating widespread pessimism and risk aversion across the market. During such periods, panic selling often dominates trading activity. However, historically, extreme fear has presented contrarian opportunities for value-oriented investors. Those considering long-term positions may want to closely monitor market developments, while risk-sensitive traders should exercise caution. Market conditions remain highly volatile and unpredictable.
NOS Holding Distribution
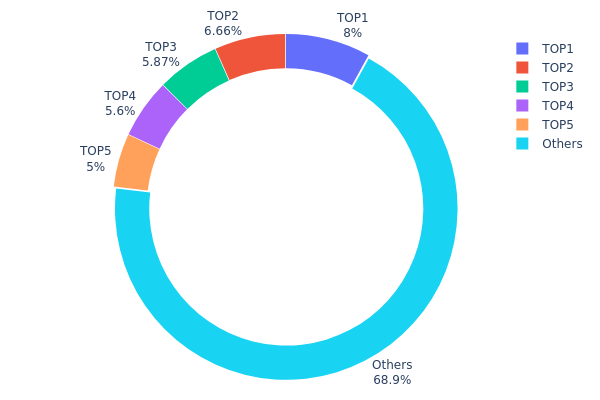
The holding distribution chart reveals the concentration of token ownership among wallet addresses, serving as a crucial indicator of decentralization and potential market manipulation risks. Based on the current data, NOS exhibits a relatively balanced distribution pattern with the top 5 addresses collectively holding approximately 31.12% of the total supply, while the remaining 68.88% is dispersed among other addresses.
Analyzing the specific concentration levels, the largest holder controls 8.00% (8M NOS), followed by addresses holding 6.65%, 5.87%, 5.60%, and 5.00% respectively. This distribution demonstrates moderate concentration without extreme dominance by any single entity. Unlike projects where a single address controls over 20-30% of the supply, NOS maintains a more democratic structure that reduces the risk of unilateral price manipulation or sudden sell-off events that could destabilize the market.
From a market structure perspective, this holding pattern suggests healthy on-chain stability. The absence of whale dominance indicates that no individual holder possesses sufficient power to manipulate market prices arbitrarily. However, the combined influence of the top 5 holders still warrants attention during volatile market conditions, as coordinated actions could still impact short-term price movements. The substantial 68.88% held by others indicates broad community participation, which typically correlates with stronger price support levels and more organic trading activity. This decentralized characteristic enhances NOS's resilience against concentrated selling pressure while fostering a more mature and sustainable market ecosystem.
Click to view the current NOS Holding Distribution
| Top |
Address |
Holding Qty |
Holding (%) |
| 1 |
nosTxp...g28g54 |
8000.00K |
8.00% |
| 2 |
9u39MP...wPpZAr |
6657.90K |
6.65% |
| 3 |
nosMFV...bqpmjG |
5871.95K |
5.87% |
| 4 |
nosL7e...qkWa8h |
5600.00K |
5.60% |
| 5 |
nosCcR...TLmvXd |
5000.00K |
5.00% |
| - |
Others |
68869.96K |
68.88% |
II. Core Factors Affecting NOS Future Price
Based on the available information, there is insufficient data to provide a comprehensive analysis of the core factors affecting NOS future price. The provided materials do not contain specific information about NOS's supply mechanisms, institutional dynamics, macroeconomic positioning, or technical development roadmap.
To conduct a meaningful price analysis, we would need access to:
- Token supply structure and distribution mechanisms
- Historical price correlations with supply changes
- Institutional adoption and holding patterns
- Technical upgrade schedules and ecosystem development
- Macro-economic positioning and market correlations
Without verified data from reliable sources, any analysis would be speculative and potentially misleading. Readers interested in NOS should conduct their own research using official project channels and verified market data sources.
III. 2026-2031 NOS Price Forecast
2026 Outlook
- Conservative estimate: $0.138-$0.266
- Neutral estimate: $0.266
- Optimistic estimate: $0.369 (contingent on favorable market conditions)
Based on the forecast data, NOS is expected to establish a baseline trading range in 2026, with the average price hovering around $0.266. The projected price corridor suggests moderate volatility, with the lower boundary at approximately $0.138 and potential peaks reaching $0.369.
2027-2029 Mid-term Outlook
- Market stage expectation: Gradual appreciation phase with progressive value accumulation
- Price range forecasts:
- 2027: $0.175-$0.416 (18% year-over-year growth)
- 2028: $0.209-$0.418 (37% cumulative growth from 2026)
- 2029: $0.329-$0.428 (46% cumulative growth from 2026)
- Key catalysts: Sustained adoption trends, technological developments, and broader market recovery cycles may contribute to the projected upward trajectory
The mid-term forecast indicates a steadily ascending price path, with average prices rising from $0.317 in 2027 to $0.392 in 2029. The narrowing spread between high and low estimates in later years suggests potential market maturation and reduced volatility.
2030-2031 Long-term Outlook
- Baseline scenario: $0.365-$0.553 (assuming continued ecosystem development)
- Optimistic scenario: $0.443-$0.679 (assuming accelerated adoption and favorable regulatory environment)
- Transformative scenario: Potential breakthrough above $0.679 (contingent on significant technological breakthroughs or widespread institutional adoption)
The long-term projections suggest NOS could experience substantial appreciation, with 2030 forecasts indicating a 53% cumulative increase from the 2026 baseline, and 2031 potentially delivering an 80% gain. The 2031 average price target of $0.482 represents nearly double the 2026 baseline, though investors should note that such projections remain subject to numerous market variables and ecosystem developments.
Traders interested in NOS can monitor real-time price movements and execute trades on Gate.com, which offers comprehensive trading tools and liquidity for digital asset transactions.
| Year |
Predicted High Price |
Predicted Average Price |
Predicted Low Price |
Price Change |
| 2026 |
0.36918 |
0.2656 |
0.13811 |
0 |
| 2027 |
0.41578 |
0.31739 |
0.17457 |
18 |
| 2028 |
0.41791 |
0.36659 |
0.20896 |
37 |
| 2029 |
0.42755 |
0.39225 |
0.32949 |
46 |
| 2030 |
0.55337 |
0.4099 |
0.36481 |
53 |
| 2031 |
0.6791 |
0.48163 |
0.4431 |
80 |
IV. NOS Professional Investment Strategy and Risk Management
NOS Investment Methodology
(1) Long-term Holding Strategy
- Target Investors: Blockchain technology believers and decentralized computing enthusiasts who recognize the long-term value of CPU sharing economy
- Operational Recommendations:
- Consider accumulating positions during market corrections when NOS trades significantly below its historical high of $7.83
- Monitor project development milestones, particularly expansion of the Nosana Network's CI/CD infrastructure services
- Implement a secure storage solution using Gate Web3 Wallet for self-custody of NOS tokens
(2) Active Trading Strategy
- Technical Analysis Tools:
- Support and Resistance Levels: Monitor the 24-hour trading range ($0.2245 - $0.2901) to identify potential entry and exit points
- Volume Analysis: Track the daily trading volume of $67,778 to assess market liquidity and trading activity
- Swing Trading Key Points:
- Consider the token's high volatility, as evidenced by a 19.59% increase in 24 hours and 27.24% gain over 30 days
- Be aware of the -12.59% decline over 7 days, indicating potential short-term consolidation patterns
NOS Risk Management Framework
(1) Asset Allocation Principles
- Conservative Investors: 1-3% of crypto portfolio allocation
- Aggressive Investors: 5-8% of crypto portfolio allocation
- Professional Investors: May consider up to 10% allocation with active risk monitoring
(2) Risk Hedging Solutions
- Position Sizing: Implement dollar-cost averaging to mitigate entry timing risk
- Stop-Loss Orders: Consider setting protective stops 15-20% below entry points given the token's volatility
(3) Secure Storage Solutions
- Hot Wallet Recommendation: Gate Web3 Wallet for convenient trading and staking access
- Cold Storage Solution: Hardware wallet options for long-term holdings exceeding short-term trading needs
- Security Precautions: Enable two-factor authentication, maintain secure backup of recovery phrases, and never share private keys
V. NOS Potential Risks and Challenges
NOS Market Risks
- Extreme Volatility: The token has experienced a -90.03% decline over one year, demonstrating significant price instability
- Limited Liquidity: With a 24-hour trading volume of $67,778 and market capitalization of $22.3 million, the token may face liquidity constraints during large transactions
- Market Cap Ranking: Currently ranked #830 with 0.00084% market dominance, indicating relatively small market presence compared to major cryptocurrencies
NOS Regulatory Risks
- Decentralized Computing Regulations: Evolving regulatory frameworks for decentralized infrastructure services may impact the project's operations
- Token Classification: Potential regulatory scrutiny regarding the classification and use of NOS tokens within the network
- Cross-border Compliance: As a global computing network, Nosana may face varying regulatory requirements across different jurisdictions
NOS Technical Risks
- Network Competition: The decentralized computing market faces competition from established cloud providers and other blockchain-based solutions
- Adoption Challenges: Success depends on attracting sufficient CPU providers and developers to create a sustainable ecosystem
- Smart Contract Security: Potential vulnerabilities in the underlying smart contracts could pose risks to token holders and network participants
VI. Conclusion and Action Recommendations
NOS Investment Value Assessment
Nosana presents an innovative approach to democratizing cloud computing through decentralized CPU sharing on the Solana blockchain. With 83.4% of total supply in circulation (83.4 million tokens) and 47,419 holders, the project demonstrates community engagement. However, the significant decline from its all-time high of $7.83 (recorded on March 7, 2024) to the current price of $0.2674 reflects substantial market challenges. The recent 30-day performance showing 27.24% growth suggests potential recovery momentum, though the 7-day decline of -12.59% indicates ongoing volatility. Long-term value depends on the project's ability to expand its CI/CD infrastructure services and attract developers seeking alternatives to centralized cloud providers.
NOS Investment Recommendations
✅ Beginners: Start with minimal exposure (1-2% of crypto portfolio) and focus on understanding the decentralized computing model before increasing positions
✅ Experienced Investors: Consider strategic accumulation during market dips while maintaining strict position sizing and stop-loss disciplines given the token's volatility
✅ Institutional Investors: Conduct thorough due diligence on the project's technical roadmap and competitive positioning before committing capital, considering the relatively small market cap and limited liquidity
NOS Trading Participation Methods
- Spot Trading: Purchase NOS tokens on Gate.com with support for multiple trading pairs and competitive liquidity
- Storage Options: Utilize Gate Web3 Wallet for secure self-custody while maintaining easy access to trading opportunities
- Market Monitoring: Track the token's performance across 8 supporting exchanges and monitor on-chain activities through Solana Explorer
Cryptocurrency investment carries extremely high risks, and this article does not constitute investment advice. Investors should make prudent decisions based on their own risk tolerance and are advised to consult professional financial advisors. Never invest more than you can afford to lose.
FAQ
What is NOS and what is its use case in the blockchain ecosystem?
NOS is a blockchain-based operating system token designed to enable decentralized computing and data management. Its primary use case involves facilitating secure, efficient interactions within distributed networks, supporting smart contract execution, and enabling users to participate in a decentralized ecosystem where computational resources are tokenized and traded seamlessly across the blockchain.
What factors should I consider when predicting NOS token price?
Consider market capitalization, trading volume, developer activity, tokenomics, blockchain ecosystem adoption, macroeconomic trends, regulatory developments, and competitive positioning within the cryptocurrency market landscape.
NOS has demonstrated significant volatility in the crypto market. Historically, the token experienced price fluctuations reflecting market dynamics and adoption trends. Market capitalization has varied based on token price and circulating supply. Current metrics reflect ongoing development and community engagement within the NOS ecosystem.
What are the main risks and volatility factors that could affect NOS price prediction?
NOS price volatility stems from market sentiment shifts, trading volume fluctuations, regulatory developments, and broader crypto market trends. Technology updates, competition, and macroeconomic factors also significantly influence price movements and prediction accuracy.
How does NOS compare to other similar tokens in terms of technology and adoption?
NOS offers advanced blockchain infrastructure with efficient consensus mechanisms and growing developer ecosystem. Its adoption rate surpasses many competitors through strategic partnerships, enhanced scalability, and superior transaction throughput. Strong community support positions NOS ahead in technological innovation and real-world utility applications.
What is the current trading volume and liquidity of NOS on major exchanges?
NOS maintains robust trading volume and liquidity across leading platforms. Daily trading activity remains substantial, reflecting strong market interest. Liquidity pools ensure efficient price discovery and minimal slippage for traders at various volume levels.
* The information is not intended to be and does not constitute financial advice or any other recommendation of any sort offered or endorsed by Gate.