This comprehensive analysis examines Nosana (NOS), a decentralized CPU-based DevOps platform, through expert price prediction and market outlook spanning 2026-2031. Currently trading at $0.2543 with a $21.21 million market cap, NOS demonstrates significant growth potential amid extreme market fear. The article evaluates historical price evolution from launch to present, analyzes current market sentiment and token distribution, and provides tiered price forecasts ranging from conservative to optimistic scenarios. Beyond predictions, professional investment strategies—including long-term holding and active trading approaches—are detailed alongside comprehensive risk management frameworks. Critical examination of market, regulatory, and technical risks helps investors understand challenges facing this early-stage decentralized computing platform. Suitable for investors seeking speculative opportunities in blockchain infrastructure with proper risk awareness and portfolio allocation discipline through Gate exchan
Introduction: NOS Market Position and Investment Value
Nosana (NOS), positioned as a decentralized CPU-based DevOps solution provider, has been revolutionizing the development process for metaverse projects since its launch in 2022. As of 2026, Nosana has achieved a market capitalization of approximately $21.21 million, with a circulating supply of about 83.4 million tokens, and the price maintains around $0.2543. This asset, recognized as a "democratized CPU cloud computing platform," is playing an increasingly significant role in connecting blockchain developers to a global computing power pool.
This article will comprehensively analyze NOS price trends from 2026 to 2031, combining historical patterns, market supply and demand dynamics, ecosystem development, and macroeconomic environment to provide investors with professional price forecasts and practical investment strategies.
I. NOS Price History Review and Market Status
NOS Historical Price Evolution Trajectory
- 2022: Nosana launched in January with an initial offering price of $0.03, marking the project's entry into the market
- 2023: The token experienced significant volatility, reaching its historical low of $0.01046656 on October 24, representing a substantial decline from launch levels
- 2024: NOS achieved its all-time high of $7.83 on March 7, demonstrating exceptional growth momentum during this period. However, the price subsequently underwent correction throughout the remainder of the year
NOS Current Market Status
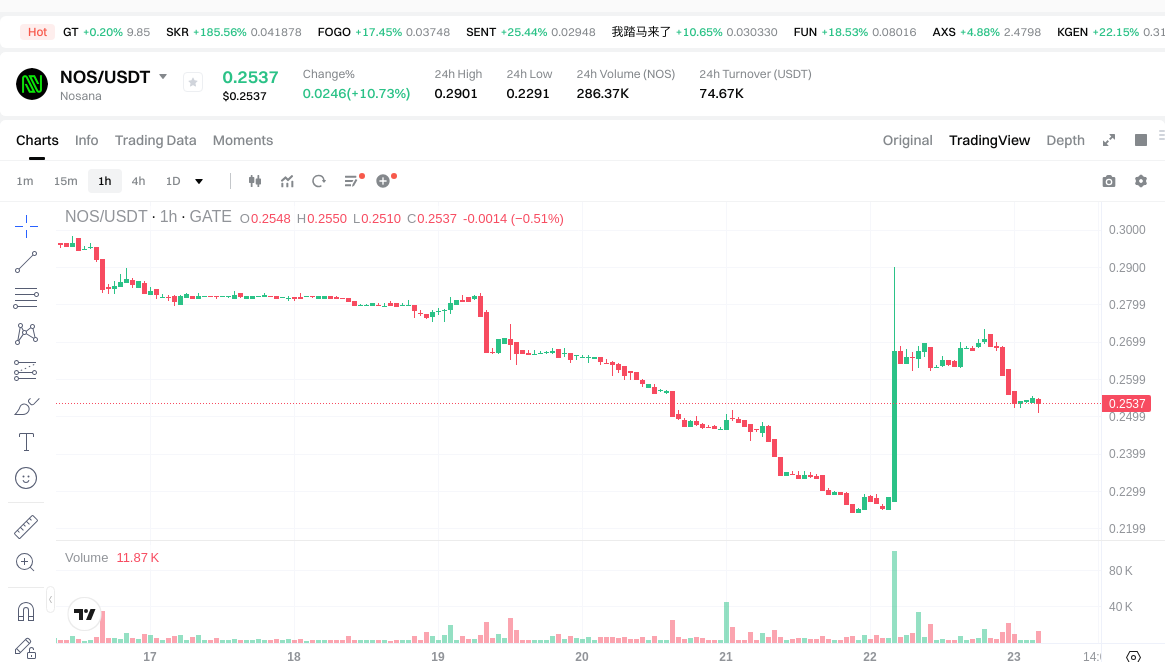
As of January 23, 2026, NOS is trading at $0.2543, showing an 11.12% increase over the past 24 hours. The token has experienced notable short-term fluctuations, with the 24-hour trading range spanning from $0.2283 to $0.2901.
From a broader perspective, NOS displays mixed performance across different timeframes. While the token has gained 21.33% over the past 30 days, it has declined 16.55% over the past week. The annual performance shows a significant retreat, with the price down 90.59% compared to one year ago.
The project's market capitalization stands at approximately $21.21 million, with a fully diluted market cap of $25.43 million. The circulating supply represents 83.4% of the total supply, with 83.4 million NOS tokens currently in circulation out of a total supply of 100 million. The 24-hour trading volume reached $75,466.85.
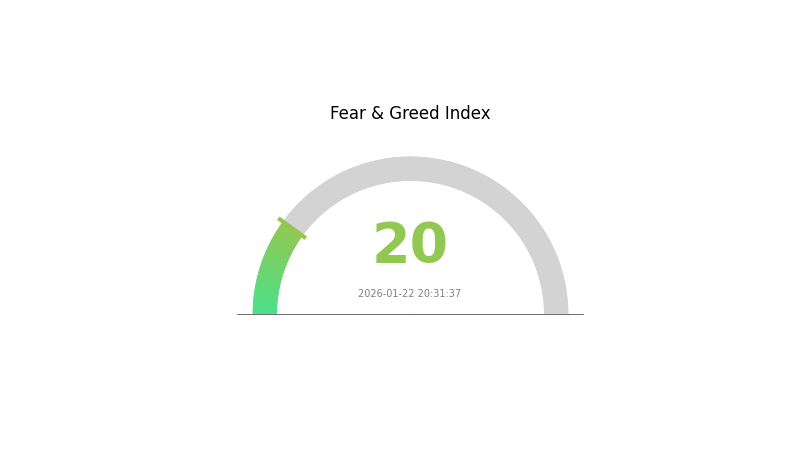
NOS maintains a market share of 0.00080% within the broader cryptocurrency market and ranks at position 849. The token is held by 47,419 addresses and is available for trading on 8 exchanges. Current market sentiment indicators reflect an extreme fear environment, with the volatility index registering at 20.
Click to view current NOS market price
NOS Market Sentiment Index
2026-01-22 Fear and Greed Index: 20 (Extreme Fear)
Click to view current Fear & Greed Index
The crypto market is currently experiencing extreme fear, with the Fear and Greed Index dropping to 20. This significant decline reflects heightened investor anxiety and risk aversion across the market. When the index reaches such low levels, it typically indicates widespread pessimism and potential capitulation among traders. However, historically, periods of extreme fear have often presented contrarian opportunities for long-term investors. Market participants should exercise caution while remaining alert to potential buying opportunities during such intense fear episodes.
NOS Holdings Distribution
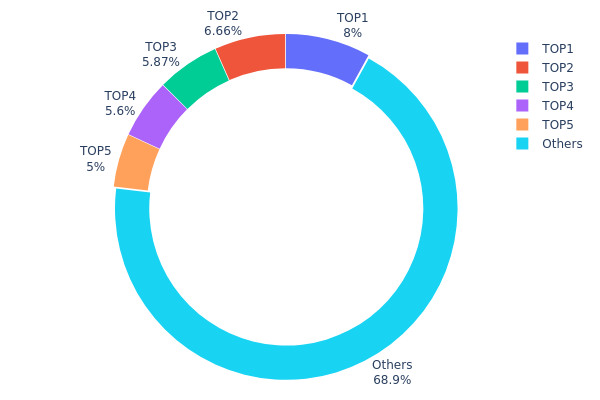
The holdings distribution chart illustrates the allocation of NOS tokens across different wallet addresses, providing insights into the concentration of token ownership within the ecosystem. This metric serves as a critical indicator of decentralization levels and potential market manipulation risks. By analyzing the proportion of tokens held by top addresses versus the broader holder base, investors can assess the health and stability of the token's distribution structure.
According to the current data, the top five addresses collectively hold 31.12% of the total NOS supply, with the largest single address controlling 8.00% (8,000K tokens). The second and third largest holders possess 6.65% (6,657.90K tokens) and 5.87% (5,871.95K tokens) respectively. The remaining 68.88% of tokens are distributed among other addresses, indicating a relatively balanced distribution pattern. This concentration level falls within a moderate range—neither excessively centralized nor completely fragmented—suggesting a healthier market structure compared to projects where a handful of addresses control the majority of supply.
The current distribution structure reveals both strengths and potential concerns for NOS market dynamics. On the positive side, the fact that no single entity holds more than 10% of the supply reduces the risk of unilateral market manipulation and demonstrates a reasonable degree of decentralization. However, the combined holdings of the top five addresses exceeding 31% indicates that coordinated actions among major holders could still exert significant influence on price movements and liquidity conditions. This moderate concentration level typically correlates with reduced volatility compared to highly concentrated tokens, while still maintaining sufficient liquidity depth for normal trading activities. The substantial 68.88% held by smaller addresses suggests a broad community base, which generally contributes to long-term ecosystem stability and organic growth potential.
Click to view current NOS Holdings Distribution
| Top |
Address |
Holding Qty |
Holding (%) |
| 1 |
nosTxp...g28g54 |
8000.00K |
8.00% |
| 2 |
9u39MP...wPpZAr |
6657.90K |
6.65% |
| 3 |
nosMFV...bqpmjG |
5871.95K |
5.87% |
| 4 |
nosL7e...qkWa8h |
5600.00K |
5.60% |
| 5 |
nosCcR...TLmvXd |
5000.00K |
5.00% |
| - |
Others |
68869.96K |
68.88% |
II. Core Factors Influencing NOS Future Price
Based on the available information, there is currently insufficient data to conduct a comprehensive analysis of the core factors affecting NOS price movements. The provided materials do not contain specific details regarding supply mechanisms, institutional dynamics, macroeconomic correlations, or technical developments for this asset.
To make informed investment decisions regarding NOS, investors should:
- Monitor official project announcements for updates on tokenomics and supply schedules
- Track on-chain data through blockchain explorers to observe holder distribution patterns
- Follow credible cryptocurrency news sources for ecosystem developments
- Assess broader market conditions and their potential impact on digital assets
For the latest trading information and market data on NOS, users can visit Gate.com, which provides real-time price charts, order books, and trading pairs for various cryptocurrencies.
III. 2026-2031 NOS Price Forecast
2026 Outlook
- Conservative estimate: $0.19535 - $0.2537
- Neutral estimate: $0.2537
- Optimistic estimate: $0.36533 (contingent on favorable market conditions and broader adoption)
2027-2029 Mid-term Outlook
- Market stage expectation: Potential gradual growth phase with increasing volatility as the cryptocurrency market matures and NOS establishes its position
- Price range projections:
- 2027: $0.22285 - $0.40546 (approximately 21% increase from 2026 baseline)
- 2028: $0.27884 - $0.45759 (approximately 40% increase from 2026 baseline)
- 2029: $0.25675 - $0.43606 (approximately 60% increase from 2026 baseline)
- Key catalysts: Market sentiment shifts, technological developments within the NOS ecosystem, and broader cryptocurrency market trends
2030-2031 Long-term Outlook
- Baseline scenario: $0.36697 - $0.60739 (assuming steady market development and continued project advancement)
- Optimistic scenario: $0.3808 - $0.58664 in 2031 (assuming enhanced ecosystem growth and sustained market interest)
- Transformative scenario: Potential for higher valuations if NOS achieves significant adoption milestones and favorable regulatory developments emerge (approximately 102% increase from 2026 baseline by 2031)
- January 23, 2026: NOS trading dynamics remain subject to market conditions and project development progress
| Year |
Predicted High Price |
Predicted Average Price |
Predicted Low Price |
Price Change |
| 2026 |
0.36533 |
0.2537 |
0.19535 |
0 |
| 2027 |
0.40546 |
0.30951 |
0.22285 |
21 |
| 2028 |
0.45759 |
0.35749 |
0.27884 |
40 |
| 2029 |
0.43606 |
0.40754 |
0.25675 |
60 |
| 2030 |
0.60739 |
0.4218 |
0.36697 |
65 |
| 2031 |
0.58664 |
0.5146 |
0.3808 |
102 |
IV. NOS Professional Investment Strategies and Risk Management
NOS Investment Methodology
(I) Long-term Holding Strategy
- Target Investors: Investors who believe in decentralized computing infrastructure and have a long-term vision for the metaverse development ecosystem
- Operational Recommendations:
- Consider accumulating positions during market corrections, particularly when NOS trades significantly below its historical peaks
- Monitor the project's development progress in CI/CD infrastructure and computing power network expansion
- Evaluate the growth of network participants and computing capacity utilization rates
- Storage Solution: Utilize Gate Web3 Wallet for secure asset custody with multi-signature protection
(II) Active Trading Strategy
- Technical Analysis Tools:
- Moving Averages: Track 50-day and 200-day moving averages to identify trend reversals and momentum shifts
- Volume Analysis: Monitor trading volume patterns to confirm price movements and identify potential breakout or breakdown scenarios
- Swing Trading Key Points:
- Pay attention to the token's historical volatility range, noting the significant gap between ATH ($7.83) and ATL ($0.01046656)
- Consider taking profits during periods of rapid appreciation and reassessing positions during consolidation phases
NOS Risk Management Framework
(I) Asset Allocation Principles
- Conservative Investors: 1-3% of crypto portfolio allocation
- Aggressive Investors: 5-8% of crypto portfolio allocation
- Professional Investors: Up to 10% with active hedging strategies
(II) Risk Hedging Solutions
- Portfolio Diversification: Combine NOS holdings with established cryptocurrencies and stablecoins to reduce concentration risk
- Position Sizing: Use dollar-cost averaging to mitigate timing risk and reduce exposure to extreme volatility
(III) Secure Storage Solutions
- Hot Wallet Recommendation: Gate Web3 Wallet for convenient trading and staking access
- Cold Storage Solution: Hardware wallet storage for long-term holdings exceeding trading needs
- Security Precautions: Never share private keys, enable two-factor authentication, and regularly verify wallet addresses before transactions
V. NOS Potential Risks and Challenges
NOS Market Risks
- High Volatility: The token has experienced significant price fluctuations, with a 1-year decline of approximately 90.59%, indicating substantial downside risk
- Liquidity Concerns: With a 24-hour trading volume of approximately $75,466, market depth may be limited during periods of high volatility
- Market Cap Position: Ranked at #849 with a market capitalization of approximately $21.2 million, the project remains relatively small in the broader crypto ecosystem
NOS Regulatory Risks
- Decentralized Computing Regulations: Evolving regulatory frameworks for decentralized cloud computing services may impact the project's operational model
- Token Classification: Potential regulatory scrutiny regarding the classification of NOS tokens and their utility within the network
- Cross-border Compliance: As a global computing network, compliance with varying jurisdictional requirements presents ongoing challenges
NOS Technical Risks
- Network Adoption: The project's success depends on attracting sufficient computing power providers and developers to create a sustainable ecosystem
- Competition: Facing competition from established cloud computing providers and emerging decentralized computing platforms
- Technical Execution: Successful implementation of the CI/CD infrastructure and seamless integration with blockchain development workflows are critical factors
VI. Conclusion and Action Recommendations
NOS Investment Value Assessment
Nosana presents an interesting proposition in the decentralized computing space, aiming to democratize CPU cloud computing for blockchain developers and metaverse projects. The project's focus on CI/CD infrastructure addresses a genuine need in the development ecosystem. However, the token has experienced significant price decline over the past year, reflecting broader market challenges and the early-stage nature of the project. The relatively low market capitalization and trading volume suggest higher risk compared to more established cryptocurrencies. Long-term value proposition depends on successful network adoption, growing developer engagement, and the expanding metaverse ecosystem.
NOS Investment Recommendations
✅ Beginners: Approach with caution and limit exposure to a small percentage of your portfolio; focus on understanding the project fundamentals before investing
✅ Experienced Investors: Consider NOS as a speculative allocation within a diversified crypto portfolio, monitoring network growth metrics and development milestones
✅ Institutional Investors: Conduct thorough due diligence on the project's technical architecture, competitive positioning, and team execution capability before considering allocation
NOS Trading Participation Methods
- Spot Trading: Purchase NOS tokens through Gate.com with various trading pairs for immediate ownership
- Dollar-Cost Averaging: Implement systematic investment plans to reduce timing risk and average entry prices over time
- Staking Opportunities: Explore potential staking or network participation mechanisms to earn additional rewards while supporting the ecosystem
Cryptocurrency investments carry extremely high risks, and this article does not constitute investment advice. Investors should make prudent decisions based on their own risk tolerance and are advised to consult professional financial advisors. Never invest more than you can afford to lose.
FAQ
What is NOS? What are its basic functions and application scenarios?
NOS is a decentralized network protocol enabling peer-to-peer data sharing and computing resources. Its core functions include distributed storage, computation services, and network incentives. Applications span cloud computing, data management, and decentralized AI infrastructure.
What are the main factors affecting NOS price?
NOS price is primarily influenced by market demand and adoption, ecosystem development progress, trading volume, overall crypto market sentiment, Bitcoin and Ethereum price movements, protocol upgrades, and community engagement levels.
How to conduct NOS price prediction? What analysis methods are available?
NOS price prediction uses technical analysis(K-line patterns, moving averages), fundamental analysis(project developments, market adoption), and on-chain metrics(transaction volume, holder distribution). Combine historical price trends with market sentiment and ecosystem growth indicators for comprehensive forecasting.
What are the risks and limitations of NOS price prediction?
NOS price predictions face market volatility, liquidity fluctuations, and unpredictable external factors. Predictions rely on historical data which may not reflect future trends. Regulatory changes, technological developments, and macroeconomic conditions can significantly impact accuracy and outcomes.
What are the advantages or disadvantages of NOS compared to similar projects?
NOS offers superior scalability and lower transaction costs through its innovative layer-2 solution. Its community-driven governance model provides better decentralization. Key advantages include faster transaction speed and enhanced security protocols compared to mainstream competitors in the same category.
What is the historical price trend of NOS? What price levels has it reached before?
NOS has experienced significant volatility since its launch. The token reached its all-time high around $0.50 in 2024, demonstrating strong market interest. Currently trading in the $0.15-$0.25 range, NOS shows potential for recovery as adoption increases.
* The information is not intended to be and does not constitute financial advice or any other recommendation of any sort offered or endorsed by Gate.