This comprehensive NS price prediction guide analyzes SuiNS market dynamics from 2026 to 2031, offering professional forecasts for blockchain naming service investors. The article reviews NS historical performance—from its November 2024 launch at $0.09 to current $0.02831 levels—and examines core factors including supply mechanisms, institutional positioning, and macroeconomic conditions. Featuring detailed price predictions across three scenarios (conservative, neutral, optimistic), it addresses 2026-2031 trajectories while providing actionable investment strategies for diverse investor profiles. The guide emphasizes risk management frameworks, secure storage solutions via Gate, and regulatory considerations specific to decentralized naming services. Comprehensive risk analysis covers volatility, liquidity constraints, and technical dependencies, equipping investors with evidence-based decision-making tools for NS portfolio positioning.
Introduction: NS Market Position and Investment Value
SuiNS (NS), as a blockchain-based digital identity and domain name service solution, has been making strides in simplifying user interactions with blockchain technology since its launch in November 2024. As of January 29, 2026, SuiNS has achieved a market capitalization of approximately $4.40 million, with a circulating supply of around 155.30 million tokens, and its price hovers near $0.02831. This asset, recognized for its role in digital identity management, is playing an increasingly important role in enhancing privacy, security, and interoperability across various blockchain ecosystems.
This article will comprehensively analyze the price trends of SuiNS from 2026 to 2031, combining historical patterns, market supply and demand dynamics, ecosystem development, and macroeconomic conditions to provide investors with professional price forecasts and practical investment strategies.
I. NS Price History Review and Market Status
NS Historical Price Evolution Trajectory
- 2024: NS launched on Gate.com on November 13, with an initial offering price of $0.09, marking the token's entry into the cryptocurrency market.
- 2024: In November, the price experienced significant upward movement, reaching an all-time high of $1.1936 on November 14, representing a substantial increase from its launch price.
- 2025-2026: Following the peak in late 2024, the token entered a prolonged correction phase, with the price declining to an all-time low of $0.02544 on December 26, 2025, reflecting broader market adjustment pressures.
NS Current Market Position
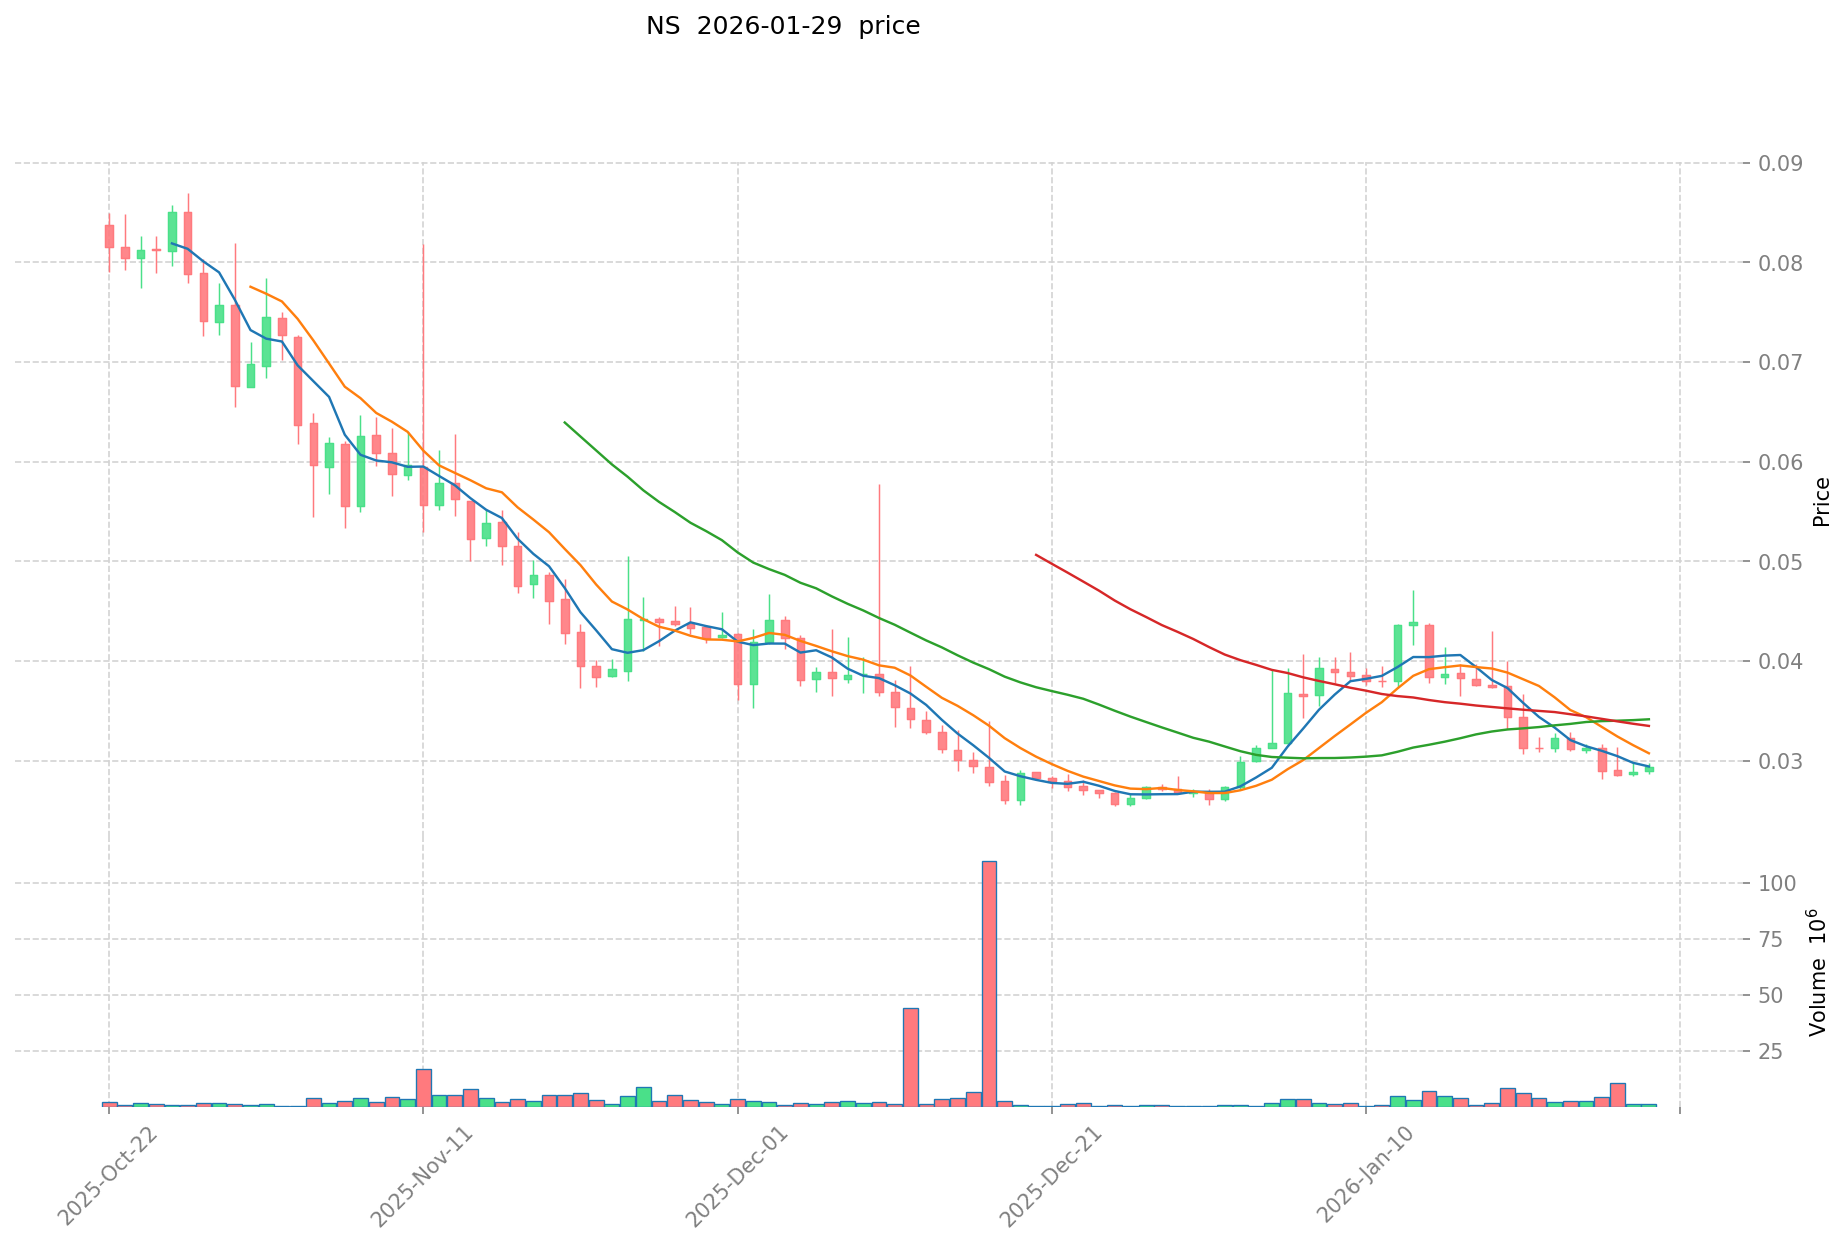
As of January 29, 2026, NS is trading at $0.02831, showing a slight recovery from its recent low point. The token has experienced mixed short-term price movements, with a 0.27% increase over the past hour, but declining 2.97% in the last 24 hours. The 24-hour trading range has been between $0.02807 and $0.02978.
Over the past week, NS has decreased by 8.66%, while the 30-day performance shows a 5.31% gain, indicating some resilience amid recent volatility. However, the one-year performance reflects an 86.69% decline from its initial trading levels.
The current circulating supply stands at 155,302,085 NS tokens, representing 31.06% of the maximum supply of 500,000,000 tokens. The token's market capitalization is approximately $4.40 million, with a fully diluted market cap of $14.16 million. The 24-hour trading volume has reached $75,694.49, demonstrating moderate trading activity.
NS ranks #1602 in the overall cryptocurrency market, holding a 0.00045% market share. The token has attracted a community of 68,340 holders across 8 exchanges, with Gate.com being a primary trading venue.
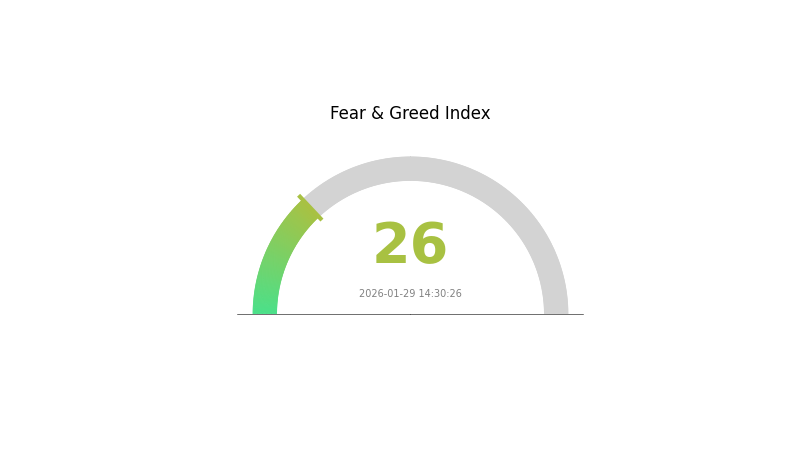
The current crypto market sentiment index stands at 26, indicating a "Fear" level, which may be influencing NS's trading patterns alongside broader market conditions.
Click to view current NS market price
NS Market Sentiment Index
2026-01-29 Fear and Greed Index: 26 (Fear)
Click to view current Fear & Greed Index
The cryptocurrency market is currently experiencing a fear sentiment with an index reading of 26. This low reading indicates heightened market anxiety and risk aversion among investors. During periods of fear, market participants tend to adopt a cautious stance, leading to potential selling pressure and increased volatility. However, such conditions often present opportunities for long-term investors to accumulate assets at lower valuations. It is advisable to monitor market developments closely and consider your risk tolerance before making investment decisions on Gate.com.
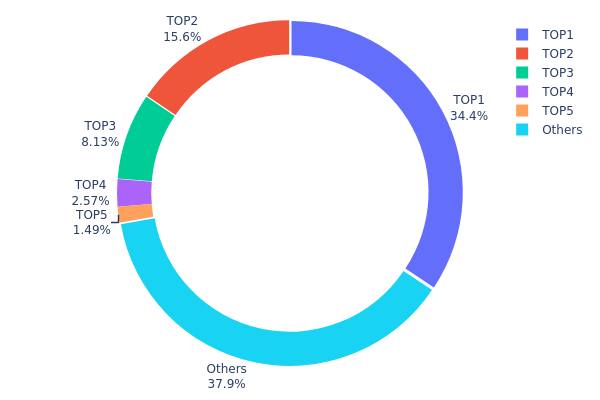
NS Holding Distribution
The holding distribution chart displays the percentage of NS tokens held by the top addresses compared to the overall circulating supply. This metric serves as a crucial indicator of token concentration, reflecting the degree of decentralization within the network and potential risks associated with concentrated ownership.
According to the current data, the top holder controls 171,923.83K NS tokens, representing 34.38% of the total supply, while the second-largest address holds 77,857.74K tokens (15.57%). The top three addresses collectively account for 58.07% of the circulating supply, indicating a relatively high concentration level. Such distribution patterns suggest that a small number of entities exert significant influence over the token's market dynamics. The fifth-largest holder possesses only 1.48% of the supply, and addresses outside the top five collectively hold 37.88%, demonstrating a sharp decline in holding percentages beyond the leading positions.
This concentrated distribution structure presents both opportunities and challenges for NS's market stability. On one hand, the substantial holdings by top addresses may indicate strong confidence from early investors or institutional participants, potentially providing price support during market downturns. On the other hand, excessive concentration introduces elevated volatility risks, as large-scale sell-offs by major holders could trigger sharp price corrections. Furthermore, such distribution patterns may reduce the token's resistance to manipulation, as coordinated actions by a few dominant addresses could significantly impact market sentiment and trading volumes. From a decentralization perspective, the current holding structure suggests that NS remains in a relatively centralized state, which may affect its long-term governance credibility and community participation enthusiasm.
Click to view current NS Holding Distribution
| Top |
Address |
Holding Qty |
Holding (%) |
| 1 |
0x2ba3...7206fe |
171923.83K |
34.38% |
| 2 |
0x2893...2c6d07 |
77857.74K |
15.57% |
| 3 |
0xe0d5...0a4d28 |
40626.54K |
8.12% |
| 4 |
0x60dd...b0984d |
12854.72K |
2.57% |
| 5 |
0x45dc...ced046 |
7432.68K |
1.48% |
| - |
Others |
189304.49K |
37.88% |
II. Core Factors Influencing NS Future Price
Supply Mechanism
- Market Supply and Demand Dynamics: NS price trajectory is influenced by the fundamental economic principle of supply-demand equilibrium. The balance between available token supply and market demand creates price pressure that directly impacts valuation levels.
- Historical Patterns: Historical market data suggests that supply-demand imbalances have generated notable price movements, with constrained supply during periods of increased adoption contributing to upward price momentum.
- Current Impact: The ongoing development of the NS ecosystem continues to shape supply-demand dynamics, with market participants monitoring token distribution patterns and circulation metrics to assess potential price influences.
Institutional and Large Holder Dynamics
- Institutional Positioning: Market participants, including professional investors and strategic entities, maintain varying positions in NS, contributing to overall market liquidity and price discovery mechanisms.
- Investor Strategies: Professional market participants employ diverse investment approaches, ranging from long-term positioning to tactical allocation strategies, which collectively influence market sentiment and price behavior.
Macroeconomic Environment
- Monetary Policy Influence: Global monetary conditions, including interest rate environments and liquidity conditions, shape the broader risk asset landscape in which NS operates. Changes in central bank policies can affect investor appetite for digital assets.
- Inflation Hedge Characteristics: NS may exhibit certain properties that attract investors seeking alternatives during specific economic conditions, though its effectiveness is subject to multiple market variables and broader cryptocurrency market trends.
- Geopolitical Considerations: International developments and regulatory evolution across jurisdictions contribute to the overall risk environment for digital assets, indirectly influencing NS market dynamics.
Technology Development and Ecosystem Construction
- Technology Advancement: Ongoing technical progress within the broader blockchain infrastructure supports the foundation for NS functionality and utility expansion, potentially enhancing long-term value propositions.
- Ecosystem Applications: The development of applications and use cases within the blockchain identity market represents a key driver for NS adoption and utility, with ecosystem growth potentially supporting fundamental value over time.
- Blockchain Development: The maturation of underlying blockchain technology and infrastructure continues to evolve, providing the technical foundation for NS operations and potential future capabilities.
III. 2026-2031 NS Price Prediction
2026 Outlook
- Conservative Prediction: $0.01634 - $0.02818
- Neutral Prediction: Around $0.02818
- Optimistic Prediction: Up to $0.03382 (requires favorable market conditions and increased adoption)
2027-2029 Mid-term Outlook
- Market Stage Expectation: Gradual growth phase with steady accumulation and potential ecosystem development
- Price Range Predictions:
- 2027: $0.02883 - $0.03317 (approximately 9% change)
- 2028: $0.02053 - $0.03305 (approximately 13% change)
- 2029: $0.02898 - $0.03517 (approximately 15% change)
- Key Catalysts: Market maturation, technological improvements, and broader crypto market trends
2030-2031 Long-term Outlook
- Baseline Scenario: $0.02303 - $0.03929 (assuming steady market growth and maintained project development)
- Optimistic Scenario: $0.03387 - $0.0523 (contingent on significant ecosystem expansion and favorable regulatory environment)
- Transformative Scenario: Approaching $0.0523 by 2031 (requires exceptional market conditions, major partnerships, and widespread adoption with approximately 29% cumulative change)
- 2026-01-29: NS price predictions indicate potential growth trajectory from current levels through 2031, with progressive upward momentum expected in the latter years
| Year |
Predicted High Price |
Predicted Average Price |
Predicted Low Price |
Price Change |
| 2026 |
0.03382 |
0.02818 |
0.01634 |
0 |
| 2027 |
0.03317 |
0.031 |
0.02883 |
9 |
| 2028 |
0.03305 |
0.03208 |
0.02053 |
13 |
| 2029 |
0.03517 |
0.03256 |
0.02898 |
15 |
| 2030 |
0.03929 |
0.03387 |
0.02303 |
19 |
| 2031 |
0.0523 |
0.03658 |
0.02999 |
29 |
IV. NS Professional Investment Strategy and Risk Management
NS Investment Methodology
(1) Long-term Holding Strategy
- Suitable for: Investors believing in blockchain identity infrastructure and the SUI ecosystem development
- Operational Recommendations:
- Consider accumulating positions during market corrections when NS trades near support levels
- Monitor SuiNS ecosystem adoption metrics and user growth as fundamental indicators
- Utilize Gate Web3 Wallet for secure storage with multi-signature protection
(2) Active Trading Strategy
- Technical Analysis Tools:
- Moving Averages: Monitor 50-day and 200-day moving averages to identify trend direction and potential entry/exit points
- Volume Analysis: Track 24-hour trading volume changes (current: $75,694) to assess market momentum and liquidity conditions
- Swing Trading Key Points:
- Note the recent 24-hour range between $0.02807 and $0.02978 for short-term trading opportunities
- Consider the 7-day decline of 8.66% when evaluating near-term support levels
NS Risk Management Framework
(1) Asset Allocation Principles
- Conservative Investors: 1-3% of crypto portfolio
- Aggressive Investors: 5-10% of crypto portfolio
- Professional Investors: Up to 15% with active hedging strategies
(2) Risk Hedging Solutions
- Position Sizing: Implement staged entry approach to average down cost basis during volatility
- Stop-loss Management: Set dynamic stop-loss levels based on recent volatility patterns
(3) Secure Storage Solutions
- Hot Wallet Recommendation: Gate Web3 Wallet for active trading with convenient access
- Cold Storage Solution: Hardware wallet storage for long-term holdings exceeding transaction needs
- Security Precautions: Enable two-factor authentication, verify contract addresses (0x5145494a5f5100e645e4b0aa950fa6b68f614e8c59e17bc5ded3495123a79178::ns::NS), and never share private keys
V. NS Potential Risks and Challenges
NS Market Risks
- High Volatility: NS has experienced significant price fluctuation with a 1-year decline of 86.69%, indicating substantial market volatility
- Limited Liquidity: With 24-hour trading volume of approximately $75,694, liquidity constraints may impact larger transactions
- Market Sentiment: Current market cap of $4.40 million represents relatively small market presence with potential concentration risk
NS Regulatory Risks
- Blockchain Naming Service Classification: Evolving regulatory frameworks may impact decentralized naming services differently across jurisdictions
- Identity Infrastructure Compliance: Potential scrutiny on digital identity solutions may introduce operational constraints
- Cross-border Data Regulations: International data privacy laws may affect SuiNS's cross-ecosystem integration capabilities
NS Technical Risks
- Smart Contract Vulnerabilities: As with all blockchain-based protocols, potential smart contract exploits remain a concern
- SUI Ecosystem Dependency: NS performance is closely tied to SUI blockchain adoption and technical stability
- Competition Risk: Emerging naming services on various blockchains may fragment market share and user adoption
VI. Conclusion and Action Recommendations
NS Investment Value Assessment
SuiNS (NS) represents a specialized infrastructure play within the blockchain naming service sector, offering potential value through digital identity simplification and cross-ecosystem interoperability. With a current circulating supply of 155.3 million tokens (31.06% of max supply) and market cap of $4.40 million, NS presents both early-stage growth potential and elevated risk. The substantial decline from its all-time high of $1.1936 (November 2024) to current levels near $0.0283 reflects broader market correction and requires careful consideration of recovery prospects versus continued downside risk.
NS Investment Recommendations
✅ Beginners: Consider starting with small allocations (1-2% of crypto portfolio) to gain exposure while learning about blockchain naming services; avoid investing funds needed for essential expenses
✅ Experienced Investors: May allocate 3-7% with staged entry approach, combining technical analysis with fundamental ecosystem monitoring; implement trailing stop-losses to protect capital
✅ Institutional Investors: Can consider strategic positions up to 10-15% with comprehensive due diligence on SUI ecosystem partnerships, development activity, and competitive positioning; employ portfolio hedging strategies
NS Trading Participation Methods
- Spot Trading: Purchase NS tokens directly on Gate.com with competitive trading fees and deep liquidity access
- Dollar-Cost Averaging: Implement systematic periodic purchases to reduce timing risk and average entry costs over market cycles
- Ecosystem Participation: Engage with SuiNS platform services to understand utility value and adoption trends firsthand
Cryptocurrency investment carries extremely high risk, and this article does not constitute investment advice. Investors should make cautious decisions based on their own risk tolerance and are advised to consult professional financial advisors. Never invest more than you can afford to lose.
FAQ
What is the historical price movement of NS?
Sui Name Service (NS) reached its all-time high of over $0.5834 USD on November 15, 2024. Since then, the price has experienced fluctuations. The token's price trajectory reflects market dynamics and trading volume changes over the period.
How to analyze and predict NS price movements?
Analyze NS price by examining market trends, historical data, and trading volume. Monitor network development, adoption metrics, and market sentiment. Use technical analysis with support/resistance levels. Consider macroeconomic factors and industry news affecting the broader crypto market.
What are the main factors affecting NS price?
NS price is primarily influenced by market volatility, trading volume, and market sentiment. News and social media significantly impact price movements. Limited liquidity can cause sharp price fluctuations in short periods.
NS price prediction accuracy and risks?
NS price predictions rely on market trend analysis and historical data, offering directional guidance. Accuracy varies based on market volatility and emerging factors. Main risks include market sentiment shifts, regulatory changes, and macroeconomic impacts affecting cryptocurrency valuations.
What are professional analysts' predictions for NS future price?
Professional analysts predict NS will experience steady growth driven by increasing adoption, strong market fundamentals, and positive ecosystem development. Long-term price trajectory is expected to reflect growing demand and utility expansion in the web3 space.
How are technical analysis and fundamental analysis applied in NS price prediction?
Technical analysis tracks price trends and trading volume patterns, while fundamental analysis evaluates NS project value and development progress. Combining both methods provides comprehensive price forecasting insights for informed decisions.
* The information is not intended to be and does not constitute financial advice or any other recommendation of any sort offered or endorsed by Gate.