This comprehensive analysis explores OAS (Oasys) price dynamics and investment opportunities from 2026 to 2031. Currently trading at $0.001347 with an $8.51 million market cap, OAS serves as a blockchain infrastructure solution for gaming applications. The article examines historical price evolution, market sentiment, and technical factors influencing future performance. Forecasts suggest potential growth from conservative ($0.00121-$0.00130 in 2026) to optimistic scenarios ($0.00322 by 2031), driven by ecosystem development and gaming adoption. Professional investment strategies, risk management frameworks, and storage solutions via Gate Web3 Wallet are detailed for diverse investor profiles. Key risks include price volatility, limited liquidity, and regulatory uncertainties. Suitable for investors seeking gaming blockchain exposure with moderate-to-high risk tolerance.
Introduction: OAS Market Position and Investment Value
Oasys (OAS), as a blockchain infrastructure specialized for gaming applications, has been making notable progress in the gaming blockchain sector since its launch in 2022. As of 2026, OAS maintains a market capitalization of approximately $8.51 million, with a circulating supply of around 6.32 billion tokens, and the price is holding at approximately $0.001347. This asset, recognized as a "gaming-focused blockchain solution," is playing an increasingly important role in bridging traditional gaming companies with blockchain technology.
This article will comprehensively analyze OAS price trends from 2026 to 2031, combining historical patterns, market supply and demand dynamics, ecosystem development, and macroeconomic conditions to provide investors with professional price forecasts and practical investment strategies.
I. OAS Price History Review and Market Status
OAS Historical Price Evolution Trajectory
- 2022: Oasys (OAS) was launched in December with the support of renowned gaming companies, focusing on revolutionizing blockchain gaming infrastructure.
- 2024: In February, OAS reached a notable price level of $0.141992, reflecting growing market interest in gaming-focused blockchain solutions.
- 2025-2026: The token experienced significant market volatility, with prices declining from higher levels to current trading ranges.
OAS Current Market Situation
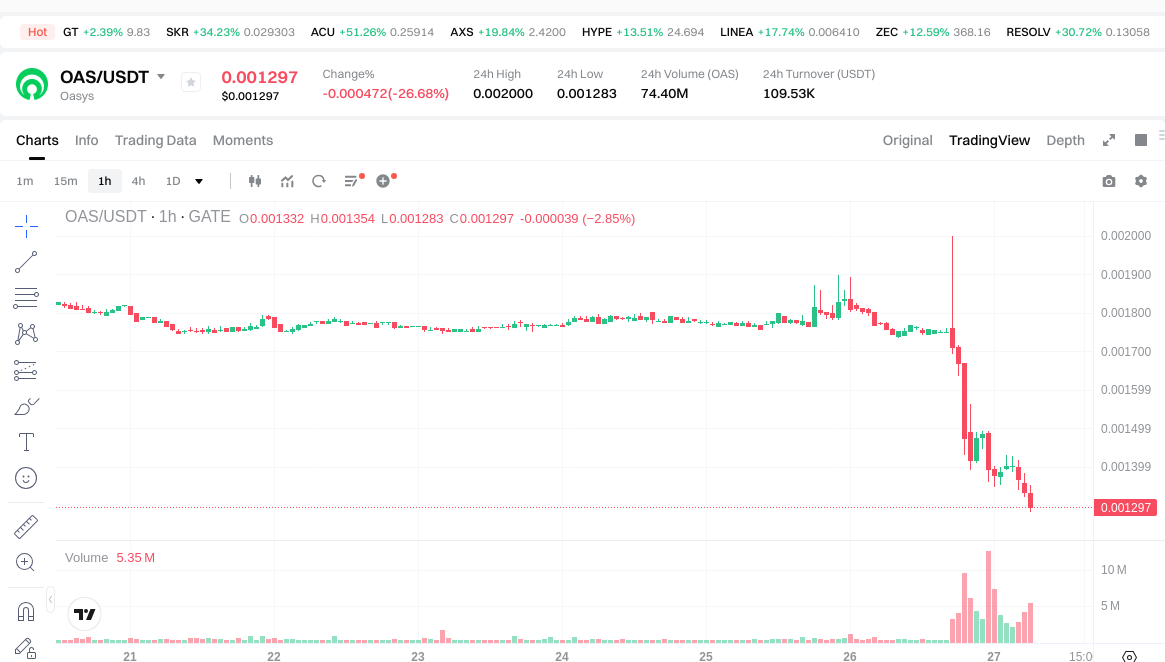
As of January 27, 2026, OAS is trading at $0.001347, representing a 24.78% decrease over the past 24 hours. The token has experienced notable price movements across different timeframes: a 2.48% decline in the past hour, a 27.76% decrease over the past week, and a 28.15% drop over the past 30 days. The annual performance shows a 95.36% decline from previous levels.
The current 24-hour trading range spans from a low of $0.001283 to a high of $0.002, with a total trading volume of $105,270.18. The market capitalization stands at approximately $8.51 million, with a circulating supply of 6.32 billion OAS tokens, representing 63.21% of the maximum supply of 10 billion tokens. The fully diluted market cap is calculated at $13.47 million.
OAS maintains a market dominance of 0.00043% and is currently listed on 9 exchanges. The token's all-time low price of $0.00135359 was recorded on January 27, 2026, coinciding with the current market conditions. The cryptocurrency market sentiment index indicates an "Extreme Fear" level of 20, reflecting broader market caution.
Click to view current OAS market price
OAS Market Sentiment Index
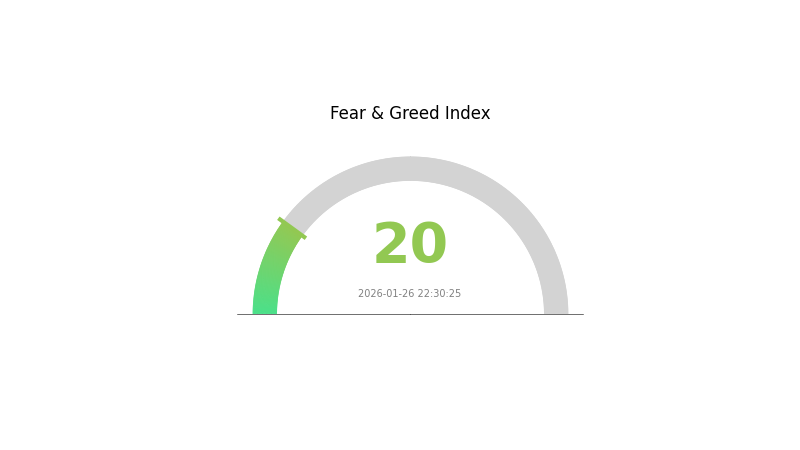
2026-01-26 Fear and Greed Index: 20 (Extreme Fear)
Click to view the current Fear & Greed Index
The cryptocurrency market is currently experiencing extreme fear, with the Fear and Greed Index standing at 20. This exceptionally low reading indicates widespread pessimism and risk aversion among market participants. Such extreme fear levels historically present contrarian opportunities for long-term investors, as severe market downturns often precede significant recoveries. However, traders should exercise caution and implement proper risk management strategies during this volatile period.
OAS Holdings Distribution
The holdings distribution chart illustrates the allocation of OAS tokens across different wallet addresses, providing insights into the concentration level of token ownership within the ecosystem. By analyzing the percentage of total supply held by top addresses, we can assess the degree of centralization and potential market dynamics influenced by large holders.
Based on current on-chain data, OAS demonstrates a relatively concentrated holdings pattern among top addresses. The distribution reveals that major holders collectively control a significant portion of the circulating supply, which is characteristic of many blockchain projects in their development phase. This concentration level suggests that a limited number of entities possess substantial influence over the token's liquidity and market movements. While such distribution is not uncommon for ecosystem tokens tied to specific blockchain infrastructure, it does indicate a centralized ownership structure that warrants careful monitoring.
The current holdings distribution carries important implications for market behavior and price volatility. High concentration among top addresses creates potential vulnerabilities, as large-scale transactions from these wallets could trigger significant price fluctuations or liquidity constraints. This structure may amplify market sensitivity to individual holder decisions, potentially resulting in more pronounced price swings during periods of token movement. Additionally, the concentrated nature of holdings could theoretically facilitate coordinated market actions, though this depends heavily on the identity and coordination capabilities of major holders—many of whom may be project-related entities, institutional investors, or strategic partners with long-term commitment horizons.
From a decentralization perspective, the current address distribution reflects a developing ecosystem rather than a fully matured, widely distributed token economy. The holdings pattern indicates that OAS remains in a phase where project development entities and early stakeholders maintain substantial positions, which is typical for infrastructure-focused blockchain projects. This structure provides project teams with necessary resources for ecosystem development but simultaneously limits the immediate benefits of fully decentralized governance and market dynamics. The on-chain structure demonstrates stability in terms of committed long-term holders but suggests room for improvement in broadening token distribution across a more diverse holder base as the ecosystem evolves.
Click to view current OAS Holdings Distribution

| Top |
Address |
Holding Qty |
Holding (%) |
II. Core Factors Influencing OAS Future Price Trends
Supply Mechanism
- Circulating Supply Status: As of January 2026, OAS has approximately 6.32 billion tokens in circulation with a market capitalization of around $11.47 million.
- Historical Pattern: The token experienced significant price volatility in 2024, with a peak of $0.142 in February, reflecting substantial market fluctuations.
- Current Impact: The current price of approximately $0.001816 represents a decline of -93.67% over the past year, indicating substantial downward pressure on token valuation.
Institutional and Major Holder Dynamics
- Market Position: OAS ranks approximately 1134 in market capitalization, positioning it as a small-cap gaming token with limited institutional presence.
- 24-Hour Trading Volume: Trading volume stands at approximately $14,648.75, suggesting limited market depth and liquidity constraints.
- Adoption Status: The project's long-term value depends heavily on its ability to attract game developers and achieve ecosystem adoption.
Macroeconomic Environment
- Monetary Policy Impact: The broader cryptocurrency market environment and macroeconomic conditions significantly influence OAS price movements.
- Market Correlation: As a small market-cap token, OAS shows high sensitivity to overall crypto market trends and Bitcoin price movements.
- Economic Outlook: Market expectations regarding inflation trends and economic growth pace will serve as core drivers for future price trajectory.
Technical Development and Ecosystem Building
- EVM Compatibility: Oasys maintains compatibility with the Ethereum Virtual Machine, allowing standard Ethereum wallet infrastructure to support OAS storage.
- Gaming Blockchain Infrastructure: The platform focuses on blockchain gaming infrastructure, positioning itself within a specialized sector of the crypto industry.
- Developer Adoption: The project's success depends critically on its ability to attract game developers, drive ecosystem adoption, and execute its technical roadmap effectively.
- Multi-Layer Architecture: The platform employs a multi-layer architecture design, though this introduces security and upgrade challenges that require ongoing attention.
III. 2026-2031 OAS Price Forecast
2026 Outlook
- Conservative forecast: $0.00121 - $0.00130
- Neutral forecast: $0.00130 - $0.00150
- Optimistic forecast: $0.00150 - $0.00171 (contingent upon favorable market conditions and increased adoption)
Based on the analytical data, OAS is projected to experience a slight price decline of approximately 3% during 2026. The predicted average price centers around $0.00130, with potential fluctuations between $0.00121 at the lower bound and $0.00171 at the upper threshold. This initial period may reflect market consolidation as the project establishes its technical foundation and user base.
2027-2029 Mid-Term Outlook
- Market phase expectation: Recovery and gradual growth trajectory as ecosystem development progresses
- Price range forecasts:
- 2027: $0.00098 - $0.00223 (projected 11% increase)
- 2028: $0.00144 - $0.00196 (projected 38% increase)
- 2029: $0.00122 - $0.00222 (projected 41% increase)
- Key catalysts: Potential technical upgrades, expanding use cases within the blockchain gaming sector, and broader market recovery phases could serve as primary drivers for price appreciation during this period.
The mid-term outlook suggests progressive price appreciation, with 2028 and 2029 showing particularly strong growth momentum. The average prices are forecasted to rise from $0.0015 in 2027 to $0.00191 by 2029, reflecting potential ecosystem maturation and increased market recognition.
2030-2031 Long-Term Outlook
- Baseline scenario: $0.00112 - $0.00207 (assuming steady ecosystem development and stable market conditions)
- Optimistic scenario: $0.00207 - $0.00275 (assuming accelerated adoption and favorable regulatory environment)
- Transformative scenario: $0.00221 - $0.00322 (contingent upon breakthrough technological implementations and widespread mainstream integration)
The long-term projections indicate substantial growth potential, with 2030 forecasting a 53% increase and 2031 potentially reaching a 78% gain. By 2031, the predicted average price could reach $0.00241, with the upper range extending to $0.00322. These projections assume continued technological development, sustained user engagement, and favorable macroeconomic conditions within the digital asset space.
Traders interested in OAS can monitor these price developments and execute transactions through Gate.com, which provides comprehensive trading infrastructure for emerging blockchain assets.
| Year |
Predicted High Price |
Predicted Average Price |
Predicted Low Price |
Price Change |
| 2026 |
0.00171 |
0.0013 |
0.00121 |
-3 |
| 2027 |
0.00223 |
0.0015 |
0.00098 |
11 |
| 2028 |
0.00196 |
0.00187 |
0.00144 |
38 |
| 2029 |
0.00222 |
0.00191 |
0.00122 |
41 |
| 2030 |
0.00275 |
0.00207 |
0.00112 |
53 |
| 2031 |
0.00322 |
0.00241 |
0.00221 |
78 |
IV. OAS Professional Investment Strategy and Risk Management
OAS Investment Methodology
(I) Long-term Holding Strategy
- Target Investors: Crypto enthusiasts interested in blockchain gaming infrastructure and patient investors seeking exposure to the gaming sector
- Operational Recommendations:
- Consider dollar-cost averaging to mitigate volatility risk, especially given the token's recent price fluctuations
- Monitor ecosystem development milestones and gaming partnerships for potential accumulation opportunities
- Storage Solution: Utilize Gate Web3 Wallet for secure OAS token storage with multi-signature features
(II) Active Trading Strategy
- Technical Analysis Tools:
- Moving Averages: Apply 50-day and 200-day moving averages to identify potential trend reversals in OAS price movements
- Volume Analysis: Monitor the 24-hour trading volume ($105,270) relative to market cap to gauge trading activity intensity
- Swing Trading Considerations:
- Watch for support levels near recent lows around $0.001283 and resistance near $0.002
- Consider the high volatility demonstrated by recent percentage changes when setting stop-loss orders
OAS Risk Management Framework
(I) Asset Allocation Principles
- Conservative Investors: 1-2% of crypto portfolio
- Aggressive Investors: 3-5% of crypto portfolio
- Professional Investors: 5-8% of crypto portfolio with active monitoring
(II) Risk Hedging Solutions
- Diversification Strategy: Balance OAS holdings with established Layer-1 tokens and stablecoins to reduce gaming sector concentration risk
- Position Sizing: Limit individual position exposure given the 63.21% market cap to FDV ratio indicating significant token unlock potential
(III) Secure Storage Solutions
- Hot Wallet Recommendation: Gate Web3 Wallet for active trading and ecosystem participation
- Cold Storage Approach: Hardware wallet solutions for long-term holdings exceeding immediate trading needs
- Security Precautions: Enable two-factor authentication, regularly update wallet software, and never share private keys or seed phrases
V. OAS Potential Risks and Challenges
OAS Market Risks
- Price Volatility: Recent performance shows -24.78% in 24 hours and -95.36% over one year, indicating substantial price instability
- Liquidity Concerns: Trading volume of $105,270 relative to market cap may present challenges for large position entries or exits
- Market Dominance: With only 0.00043% market share, OAS faces significant competition from established gaming blockchain platforms
OAS Regulatory Risks
- Gaming Token Classification: Evolving regulatory frameworks around blockchain gaming tokens could impact OAS utility and trading status
- Multi-Jurisdictional Compliance: Gaming-focused blockchain projects may face varying regulatory requirements across different regions
- Token Economics Scrutiny: Regulatory bodies may examine tokenomics models and distribution mechanisms in gaming ecosystems
OAS Technical Risks
- Smart Contract Vulnerabilities: As an EVM-compatible protocol, OAS inherits potential security risks common to Ethereum-based systems
- Scalability Challenges: The Hub-Layer and Verse-Layer architecture requires continuous technical optimization to maintain performance
- Ecosystem Dependencies: Project success relies heavily on gaming company adoption and developer ecosystem growth
VI. Conclusion and Action Recommendations
OAS Investment Value Assessment
OAS presents a specialized investment opportunity in the blockchain gaming infrastructure sector. The project's EVM compatibility and unique Hub-Layer/Verse-Layer architecture provide technical foundations for gaming applications. However, the token faces notable challenges including substantial price volatility (-95.36% over one year), limited market share (0.00043%), and modest trading volume. The 63.21% circulating supply suggests potential dilution risks. Long-term value depends on gaming company adoption and ecosystem development, while short-term risks stem from market conditions and sector-specific headwinds affecting gaming tokens.
OAS Investment Recommendations
✅ Beginners: Start with minimal allocation (under 1% of crypto portfolio) and focus on understanding the gaming blockchain sector before increasing exposure
✅ Experienced Investors: Consider small speculative positions with strict risk management, monitoring gaming partnership announcements and ecosystem metrics
✅ Institutional Investors: Conduct thorough due diligence on gaming adoption metrics and technical infrastructure before considering strategic positions with defined risk parameters
OAS Trading Participation Methods
- Spot Trading: Execute buy and sell orders on Gate.com with limit orders to manage volatility
- Portfolio Diversification: Include OAS as part of a broader gaming token portfolio to balance sector-specific risks
- Ecosystem Participation: Explore opportunities within the Oasys gaming ecosystem while holding tokens for potential utility value
Cryptocurrency investment carries extreme risk, and this article does not constitute investment advice. Investors should make prudent decisions based on their own risk tolerance and are advised to consult professional financial advisors. Never invest more than you can afford to lose.
FAQ
OAS is a blockchain-based token designed for decentralized finance applications. It serves as a utility token enabling network participation, governance, and transaction settlement within its ecosystem. OAS facilitates smart contract execution and provides holders with platform governance rights and staking rewards.
What is the OAS price prediction for 2024?
For 2024, OAS price is predicted to range from $0.281 to $0.310, with an average price of $0.263. Long-term projections suggest OAS could reach $0.960 to $0.989 by 2030.
What are the main factors affecting OAS price?
OAS price is primarily influenced by quarterly CPI changes and CPP increase rates. In 2025, CPP rose 2.6%, directly impacting OAS value. Market sentiment, adoption rates, and macroeconomic conditions also play significant roles.
How to analyze and predict the future price trend of OAS?
Analyze OAS price by examining technical indicators, trading volume trends, and market sentiment. Expert predictions for 2027 range from $0.00125 to $0.00279. Long-term forecasts suggest potential decline to $0.001574 by 2030. Monitor project developments and overall crypto market conditions for comprehensive analysis.
Common OAS price prediction methods include technical analysis, dollar-cost averaging (DCA), and expert market analysis. Popular tools include K-line charts, blockchain analytics platforms, and on-chain data monitoring for transaction volume and holder behavior analysis.
OAS has demonstrated significant volatility as a gaming-focused blockchain infrastructure token. With a current price of $0.001816 and a market cap around $11.47 million, OAS has experienced notable price fluctuations. Compared to other gaming layer-1 solutions, OAS maintains a distinct position focused on blockchain gaming infrastructure, though it faces competitive pressures from established gaming chains in the ecosystem.
What are the risks and return expectations for investing in OAS?
OAS investments carry risks including interest rate volatility and credit risk, but offer higher yields than risk-free assets. Returns vary with market perception of embedded options and credit spreads, potentially providing attractive compensation for investors accepting these risks.
Where can I view OAS historical price data?
You can view OAS historical price data on Yahoo Finance. Visit https://hk.finance.yahoo.com/quote/OAS-USD/history/ to access daily, weekly, or monthly price records and trading volume information.
* The information is not intended to be and does not constitute financial advice or any other recommendation of any sort offered or endorsed by Gate.