This comprehensive guide provides professional analysis and market forecasts for Orbiter Finance (OBT) token through 2031. The article examines OBT's current market position at $0.001965 with $10.41 million market cap, reviews its price trajectory since 2025 launch on Gate, and delivers detailed predictions: 2026 ($0.00128-$0.00281), 2027-2029 gradual growth phase ($0.00139-$0.00399), and 2030-2031 expansion to $0.00256-$0.00595. Designed for investors ranging from beginners to institutions, the guide presents actionable investment strategies including long-term holding and active trading approaches, complemented by robust risk management frameworks and allocation guidelines. It addresses critical factors including extreme market sentiment (Fear Index: 25), token concentration risks, and ecosystem development catalysts. Investors gain practical insights on secure storage via Gate Web3 Wallet, diversification tactics, and comprehensive risk assessment covering volatility, liquidity, regulatory, and technical c
Introduction: OBT's Market Position and Investment Value
Orbiter Finance (OBT), as a ZK technology-based interoperability protocol, has been working to enhance blockchain interaction security and seamless interoperability since its launch in 2025. As of 2026, OBT has a market capitalization of approximately $10.41 million, with a circulating supply of around 5.3 billion tokens, and the price is maintained at approximately $0.001965. This asset, recognized as an innovative cross-chain solution, is playing an increasingly important role in reducing liquidity fragmentation and redefining Web3 experiences in the multi-chain era.
This article will comprehensively analyze OBT's price trends from 2026 to 2031, combining historical patterns, market supply and demand, ecosystem development, and macroeconomic environment to provide investors with professional price forecasts and practical investment strategies.
I. OBT Price History Review and Market Status
OBT Historical Price Evolution Trajectory
- 2025: Orbiter Finance (OBT) launched on Gate.com at a publish price of 0.02, marking its entry into the market in January 2025
- 2025: Token reached a peak of 0.0335 on March 14, 2025, representing a significant milestone in its early trading history
- 2025: Market experienced a downward correction phase, with price declining from the March high of 0.0335 to a low of 0.001936 on December 18, 2025
OBT Current Market Status
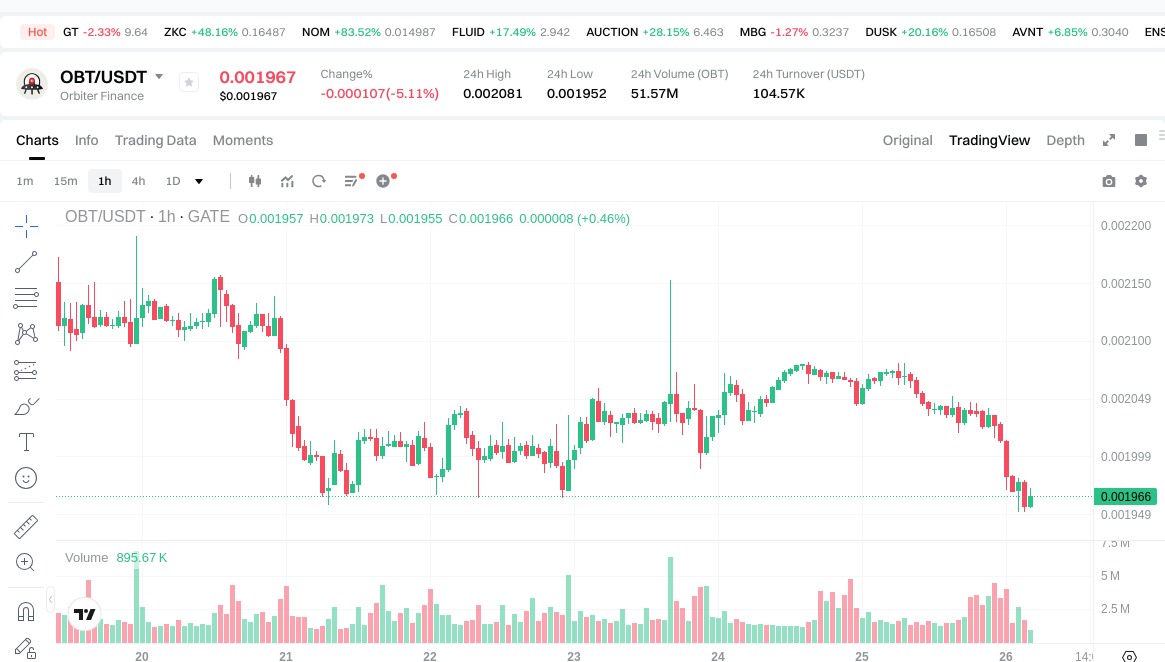
As of January 26, 2026, OBT is trading at 0.001965, showing a 24-hour decline of 5.16%. The token has experienced negative momentum across multiple timeframes, with a 1-hour decrease of 0.25%, a 7-day decline of 12.85%, and a 30-day drop of 7.31%. Over the past year, the token has declined by 82.77%.
The current trading price of 0.001965 is positioned near the all-time low of 0.001936 recorded on December 18, 2025, and considerably below the all-time high of 0.0335 reached on March 14, 2025. The 24-hour trading range shows movement between a low of 0.001952 and a high of 0.002081.
OBT maintains a market capitalization of approximately 10.41 million, with a 24-hour trading volume of 104,571.14. The circulating supply stands at 5.3 billion tokens, representing 53% of the maximum supply of 10 billion tokens. The fully diluted market cap is calculated at 19.65 million. The token holds a market dominance of 0.00064%, ranking at position 1,167 in the broader crypto market.
With 76,586 holders and availability on 8 exchanges, OBT demonstrates a moderate distribution across the market. The market sentiment indicator registers at 25, reflecting extreme fear conditions in the current environment.
Click to view current OBT market price
OBT Market Sentiment Indicator
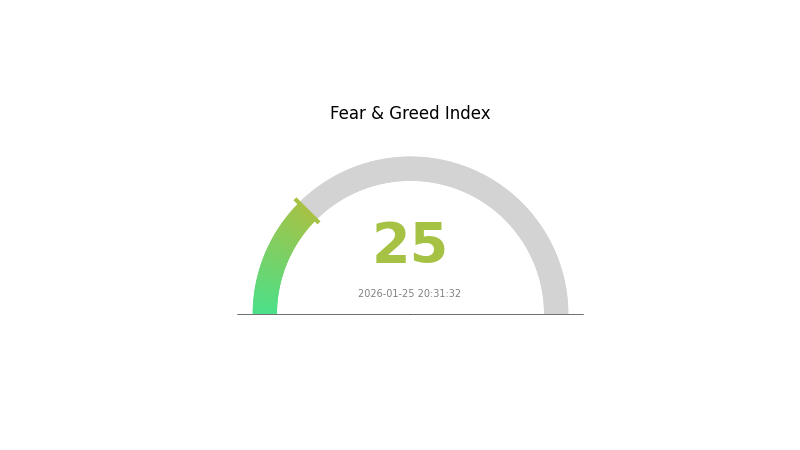
2026-01-25 Fear and Greed Index: 25 (Extreme Fear)
Click to view current Fear & Greed Index
The cryptocurrency market is experiencing extreme fear, with the Fear and Greed Index dropping to 25. This level indicates significant market pessimism and investor anxiety. During such periods, risk-averse investors typically reduce positions, while contrarian traders may identify potential buying opportunities at depressed valuations. Market volatility remains elevated as participants reassess portfolio allocations. Monitor key support levels closely and consider your risk tolerance before making investment decisions in this highly uncertain environment.
OBT Holding Distribution
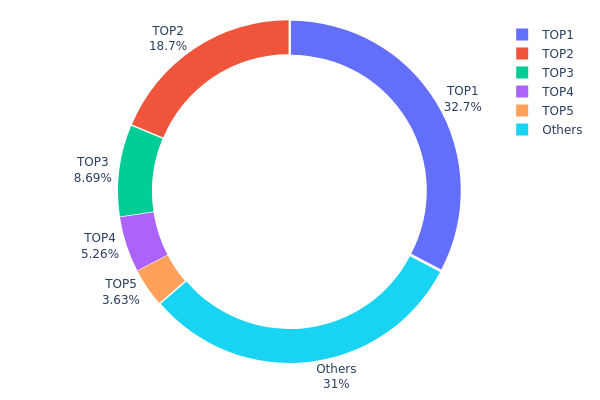
The holding distribution chart reveals the allocation of OBT tokens across different wallet addresses, serving as a critical indicator of decentralization and market structure stability. According to the latest on-chain data, the top five addresses collectively hold 1,818,842.95K OBT tokens, accounting for 68.94% of the total circulating supply, while the remaining 31.06% is distributed among other addresses.
The concentration level of OBT presents a moderately centralized pattern. The largest holder controls 862,171.07K tokens (32.69%), followed by the second-largest with 492,868.63K tokens (18.68%). This significant concentration in the top two addresses, which together command over 51% of the supply, raises concerns about potential market manipulation risks and liquidity vulnerabilities. The third through fifth positions hold 8.69%, 5.26%, and 3.62% respectively, demonstrating a relatively steep decline in holding percentages that suggests limited distribution among major stakeholders.
Such concentration dynamics carry substantial implications for OBT's market behavior. The dominance of top holders creates inherent price volatility risks, as large-scale selling pressure from any major address could trigger significant market reactions. Furthermore, this distribution pattern indicates that OBT's on-chain governance and price discovery mechanisms may be susceptible to influence from a relatively small group of entities. The 31.06% held by other addresses, while representing broader community participation, may lack sufficient collective influence to counterbalance decisions made by top holders. For potential investors and existing holders, monitoring changes in this distribution pattern becomes essential for assessing long-term project sustainability and market stability.
Click to view current OBT Holding Distribution
| Top |
Address |
Holding Qty |
Holding (%) |
| 1 |
0x40b8...8bef9a |
862171.07K |
32.69% |
| 2 |
0xd823...b01dfb |
492868.63K |
18.68% |
| 3 |
0xc882...84f071 |
229301.67K |
8.69% |
| 4 |
0x0d07...b492fe |
138835.92K |
5.26% |
| 5 |
0x13df...7e4679 |
95665.73K |
3.62% |
| - |
Others |
818534.45K |
31.06% |
II. Core Factors Influencing OBT's Future Price
Based on the available information, there is currently insufficient data to provide a comprehensive analysis of the core factors that may influence OBT's future price movements. A thorough evaluation would require detailed information about the project's supply mechanisms, institutional adoption patterns, macroeconomic correlations, and technical development roadmap.
Investors interested in OBT should conduct independent research and seek additional information from official project channels and verified sources before making any investment decisions.
III. 2026-2031 OBT Price Prediction
2026 Outlook
- Conservative Prediction: $0.00128 - $0.00197
- Neutral Prediction: Around $0.00197
- Optimistic Prediction: Up to $0.00281 (requires favorable market conditions and increased adoption)
2027-2029 Outlook
- Market Stage Expectation: OBT may enter a gradual growth phase with improving market recognition and potential ecosystem development
- Price Range Predictions:
- 2027: $0.00139 - $0.00256 (projected 21% change)
- 2028: $0.00200 - $0.00319 (projected 25% change)
- 2029: $0.00192 - $0.00399 (projected 44% change)
- Key Catalysts: Market sentiment recovery, potential platform integrations, and broader cryptocurrency adoption trends
2030-2031 Long-term Outlook
- Baseline Scenario: $0.00256 - $0.00508 (assuming steady market development and maintained project momentum)
- Optimistic Scenario: $0.00341 - $0.00595 (assuming enhanced utility, strategic partnerships, and favorable regulatory environment)
- Transformative Scenario: Potential to reach $0.00595 by 2031 (requires significant technological breakthroughs, mass adoption, and sustained bull market conditions with 116% projected change)
- 2026-01-26: OBT trading within initial prediction range as the token establishes its market position
| Year |
Predicted High Price |
Predicted Average Price |
Predicted Low Price |
Price Change |
| 2026 |
0.00281 |
0.00197 |
0.00128 |
0 |
| 2027 |
0.00256 |
0.00239 |
0.00139 |
21 |
| 2028 |
0.00319 |
0.00247 |
0.002 |
25 |
| 2029 |
0.00399 |
0.00283 |
0.00192 |
44 |
| 2030 |
0.00508 |
0.00341 |
0.00256 |
73 |
| 2031 |
0.00595 |
0.00425 |
0.00259 |
116 |
IV. OBT Professional Investment Strategy and Risk Management
OBT Investment Methodology
(I) Long-Term Holding Strategy
- Suitable for: Investors seeking exposure to cross-chain infrastructure development
- Operational Recommendations:
- Consider accumulating positions during market corrections when technical indicators suggest oversold conditions
- Monitor project development milestones and ecosystem expansion as key holding indicators
- Storage Solution: Gate Web3 Wallet provides secure non-custodial storage with multi-chain support for OBT tokens on Arbitrum
(II) Active Trading Strategy
- Technical Analysis Tools:
- Moving Averages: Track 20-day and 50-day moving averages to identify trend reversals and momentum shifts
- Volume Analysis: Monitor 24-hour trading volume fluctuations to gauge market interest and liquidity conditions
- Swing Trading Key Points:
- Pay attention to the recent 7-day decline of approximately 12.85% which may present potential entry opportunities
- Set stop-loss orders to manage downside risk given the token's volatility patterns
OBT Risk Management Framework
(I) Asset Allocation Principles
- Conservative Investors: 1-3% of crypto portfolio allocation
- Aggressive Investors: 5-8% of crypto portfolio allocation
- Professional Investors: Up to 10-15% with active monitoring
(II) Risk Hedging Approaches
- Diversification Strategy: Balance OBT holdings with exposure to established Layer 1 and Layer 2 protocols
- Position Sizing: Use dollar-cost averaging to mitigate entry timing risk
(III) Secure Storage Solutions
- Non-Custodial Wallet Recommendation: Gate Web3 Wallet supports OBT tokens on Arbitrum with enhanced security features
- Multi-Signature Approach: For larger holdings, consider implementing multi-signature wallet solutions
- Security Precautions: Never share private keys, enable two-factor authentication, and regularly verify contract addresses before transactions
V. OBT Potential Risks and Challenges
OBT Market Risks
- Price Volatility: Recent 30-day decline of 7.31% demonstrates significant price fluctuations that may continue
- Liquidity Concerns: Current 24-hour trading volume suggests moderate liquidity levels that may impact large order execution
- Market Sentiment: Limited exchange listings (8 exchanges) may constrain trading opportunities and price discovery
OBT Regulatory Risks
- Cross-Chain Protocol Oversight: Evolving regulatory frameworks for cross-chain bridges and interoperability solutions may introduce compliance requirements
- Jurisdictional Uncertainty: Multi-chain operations may face varying regulatory interpretations across different regions
- Token Classification: Potential regulatory scrutiny regarding token utility and classification standards
OBT Technical Risks
- Smart Contract Vulnerabilities: Cross-chain protocols face inherent complexity that may expose security vulnerabilities
- Bridge Security: Historical bridge exploits in the crypto ecosystem highlight risks associated with cross-chain asset transfers
- Network Dependencies: Reliance on underlying blockchain networks (Arbitrum) introduces technical dependencies and potential performance constraints
VI. Conclusion and Action Recommendations
OBT Investment Value Assessment
Orbiter Finance presents a value proposition centered on cross-chain interoperability infrastructure within the evolving multi-chain ecosystem. The project's focus on ZK technology and universal cross-chain protocols addresses genuine market needs for seamless blockchain interaction. However, investors should carefully weigh the current market performance indicators, including recent price declines and moderate trading volumes, against the long-term potential of cross-chain infrastructure development.
OBT Investment Recommendations
✅ Beginners: Consider starting with small position sizes (1-2% of crypto portfolio) to gain familiarity with cross-chain protocols while learning about the technology
✅ Experienced Investors: May allocate 3-5% of crypto portfolio with active monitoring of project developments and market conditions
✅ Institutional Investors: Conduct thorough due diligence on protocol architecture, security audits, and ecosystem partnerships before considering strategic allocations
OBT Trading Participation Methods
- Spot Trading: Purchase OBT tokens directly through Gate.com for straightforward exposure
- Dollar-Cost Averaging: Implement systematic periodic purchases to mitigate timing risk
- Storage and Staking: Utilize Gate Web3 Wallet for secure storage and monitor potential staking opportunities as the ecosystem develops
Cryptocurrency investments carry extremely high risks, and this article does not constitute investment advice. Investors should make prudent decisions based on their own risk tolerance and are advised to consult professional financial advisors. Never invest more than you can afford to lose.
FAQ
What is OBT? What are its uses and application scenarios?
OBT is a blockchain utility token designed for decentralized ecosystems. It powers smart contracts, enables governance participation, and facilitates transactions within Web3 applications. Key uses include DeFi protocols, NFT platforms, and cross-chain operations, providing holders with protocol benefits and staking rewards.
What are the main factors affecting OBT price?
OBT price is primarily influenced by market demand and supply dynamics, trading volume in the market, overall cryptocurrency market sentiment, project development progress and partnerships, and macroeconomic factors affecting the broader digital asset sector.
What is the historical price trend of OBT?
OBT has demonstrated significant growth since its launch, with price appreciation driven by increasing adoption and market demand. The token experienced notable volatility in 2024-2025, reflecting market cycles. Recent momentum suggests continued upward trajectory as the project expands its ecosystem and user base.
What are professional analysts' predictions for OBT's future price?
Professional analysts project OBT could reach $0.85-$1.20 by end of 2026, driven by increasing adoption and strong market fundamentals. Long-term predictions suggest potential growth to $2-$3 range within 3-5 years as the ecosystem expands and utility increases.
What risks should I pay attention to when investing in OBT?
OBT investment risks include market volatility, liquidity fluctuations, regulatory changes, and technology uncertainties. Monitor trading volume, project developments, and market conditions carefully. Diversify your portfolio and only invest what you can afford to lose.
What are the advantages or disadvantages of OBT compared to similar tokens?
OBT offers superior transaction speed, lower fees, and enhanced security features. Strong community support and continuous development provide competitive advantages over similar tokens in the market.
How is OBT's market liquidity and trading volume?
OBT maintains strong market liquidity with substantial daily trading volume. The token shows consistent trading activity across major platforms, ensuring smooth transactions and competitive pricing for both buyers and sellers in the market.
What security considerations should I be aware of when buying and holding OBT?
Use secure wallets with strong passwords, enable two-factor authentication, verify contract addresses carefully, avoid phishing links, store private keys safely offline, and only trade on reputable platforms. Never share sensitive information and keep your devices secure.
* The information is not intended to be and does not constitute financial advice or any other recommendation of any sort offered or endorsed by Gate.