This comprehensive analysis examines Origin Protocol's OGN token price trajectory from 2026 to 2031, providing investors with data-driven forecasts and strategic guidance. Currently trading at $0.03038 with a market cap of $20.07 million, OGN faces significant concentration risks with top holders controlling 61% of supply. The article projects conservative 2026 forecasts ranging from $0.02004 to $0.03188, with potential growth to $0.05736 by 2031 under optimistic scenarios. Key sections cover historical performance analysis, core market factors, professional investment methodologies including long-term staking and active trading strategies, and comprehensive risk management frameworks. Essential for DeFi investors, the guide recommends cautious allocation percentages (2-15% based on risk profile) and secure storage solutions on Gate, while highlighting regulatory uncertainties and smart contract vulnerabilities as primary concerns for OGN investors.
Introduction: OGN's Market Position and Investment Value
Origin Protocol (OGN), positioned as one of Ethereum's longest-standing DeFi governance and value-accrual tokens, has been serving the decentralized finance ecosystem since 2020. As of 2026, OGN maintains a market capitalization of approximately $20.07 million, with a circulating supply of around 660.6 million tokens, trading at approximately $0.03038. This asset, known as a "sustainable yield ecosystem governance token," plays an increasingly important role in multichain DeFi yield generation and decentralized governance.
This article will comprehensively analyze OGN's price trajectory from 2026 to 2031, combining historical patterns, market supply and demand dynamics, ecosystem development, and macroeconomic conditions to provide investors with professional price forecasts and practical investment strategies.
I. OGN Price History Review and Market Status
OGN Historical Price Evolution Trajectory
- 2020: Token launched on January 6, price started at $0.4
- 2021: During the bull market cycle in April, price reached an all-time high of $3.35
- 2023-2025: Market adjustment period, price experienced significant volatility
- 2025: In October, price dropped to a historical low of $0.02590906
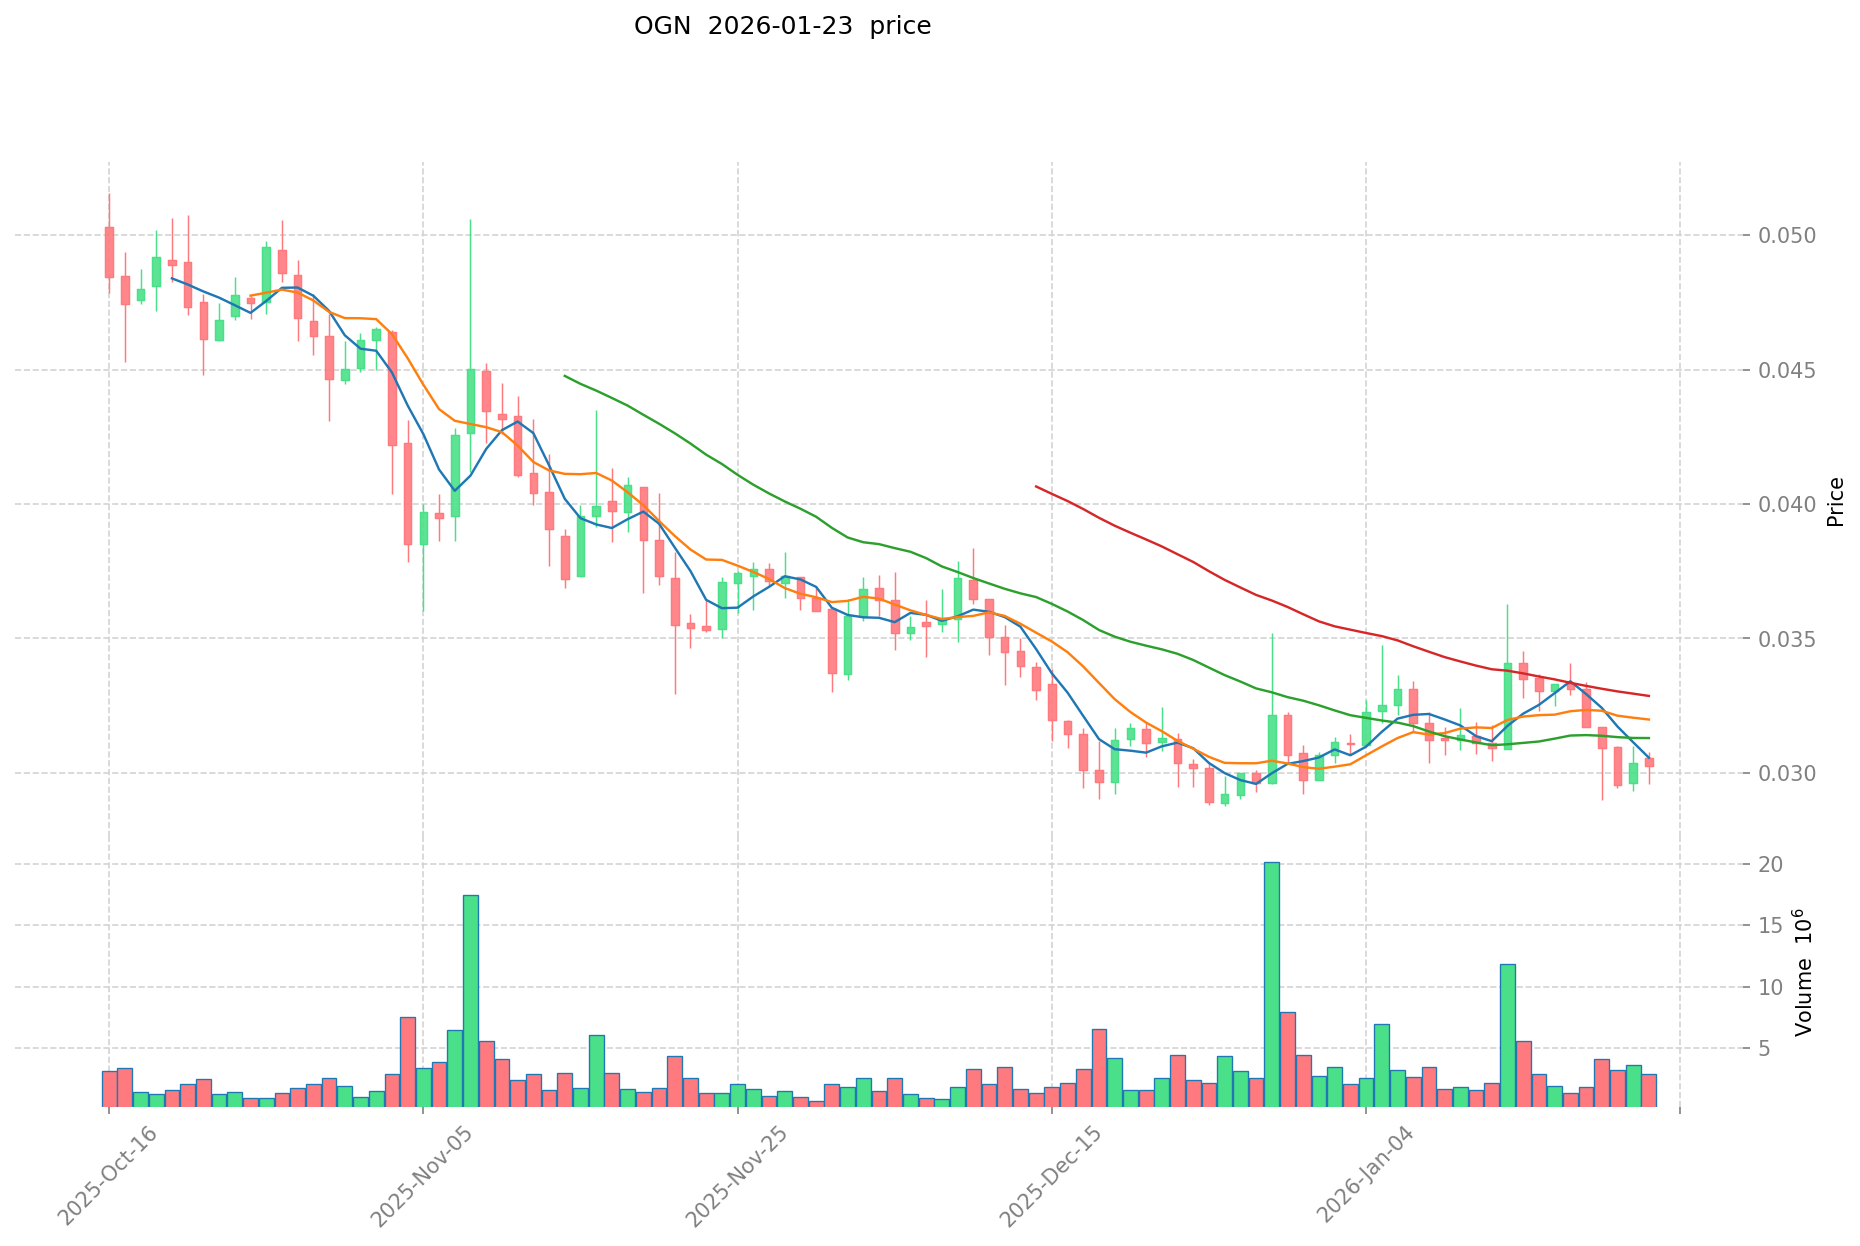
OGN Current Market Situation
As of January 23, 2026, OGN is trading at $0.03038, with a 24-hour trading volume of $83,665.41. The token shows a modest 1-hour price increase of 0.2%, while experiencing a slight 24-hour decline of 0.58%. Over the past 7 days, OGN has decreased by 8.18%, though it maintains a 30-day gain of 0.4%. The annual performance indicates a decline of 69.52%.
The market capitalization stands at approximately $20.07 million, with a circulating supply of 660.6 million tokens, representing 46.86% of the total supply of 1.41 billion tokens. The fully diluted market cap is calculated at $42.83 million. Within the 24-hour period, OGN reached a high of $0.03077 and a low of $0.0296.
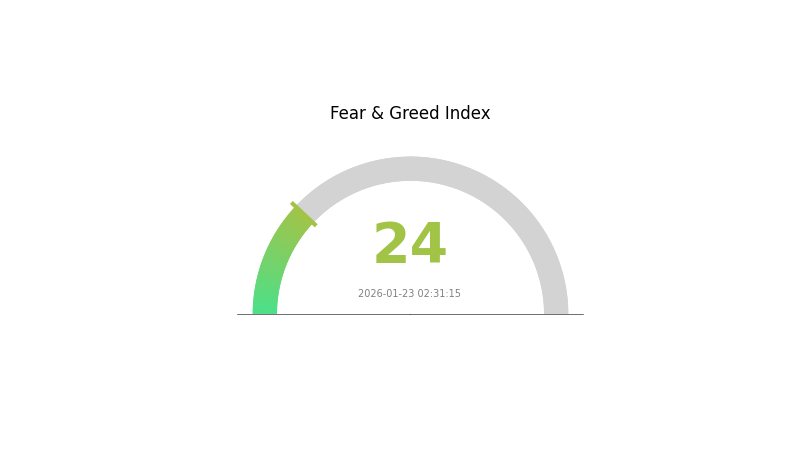
Origin Protocol maintains listings on 26 exchanges and has attracted approximately 45,410 token holders. The current market share accounts for 0.0013% of the overall cryptocurrency market. The Crypto Fear & Greed Index currently registers at 24, indicating an "Extreme Fear" sentiment in the broader market.
Click to view current OGN market price
Market Sentiment Indicator
01-23-2026 Fear and Greed Index: 24 (Extreme Fear)
Click to view current Fear & Greed Index
The cryptocurrency market is currently experiencing extreme fear, with the Fear and Greed Index dropping to 24. This historically low reading indicates severe market pessimism and heightened risk aversion among investors. During such periods, market volatility tends to increase significantly, and many digital assets experience substantial price corrections. However, extreme fear episodes often present contrarian opportunities for long-term investors, as panic-driven sell-offs can create attractive entry points. Traders should exercise caution with position sizing and consider employing risk management strategies while monitoring for potential market reversal signals.
OGN 持仓分布
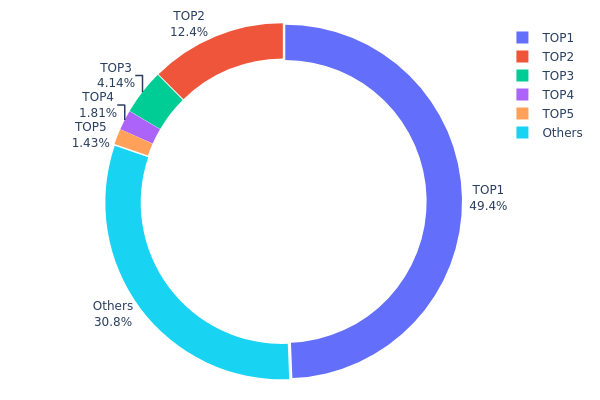
The holding distribution chart represents the allocation of tokens across different wallet addresses, serving as a crucial indicator of asset concentration and decentralization level within the blockchain network. This metric helps assess whether token holdings are dominated by a small number of large holders (whales) or more evenly distributed among a broader user base.
Based on the current data, OGN exhibits a notably concentrated holding structure. The top address controls 695,798.02K tokens, representing 49.35% of the total supply, while the second-largest holder possesses 174,982.42K tokens (12.41%). Combined, the top two addresses account for over 61% of total circulation, indicating significant centralization. The top five addresses collectively hold approximately 69.13% of tokens, with the remaining 30.87% distributed among all other addresses. This concentration pattern suggests that a small number of entities maintain substantial influence over the token's supply.
Such high concentration levels present notable implications for market dynamics. When major holders control nearly half of the circulating supply, price volatility can increase substantially as large-scale transactions by these entities may trigger significant market movements. Additionally, this concentration structure potentially exposes the asset to manipulation risks, as coordinated actions by top holders could artificially influence price discovery mechanisms. The relatively limited distribution among smaller holders also indicates lower retail participation, which may impact liquidity depth and market resilience during periods of heightened trading activity.
View current OGN Holdings Distribution
| Top |
Address |
Holding Qty |
Holding (%) |
| 1 |
0x6389...e45c57 |
695798.02K |
49.35% |
| 2 |
0xf977...41acec |
174982.42K |
12.41% |
| 3 |
0x29e7...ab57bd |
58421.52K |
4.14% |
| 4 |
0x6890...269ff3 |
25549.88K |
1.81% |
| 5 |
0x95c3...f4da6d |
20126.54K |
1.42% |
| - |
Others |
434786.47K |
30.87% |
II. Core Factors Influencing OGN's Future Price
Based on the available information, there is insufficient data to provide a comprehensive analysis of the core factors that may influence OGN's future price trajectory. The factors that typically impact cryptocurrency valuations include supply mechanisms, institutional dynamics, macroeconomic conditions, and technical developments. However, specific details regarding Origin Protocol's current supply changes, institutional holdings, enterprise adoption patterns, and recent technical upgrades are not available in the provided materials.
For investors seeking to understand OGN's price dynamics, it would be advisable to monitor official announcements from the Origin Protocol team, track on-chain metrics through blockchain explorers, and stay informed about broader cryptocurrency market trends that may affect mid-cap tokens in the DeFi and NFT sectors.
III. 2026-2031 OGN Price Prediction
2026 Outlook
- Conservative forecast: $0.02004 - $0.02500
- Neutral forecast: $0.02500 - $0.03036
- Optimistic forecast: $0.03036 - $0.03188 (requires favorable market sentiment and sustained trading volume)
2027-2029 Outlook
- Market phase expectation: The token may experience moderate volatility with gradual recovery trends, potentially entering a consolidation phase as the broader crypto market matures.
- Price range forecast:
- 2027: $0.01929 - $0.04045
- 2028: $0.02111 - $0.03758
- 2029: $0.02898 - $0.05062
- Key catalysts: Ecosystem development progress, platform adoption metrics, strategic partnerships, and overall crypto market sentiment recovery could serve as primary drivers for price movement.
2030-2031 Long-term Outlook
- Baseline scenario: $0.03012 - $0.04365 (assuming steady ecosystem growth and stable market conditions)
- Optimistic scenario: $0.04365 - $0.05194 (contingent on accelerated platform adoption and enhanced utility implementation)
- Transformational scenario: $0.05194 - $0.05736 (requires significant breakthrough in decentralized commerce adoption and sustained bullish crypto market cycle)
- 2026-01-23: OGN trading around baseline levels as market participants evaluate long-term growth trajectory
| Year |
Predicted High Price |
Predicted Average Price |
Predicted Low Price |
Price Change |
| 2026 |
0.03188 |
0.03036 |
0.02004 |
0 |
| 2027 |
0.04045 |
0.03112 |
0.01929 |
2 |
| 2028 |
0.03758 |
0.03579 |
0.02111 |
17 |
| 2029 |
0.05062 |
0.03668 |
0.02898 |
20 |
| 2030 |
0.05194 |
0.04365 |
0.03012 |
43 |
| 2031 |
0.05736 |
0.0478 |
0.03776 |
57 |
IV. OGN Professional Investment Strategies and Risk Management
OGN Investment Methodology
(I) Long-term Holding Strategy
- Target Audience: DeFi enthusiasts and institutional investors seeking exposure to yield-generating protocols with governance participation
- Operational Recommendations:
- Stake OGN for xOGN to earn protocol fees from Origin's yield products while maintaining governance rights
- Consider locking periods between 1 month to 1 year based on liquidity needs, as longer lock-ups generate more xOGN
- Monitor Origin DAO proposals to stay informed about treasury allocations and protocol developments
- Storage Solution: Gate Web3 Wallet supports secure storage of OGN tokens with user-controlled private keys
(II) Active Trading Strategy
- Technical Analysis Tools:
- Moving Average Convergence Divergence (MACD): Use to identify momentum shifts in OGN price movements, particularly effective during periods of increased trading volume
- Relative Strength Index (RSI): Monitor overbought (above 70) and oversold (below 30) conditions to time entry and exit points
- Swing Trading Key Points:
- Track correlations between OGN price movements and broader DeFi sector performance indicators
- Monitor 24-hour trading volume changes as volume increases may signal potential price movements
OGN Risk Management Framework
(I) Asset Allocation Principles
- Conservative Investors: 2-3% of cryptocurrency portfolio allocation
- Aggressive Investors: 5-8% of cryptocurrency portfolio allocation
- Professional Investors: Up to 10-15% with active management and diversification across DeFi protocols
(II) Risk Hedging Solutions
- Portfolio Diversification: Allocate across multiple DeFi governance tokens to reduce protocol-specific risks
- Partial Position Taking: Enter positions gradually during different market conditions rather than investing lump sums
(III) Secure Storage Solutions
- Hot Wallet Recommendation: Gate Web3 Wallet provides convenient access for active traders while maintaining security protocols
- Cold Storage Solution: Consider hardware wallets for long-term holdings exceeding personal risk tolerance thresholds
- Security Precautions: Never share private keys, enable two-factor authentication, verify contract addresses before transactions, and be cautious of phishing attempts
V. OGN Potential Risks and Challenges
OGN Market Risks
- Price Volatility: OGN has experienced significant price fluctuations, with a 1-year price change of -69.52%, indicating substantial volatility that may result in material losses
- Liquidity Concerns: With a 24-hour trading volume of approximately 83,665 USD and market capitalization around 20 million USD, liquidity may be limited during periods of market stress
- Market Capitalization Positioning: Ranked at 874 with a market dominance of 0.0013%, OGN faces competition from larger DeFi protocols with greater resources
OGN Regulatory Risks
- DeFi Regulatory Uncertainty: Evolving global regulatory frameworks for decentralized finance protocols may impact Origin Protocol's operations and OGN's utility
- Securities Classification Risk: Potential classification of governance tokens as securities in various jurisdictions could affect trading availability and compliance requirements
- Cross-border Compliance: Origin's multichain operations may face varying regulatory requirements across different jurisdictions
OGN Technical Risks
- Smart Contract Vulnerabilities: Despite being one of Ethereum's longest-standing DeFi projects, smart contracts remain susceptible to exploits and unexpected interactions
- Protocol Dependency: OGN's value proposition relies on the continued success and security of Origin's yield-generating products
- Network Congestion: As an Ethereum-based token, OGN transactions may experience delays and elevated fees during periods of network congestion
VI. Conclusion and Action Recommendations
OGN Investment Value Assessment
Origin Protocol presents a comprehensive DeFi ecosystem combining governance, staking rewards, and yield generation across multichain environments. The token's staking mechanism through xOGN provides economic incentives aligned with protocol performance. However, the substantial price decline of 69.52% over the past year and relatively modest market capitalization suggest investors should carefully evaluate risk tolerance. Long-term value may depend on Origin's ability to maintain competitive yield products and expand its user base in an increasingly crowded DeFi landscape. Short-term risks include continued price volatility and market sentiment fluctuations affecting smaller-cap tokens.
OGN Investment Recommendations
✅ Beginners: Start with small allocations (1-2% of crypto portfolio) to understand staking mechanics and governance participation before increasing exposure. Consider educational resources about DeFi protocols before committing funds.
✅ Experienced Investors: Evaluate OGN within a diversified DeFi portfolio, considering the staking rewards and governance rights as additional value propositions beyond price appreciation. Monitor Origin DAO proposals and protocol developments.
✅ Institutional Investors: Conduct thorough due diligence on Origin Protocol's smart contract audits, team credentials, and competitive positioning. Consider OGN as part of a broader thesis on yield aggregation and DeFi governance tokens.
OGN Trading Participation Methods
- Spot Trading: Purchase OGN directly on Gate.com and other exchanges supporting the token for straightforward exposure
- Staking for Rewards: Lock OGN tokens for 1 month to 1 year periods to receive xOGN and participate in protocol fee distributions
- Governance Participation: Stake OGN to gain voting rights in Origin DAO, influencing protocol direction and treasury allocations
Cryptocurrency investment carries extreme risks. This article does not constitute investment advice. Investors should make prudent decisions based on their risk tolerance and are advised to consult professional financial advisors. Never invest more than you can afford to lose.
FAQ
What are the historical highest and lowest prices of OGN tokens?
OGN reached its all-time high of approximately $2.17 in May 2021, while its all-time low stands near $0.064 in March 2020. These price points reflect OGN's market evolution over its trading history.
How much is OGN price predicted to reach in 2024?
Based on market analysis, OGN was projected to reach $0.50-$1.20 in 2024, depending on network adoption and market conditions. However, actual performance varied based on ecosystem development and broader crypto market trends.
What are the main factors affecting OGN price?
OGN price is primarily influenced by market demand and adoption rates, overall crypto market sentiment, trading volume and liquidity, network activity and development progress, and macroeconomic factors affecting the broader digital asset market.
How does OGN compare to other DeFi tokens in terms of investment prospects?
OGN demonstrates strong fundamentals with its origin protocol ecosystem, growing transaction volume, and expanding utility. Compared to other DeFi tokens, OGN offers unique value through its decentralized commerce platform and increasing adoption, positioning it favorably for long-term growth potential.
How will Origin Protocol's development progress affect OGN price?
Origin Protocol's development milestones drive OGN adoption and utility. Major upgrades, partnerships, and ecosystem expansion typically boost investor confidence and increase transaction volume, which can positively influence OGN price performance in the market.
Is OGN suitable for long-term holding or short-term trading?
OGN is well-suited for long-term holding. With strong fundamentals and growing adoption in the Origin ecosystem, holding OGN allows investors to benefit from potential appreciation and staking rewards over time, making it ideal for patient investors seeking sustained growth.
* The information is not intended to be and does not constitute financial advice or any other recommendation of any sort offered or endorsed by Gate.