This comprehensive article analyzes Open Loot (OL) token's price trajectory from 2026 to 2031, offering professional forecasts for Web3 gaming infrastructure investors. Currently trading at $0.01577 with a market cap of $3.18 million, OL presents both significant opportunities and risks in the emerging gaming blockchain sector. The article examines historical price evolution, market sentiment (currently at extreme fear levels), and supply mechanisms influencing OL's valuation dynamics. Price forecasts range from $0.01094-$0.01922 in 2026 to potentially $0.03355 by 2031 under favorable conditions, representing 54% cumulative growth. The guide provides actionable investment strategies including dollar-cost averaging on Gate, technical analysis methods, and comprehensive risk management frameworks across conservative to institutional investor profiles. Key catalysts include ecosystem expansion, developer adoption, and strategic partnerships, while major risks encompass high volatility (83.91% annual decline), li
Introduction: OL's Market Position and Investment Value
Open Loot (OL), as a Web3 gaming distribution platform and marketplace designed to support game developers and publishers with go-to-market strategies, distribution, user experience, and payment solutions, has been active in the crypto market since its launch in November 2024. As of 2026, OL maintains a market capitalization of approximately $3.18 million, with a circulating supply of about 201.37 million tokens, and the price hovering around $0.01577. This asset, positioned as a "Web3 gaming infrastructure token," is playing an increasingly important role in bridging traditional gaming with blockchain technology.
This article will comprehensively analyze OL's price trends from 2026 to 2031, combining historical patterns, market supply and demand dynamics, ecosystem development, and macroeconomic conditions to provide investors with professional price forecasts and practical investment strategies.
I. OL Price History Review and Market Status
OL Historical Price Evolution Trajectory
- 2024: Open Loot (OL) launched on Gate.com in November with an initial offering price of $0.01, marking its entry into the Web3 gaming distribution market.
- December 2024: OL reached its all-time high of $0.69 on December 5, 2024, representing a significant surge from its launch price.
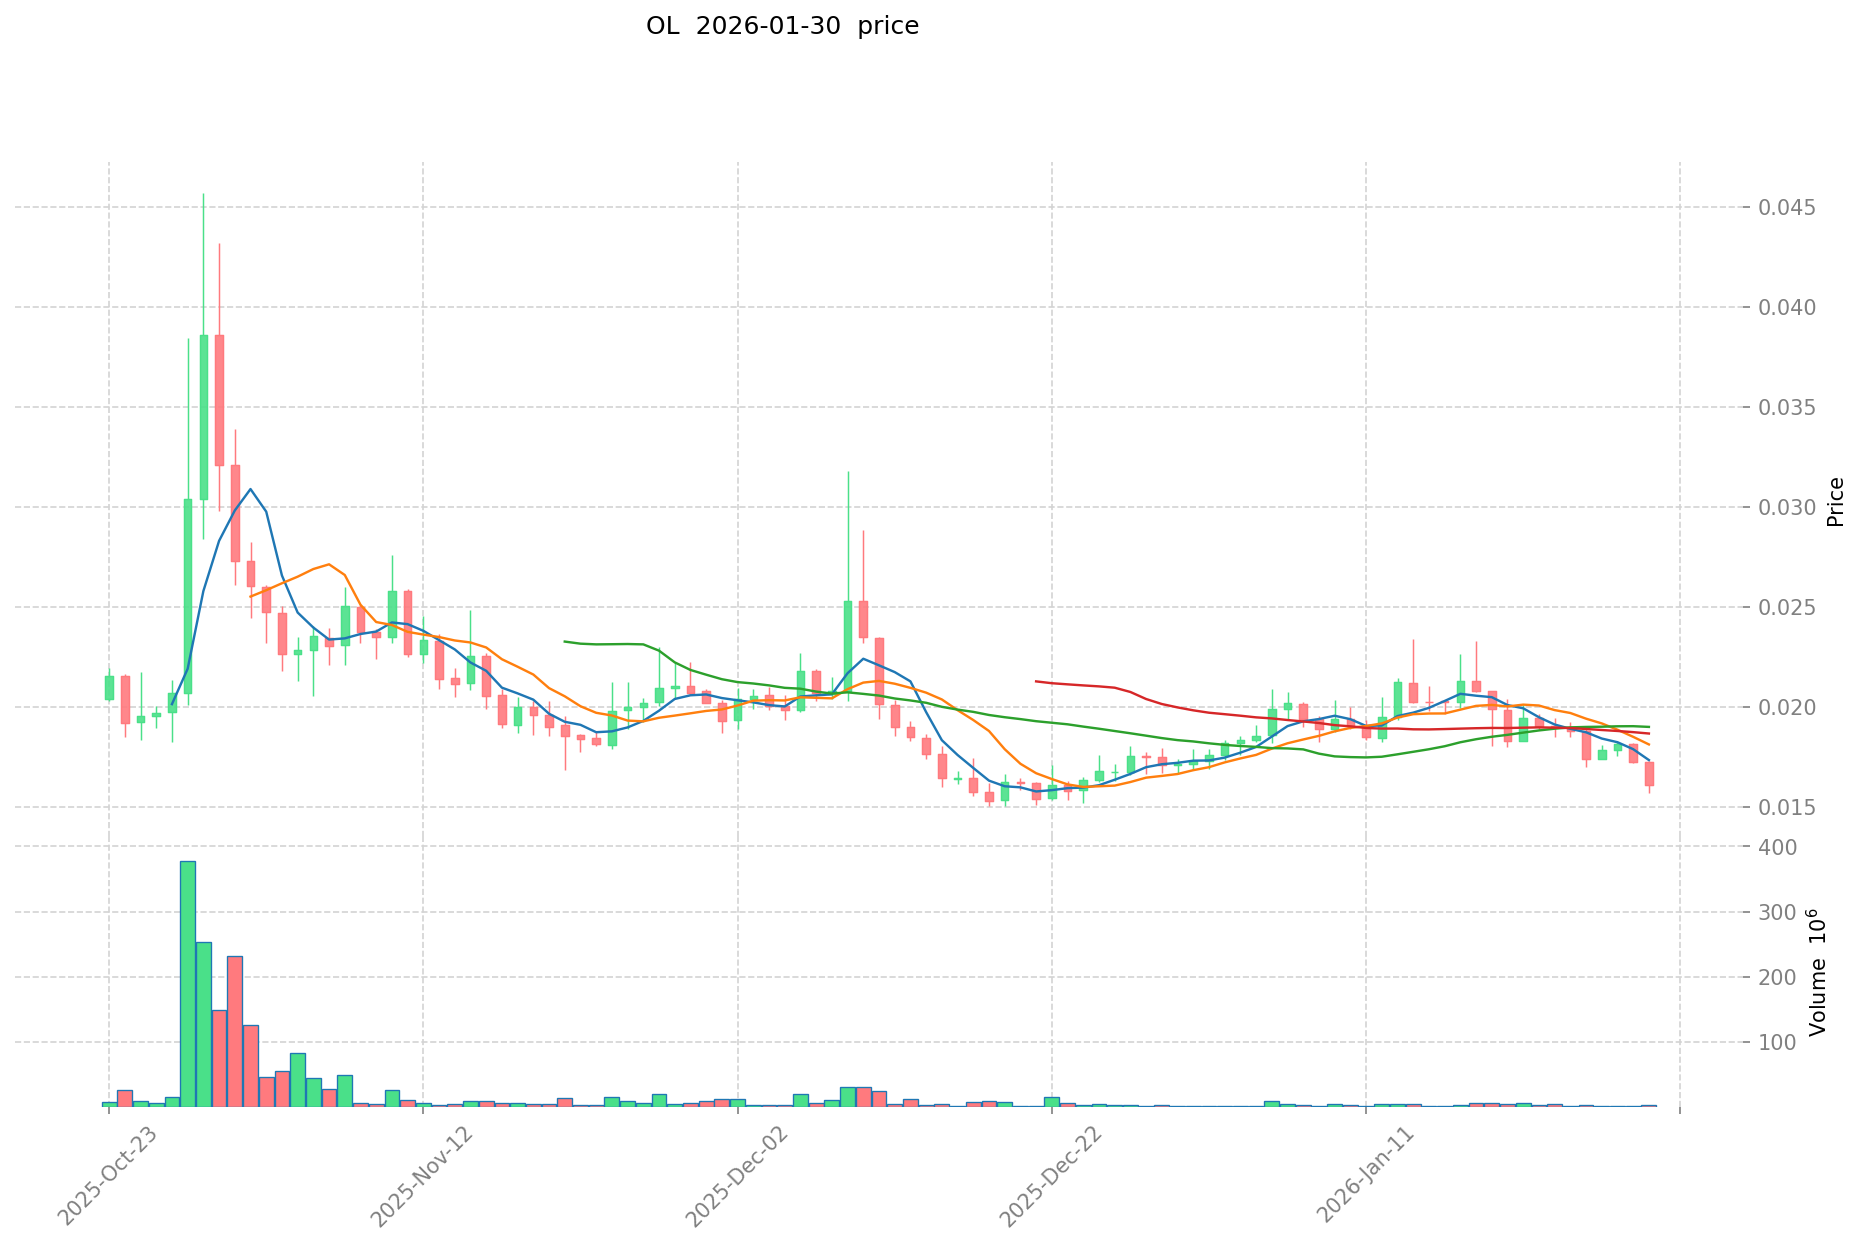
- 2025: The token experienced substantial volatility, eventually declining to its all-time low of $0.00274 on October 10, 2025, reflecting broader market corrections in the Web3 gaming sector.
OL Current Market Situation
As of January 31, 2026, OL is trading at $0.01577, showing mixed short-term and long-term performance. The token has experienced a decline of 1.01% over the past hour and 0.44% over the past 24 hours, with a 24-hour trading range between $0.01528 and $0.01612.
Over a weekly timeframe, OL has decreased by 16.73%, while the monthly decline stands at 8.79%. The most notable metric is the one-year performance, which shows a decrease of 83.91% from its price level twelve months ago.
The current market capitalization stands at approximately $3.18 million, with a circulating supply of 201,373,461 OL tokens out of a maximum supply of 5 billion tokens, representing a circulation ratio of 4.03%. The fully diluted market cap is calculated at $78.85 million. The token's market dominance is 0.0026%, with a 24-hour trading volume of approximately $29,977.
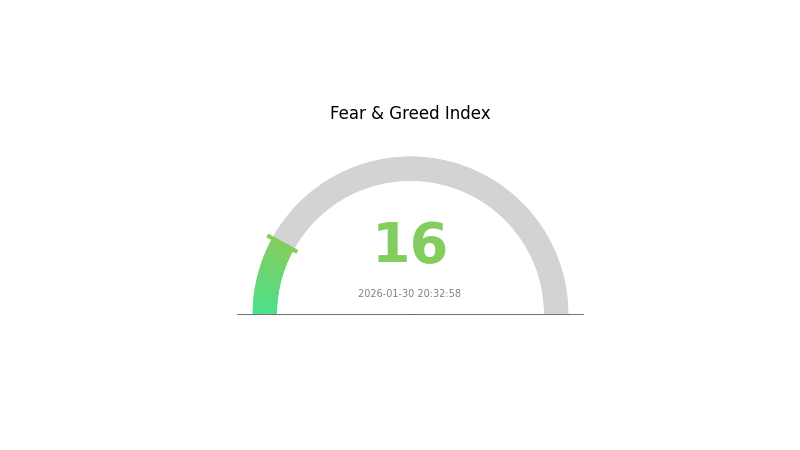
Open Loot currently has 2,397 token holders and is listed on 15 exchanges. The token operates on the Ethereum blockchain as an ERC-20 token, with the contract address verified on Etherscan. The current market sentiment index registers at 16, indicating extreme fear among market participants.
Click to view current OL market price
Market Sentiment Indicator
01-30-2026 Fear and Greed Index: 16(Extreme Fear)
Click to view current Fear & Greed Index
The cryptocurrency market is experiencing extreme fear, with the Fear and Greed Index plummeting to 16. This significant downturn reflects heightened market anxiety and risk aversion among investors. When sentiment reaches such extreme levels, it often signals potential capitulation moments that may present buying opportunities for long-term investors. Market participants should exercise caution while considering that historically, extreme fear has frequently preceded market rebounds. Monitor key support levels and maintain a balanced portfolio strategy during this volatile period.
OL Holding Distribution
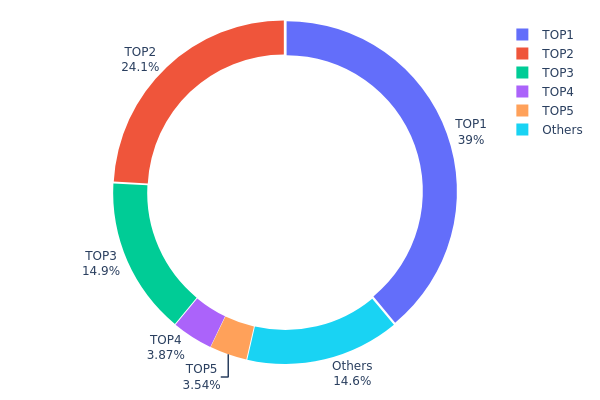
The holding distribution chart reflects the concentration of token holdings across different addresses on the blockchain, serving as a critical indicator of decentralization and market structure stability. By analyzing the distribution of tokens among major holders, we can assess potential risks related to price manipulation and evaluate the overall health of the token's on-chain ecosystem.
Current data reveals a highly concentrated holding structure for OL. The top address holds 1.95 million tokens (39.00%), while the second and third largest addresses control 24.14% and 14.85% respectively. Collectively, the top three addresses account for 77.99% of the total supply, indicating significant centralization risk. The top five addresses combined hold 85.38% of tokens, leaving only 14.62% distributed among other market participants. This extreme concentration pattern suggests that a small number of entities possess substantial control over the token's circulating supply.
Such concentrated distribution presents notable implications for market dynamics. The dominant position held by top addresses creates potential for significant price volatility, as large-scale movements by these holders could trigger substantial market reactions. Furthermore, this concentration level raises concerns regarding potential market manipulation risks and limits the token's decentralization characteristics. From a structural perspective, this distribution pattern indicates that OL's on-chain ecosystem remains in an early developmental stage, with limited broad-based adoption among diverse participants.
Click to view current OL Holding Distribution
| Top |
Address |
Holding Qty |
Holding (%) |
| 1 |
0xf3a5...5a2860 |
1950000.00K |
39.00% |
| 2 |
0xdfee...533e69 |
1207142.86K |
24.14% |
| 3 |
0x6cff...456e3d |
742857.14K |
14.85% |
| 4 |
0x4695...fd7d37 |
193474.03K |
3.86% |
| 5 |
0x3f16...9844c1 |
176833.28K |
3.53% |
| - |
Others |
729692.69K |
14.62% |
II. Core Factors Influencing OL's Future Price
Supply Mechanism
- Halving Mechanism: The OL network undergoes a halving event every four years, reducing block rewards by half. This programmed supply reduction creates scarcity over time, potentially supporting price appreciation as circulating supply growth slows.
- Historical Pattern: Supply constraints have historically contributed to price support in cryptocurrency markets. The initial issuance began at $0.01 in 2024, establishing a baseline for valuation.
- Current Impact: The next scheduled halving may influence market dynamics by reducing the rate of new token issuance, which could affect supply-demand equilibrium depending on concurrent adoption trends.
Macroeconomic Environment
- Monetary Policy Impact: Central bank interest rate policies and quantitative easing measures may influence OL's positioning as an alternative investment. Changes in traditional monetary policy can affect risk appetite and capital flows into digital assets.
- Inflation Hedge Characteristics: OL's performance may be influenced by broader economic conditions, including inflation trends and investor sentiment toward alternative stores of value.
- Geopolitical Factors: Global economic uncertainties and international developments could contribute to market volatility and investor behavior patterns affecting OL's price movements.
Technology Development and Ecosystem Building
- Technical Innovation: Ongoing technological advancements and protocol improvements may enhance network functionality and user experience, potentially supporting long-term value proposition.
- Market Trends: The broader evolution of digital fashion and virtual asset valuations could influence OL's market positioning and adoption trajectory within its target sectors.
III. 2026-2031 OL Price Forecast
2026 Outlook
- Conservative Forecast: $0.01094 - $0.01563
- Neutral Forecast: Around $0.01563
- Optimistic Forecast: Up to $0.01922 (contingent on favorable market conditions and increased adoption)
2027-2029 Outlook
- Market Stage Expectation: The token may experience a gradual growth phase with increased volatility as the market matures and adoption expands across various use cases.
- Price Range Forecast:
- 2027: $0.01377 - $0.02405, representing approximately 10% growth from 2026 baseline
- 2028: $0.01389 - $0.02489, with potential 31% increase supported by ecosystem development
- 2029: $0.01962 - $0.02350, showing approximately 44% cumulative growth trajectory
- Key Catalysts: Ecosystem expansion, technological improvements, strategic partnerships, and broader cryptocurrency market trends could serve as primary drivers for price appreciation during this period.
2030-2031 Long-term Outlook
- Baseline Scenario: $0.02153 - $0.02547 (assuming steady market conditions and continued project development)
- Optimistic Scenario: $0.02315 - $0.03355 (driven by accelerated adoption, major platform integrations, and favorable regulatory environment)
- Transformative Scenario: Potential to reach the upper range of $0.03355 by 2031 (contingent on breakthrough innovations, mass market adoption, and exceptional market conditions representing approximately 54% growth from 2026 levels)
- 2031-12-31: OL could potentially reach $0.03355 (under highly favorable market circumstances with sustained growth momentum)
| Year |
Predicted High Price |
Predicted Average Price |
Predicted Low Price |
Price Change |
| 2026 |
0.01922 |
0.01563 |
0.01094 |
0 |
| 2027 |
0.02405 |
0.01743 |
0.01377 |
10 |
| 2028 |
0.02489 |
0.02074 |
0.01389 |
31 |
| 2029 |
0.0235 |
0.02281 |
0.01962 |
44 |
| 2030 |
0.02547 |
0.02315 |
0.02153 |
46 |
| 2031 |
0.03355 |
0.02431 |
0.02018 |
54 |
IV. OL Professional Investment Strategy and Risk Management
OL Investment Methodology
(1) Long-term Holding Strategy
- Suitable for: Investors seeking exposure to Web3 gaming distribution infrastructure with moderate to high risk tolerance
- Operational Recommendations:
- Consider dollar-cost averaging to mitigate entry timing risks given OL's price volatility
- Monitor platform development progress and adoption metrics by game developers
- Storage Solution: Use Gate Web3 Wallet for secure OL token storage with multi-layer security features
(2) Active Trading Strategy
- Technical Analysis Tools:
- Moving Averages: Track 50-day and 200-day moving averages to identify potential trend reversals
- Volume Analysis: Monitor trading volume changes as OL's 24-hour volume of approximately $29,977 can signal momentum shifts
- Swing Trading Considerations:
- OL has exhibited significant volatility with a 7-day decline of 16.73% and 30-day decline of 8.79%
- Set clear stop-loss levels to manage downside risk in volatile market conditions
OL Risk Management Framework
(1) Asset Allocation Principles
- Conservative Investors: 1-2% of crypto portfolio allocation
- Aggressive Investors: 3-5% of crypto portfolio allocation
- Professional Investors: Up to 5-8% with active hedging strategies
(2) Risk Hedging Approaches
- Portfolio Diversification: Balance OL holdings with established cryptocurrencies and other gaming tokens
- Position Sizing: Limit individual position size based on OL's market cap of approximately $3.18 million and liquidity constraints
(3) Secure Storage Solutions
- Web3 Wallet Recommendation: Gate Web3 Wallet provides native support for ERC-20 tokens with enhanced security protocols
- Cold Storage Option: For larger holdings, consider hardware wallet solutions for long-term storage
- Security Precautions: Enable two-factor authentication, regularly update security settings, and verify contract addresses (0x1f57da732a77636d913c9a75d685b26cc85dcc3a on Ethereum)
V. OL Potential Risks and Challenges
OL Market Risks
- High Volatility: OL has experienced an 83.91% decline over one year, indicating substantial price fluctuation risk
- Limited Liquidity: With a 24-hour trading volume of approximately $29,977, large orders may face execution challenges
- Low Circulation Rate: Only 4.03% of total supply is currently circulating, creating potential dilution risk as more tokens enter the market
OL Regulatory Risks
- Gaming Token Classification: Evolving regulatory frameworks for gaming and NFT-related tokens may impact OL's operational landscape
- Cross-border Compliance: As a Web3 gaming platform, OL may face varying regulatory requirements across different jurisdictions
- Payment Processing Regulations: Changes in regulations governing cryptocurrency payments in gaming could affect platform utility
OL Technical Risks
- Smart Contract Vulnerabilities: As an ERC-20 token, OL is subject to potential smart contract exploits or coding errors
- Platform Adoption Risk: Success depends on attracting game developers and publishers to the Open Loot ecosystem
- Blockchain Dependency: Technical issues or congestion on the Ethereum network could impact OL token transactions and usability
VI. Conclusion and Action Recommendations
OL Investment Value Assessment
Open Loot (OL) represents a specialized play in the Web3 gaming distribution sector, offering exposure to the convergence of blockchain technology and gaming. The platform's value proposition centers on providing infrastructure for game developers and publishers. However, investors should note significant short-term headwinds, including substantial price declines across multiple timeframes (16.73% over 7 days, 83.91% over one year) and limited market liquidity. The low circulation rate of 4.03% presents both opportunity and dilution risk. While the Web3 gaming sector shows long-term potential, OL's current market position suggests elevated risk levels.
OL Investment Recommendations
✅ Beginners: Limit exposure to micro-allocation (under 1% of crypto portfolio) and focus on established cryptocurrencies first; use Gate Web3 Wallet for secure storage and familiarize yourself with the project through official channels
✅ Experienced Investors: Consider small tactical positions (2-3% allocation) with strict risk management protocols; monitor platform development milestones and developer adoption metrics closely
✅ Institutional Investors: Conduct comprehensive due diligence on platform partnerships and growth metrics; implement hedging strategies and maintain flexibility for position adjustments based on ecosystem development
OL Trading Participation Methods
- Spot Trading: Purchase OL tokens directly on Gate.com with support for multiple trading pairs
- Gradual Accumulation: Employ dollar-cost averaging strategy to build positions over time, reducing timing risk
- Active Monitoring: Track OL's listing across 15 exchanges and follow project developments through official website (openloot.com) and verified communication channels
Cryptocurrency investment carries extremely high risks, and this article does not constitute investment advice. Investors should make prudent decisions based on their own risk tolerance and are advised to consult professional financial advisors. Never invest more than you can afford to lose.
FAQ
What are the main factors affecting crude oil price predictions?
Crude oil prices are primarily influenced by global economic growth, demand fluctuations, supply dynamics, geopolitical tensions, alternative energy development, and trading volume. These factors collectively determine price movements and market trends.
How to use technical analysis methods to predict crude oil price trends?
Use moving average crossovers and MACD indicators to identify price trends. Monitor support and resistance levels, RSI for overbought/oversold conditions, and trading volume patterns to forecast crude oil price movements effectively.
How do geopolitical events impact crude oil price predictions?
Geopolitical events cause short-term oil price volatility and supply disruptions. However, long-term predictions depend more on supply-demand dynamics. Conflicts may spike prices temporarily, but oversupply and weak demand fundamentals ultimately drive sustained price trends.
Common crude oil price prediction tools include traditional econometric models like exponential smoothing and ARIMA, as well as machine learning methods such as random forests and neural networks. These tools analyze market trends, technical indicators, and fundamental factors to forecast price movements.
How to predict future crude oil price trends based on supply and demand relationships?
Crude oil prices are primarily determined by global supply and demand dynamics. Increased demand or reduced supply typically drives prices higher, while the opposite lowers them. Inventory levels and market sentiment also influence predictions. Historical data and analytical models help identify trend patterns and support forecasting accuracy.
How to assess the accuracy and risk of crude oil price predictions?
Crude oil price prediction accuracy relies on fundamental analysis, technical indicators, and market sentiment evaluation. Risk assessment depends on supply-demand dynamics and global economic conditions. Prediction reliability varies with market volatility and geopolitical factors affecting energy markets.
* The information is not intended to be and does not constitute financial advice or any other recommendation of any sort offered or endorsed by Gate.