This comprehensive analysis examines ECOMI (OMI) token's price dynamics from 2026 to 2031, offering expert forecasts and investment guidance. Currently trading at $0.00017155 with a market cap of $46.48 million, OMI maintains moderate decentralization with 53.85% holdings distributed among smaller addresses. The article reviews historical price evolution—from 2019's all-time low to 2021's peak at $0.01343572—and projects conservative 2026 estimates of $0.00016-$0.00017, with potential growth reaching $0.00046 by 2031 under transformative scenarios. Key drivers include ecosystem expansion, regulatory clarity, and user adoption within digital collectibles. The analysis provides asset allocation guidelines (1-10% cryptocurrency portfolio), technical trading strategies using moving averages and RSI, and comprehensive risk management frameworks. Critical risks include high volatility, limited liquidity on Gate exchange, and evolving NFT regulations. Suitable for investors with moderate-to-high risk tolerance seeki
Introduction: OMI's Market Position and Investment Value
ECOMI (OMI), positioned as a digital collectibles platform token, has been developing since its inception in 2017. As of January 2026, OMI maintains a market capitalization of approximately $46.48 million, with a circulating supply of around 270.95 billion tokens, and the price hovering around $0.00017155. This asset, recognized for its role in the licensed digital collectibles space, is playing an increasingly important part in bridging traditional intellectual property with blockchain technology.
This article will comprehensively analyze OMI's price trajectory from 2026 to 2031, combining historical patterns, market supply and demand dynamics, ecosystem developments, and macroeconomic conditions to provide investors with professional price forecasts and practical investment strategies.
I. OMI Price History Review and Market Status
OMI Historical Price Evolution Trajectory
- 2019: The token recorded its all-time low price at $0.00000337 on November 4, with the project in its early development phase.
- 2021: OMI reached its historical peak at $0.01343572 on March 20, representing substantial growth during the broader cryptocurrency market expansion period.
- 2022-2026: The token experienced a prolonged correction phase, with price declining from previous highs and entering a consolidation period.
OMI Current Market Status
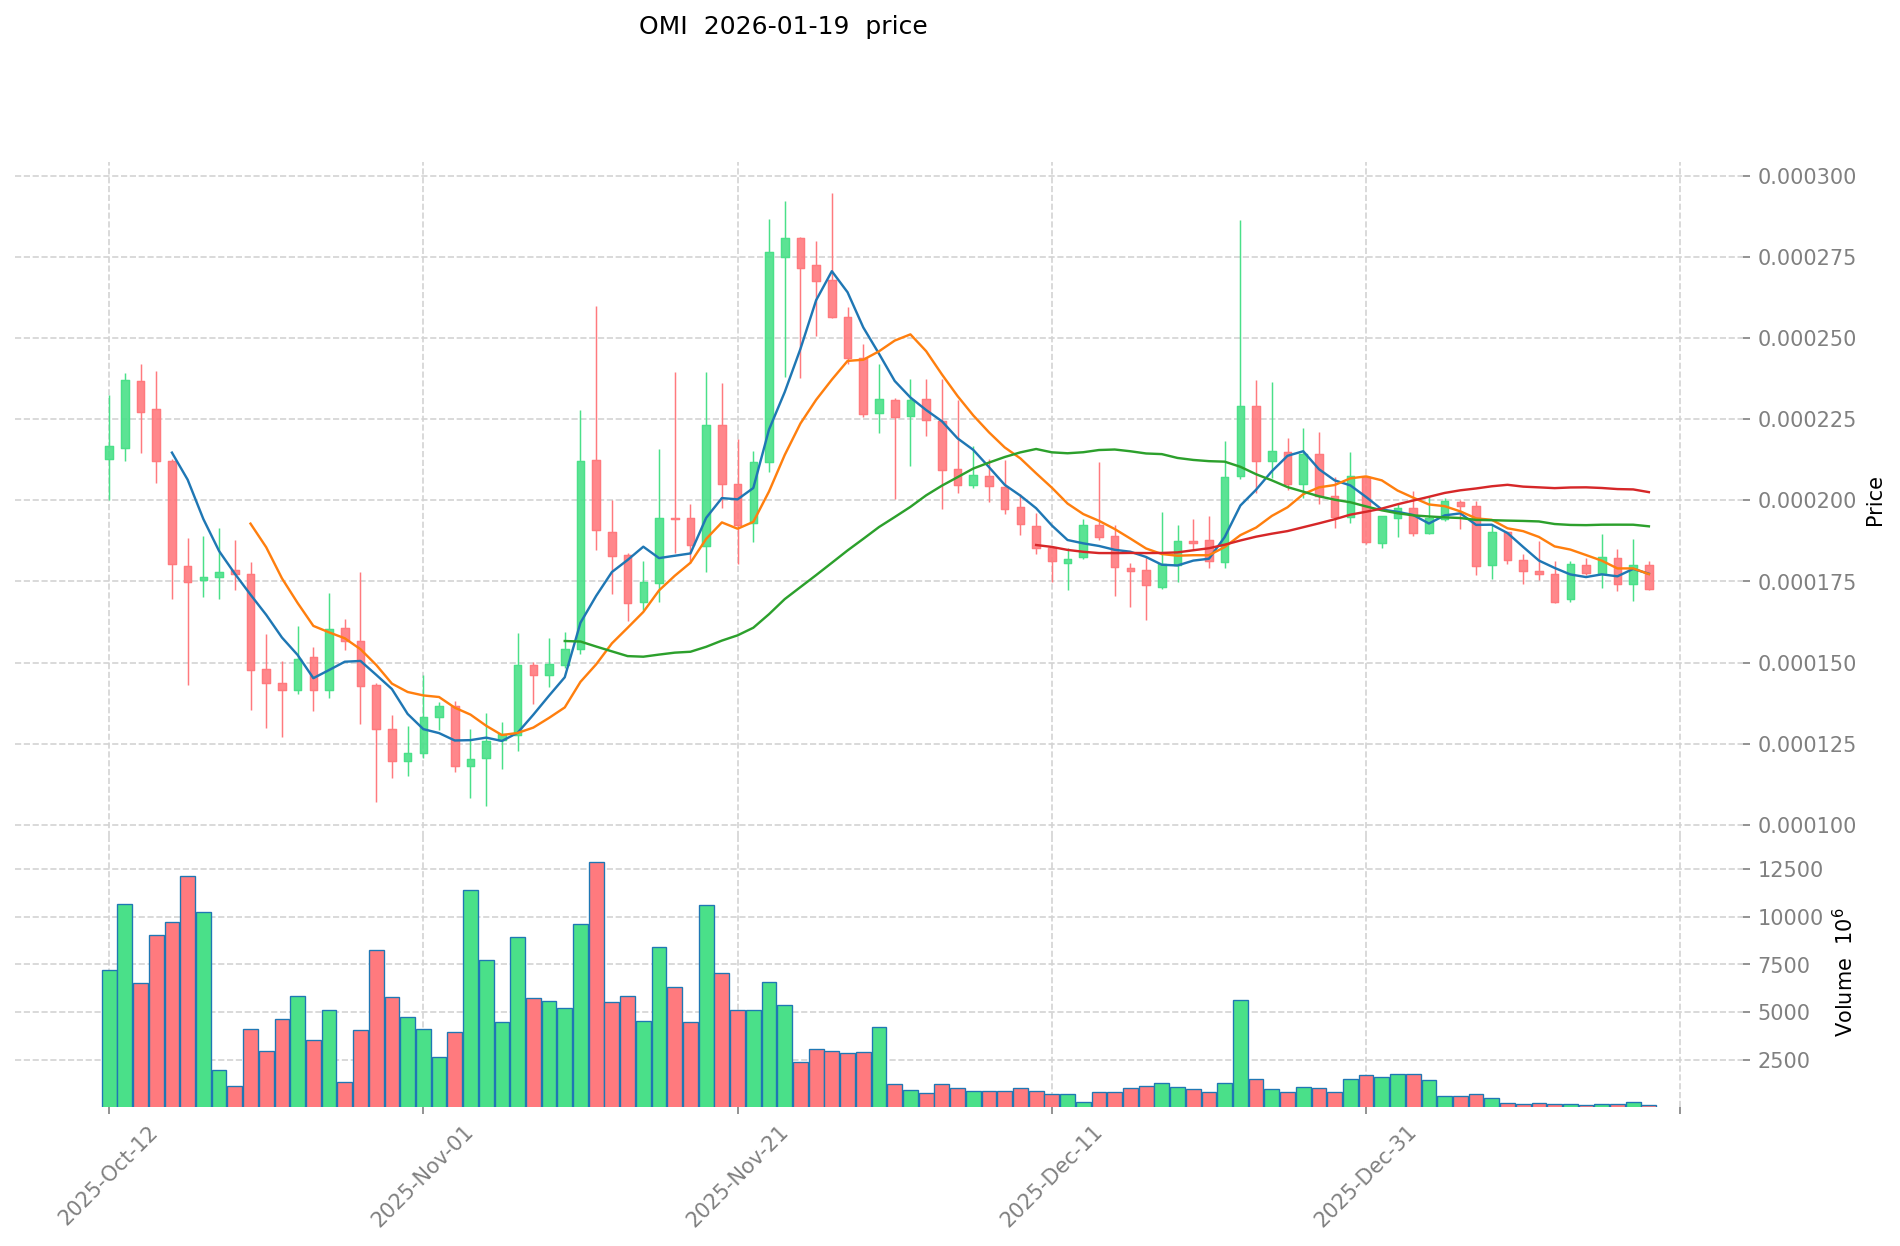
As of January 19, 2026, OMI is trading at $0.00017155, showing a 24-hour decrease of 3.12%. The token's intraday trading range spans from a low of $0.00016854 to a high of $0.00017873.
The market capitalization stands at approximately $46.48 million, with a circulating supply of 270.95 billion OMI tokens, representing 36.13% of the total supply of 310.88 billion tokens. The fully diluted market cap reaches $53.33 million. Currently, OMI holds the 548th position in the cryptocurrency market rankings, with a market dominance of 0.0016%.
The 24-hour trading volume records $21,262.39, with the token listed on 7 exchanges and maintained by 26,695 holders. Recent price trends indicate a 0.98% increase over the past hour, while the 7-day performance shows a 2.76% decline. The 30-day period reflects a 9.47% decrease, and the annual performance demonstrates a 49.98% reduction.
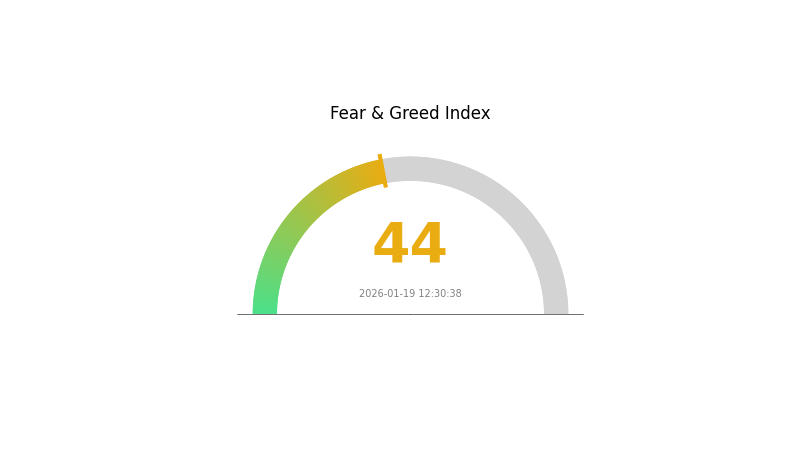
The current trading price remains significantly below the all-time high of $0.01343572, indicating the token is trading at approximately 98.7% below its historical peak. The Fear and Greed Index currently registers at 44, indicating a "Fear" sentiment in the broader market environment.
Click to view the current OMI market price
OMI Market Sentiment Index
2026-01-19 Fear and Greed Index: 44 (Fear)
Click to view current Fear & Greed Index
The crypto market is currently experiencing fear sentiment with an OMI reading of 44. This moderate fear level suggests investors are cautious and risk-averse. Market participants may be concerned about potential downside risks or negative developments. During such periods, experienced traders often look for accumulation opportunities, while conservative investors might adopt a wait-and-see approach. The fear index indicates heightened uncertainty, making it crucial to conduct thorough research before making investment decisions on Gate.com.
OMI 持仓分布
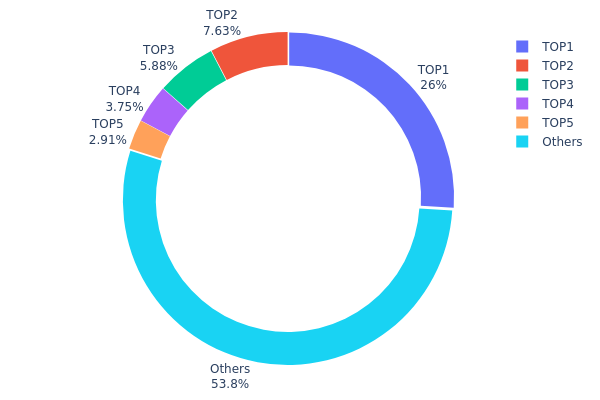
The holding distribution chart illustrates the allocation of OMI tokens across different wallet addresses, providing crucial insights into the token's decentralization level and potential concentration risks. This metric reveals how token supply is distributed among top holders versus the broader community, which significantly impacts market stability and price dynamics.
Based on current data, OMI exhibits a moderately concentrated holding structure. The top address controls approximately 25.99% of total supply (52.32 billion tokens), while the top five addresses collectively hold 46.15% of the circulating supply. Notably, the "Others" category represents 53.85% of holdings, indicating that more than half of the token supply is distributed among smaller addresses. This distribution pattern suggests a balanced structure where neither extreme concentration nor complete fragmentation dominates.
The current holding distribution presents both opportunities and risks for market participants. The presence of a dominant holder controlling over a quarter of supply introduces potential volatility risks, as significant sell pressure could materialize if this address initiates large-scale liquidations. However, the fact that majority holdings (53.85%) remain distributed among numerous smaller addresses provides a cushion against single-entity market manipulation. This structure indicates moderate decentralization with adequate community participation, though investors should remain cognizant of the influence wielded by top-tier holders during critical market movements.
Click to view current OMI Holding Distribution
| Top |
Address |
Holding Qty |
Holding (%) |
| 1 |
0x3154...0f2c35 |
52316542.98K |
25.99% |
| 2 |
0x38ba...00d26a |
15355845.72K |
7.63% |
| 3 |
0x704d...59b669 |
11826667.27K |
5.87% |
| 4 |
0x5fdc...8e27e9 |
7546829.24K |
3.75% |
| 5 |
0xc215...94b1eb |
5858000.00K |
2.91% |
| - |
Others |
108333122.16K |
53.85% |
II. Core Factors Influencing OMI's Future Price
Market Sentiment and News
The cryptocurrency market demonstrates high sensitivity to sentiment shifts. Market sentiment and related news coverage can significantly impact OMI's price trajectory. Positive developments, partnerships, or technological advancements tend to generate upward momentum, while negative news or uncertainty can trigger price corrections.
Regulatory Environment
Government regulations and legal clarity play a crucial role in shaping OMI's market dynamics. The regulatory environment in major cryptocurrency markets is particularly important for price stability and investor confidence. Clear and favorable regulatory frameworks tend to support long-term price appreciation, while regulatory uncertainty may introduce volatility.
Partnership Growth and User Adoption
OMI's future price potential depends substantially on continuous partnership expansion and user base growth. Strategic collaborations with established platforms and enterprises can enhance utility and demand. Increasing user adoption rates directly correlate with network effects, potentially driving sustainable price appreciation over time.
Technical and Ecosystem Development
- Platform Upgrades: Technological improvements and protocol enhancements can strengthen network functionality and security, contributing to improved market perception.
- Ecosystem Expansion: The development of applications and use cases within the OMI ecosystem influences practical utility and demand dynamics.
Market Events and Catalysts
Significant market events such as major platform listings on cryptocurrency exchanges, institutional adoption announcements, and broader market trends can trigger substantial price movements. These catalysts often create short-term volatility while potentially establishing new price ranges for sustained periods.
III. 2026-2031 OMI Price Prediction
2026 Outlook
- Conservative Prediction: $0.00016 - $0.00017
- Neutral Prediction: $0.00017
- Optimistic Prediction: $0.00021 (requires favorable market conditions and increased adoption)
2027-2029 Outlook
- Market Stage Expectation: The token may enter a gradual growth phase as the broader crypto market matures and potential platform developments emerge
- Price Range Predictions:
- 2027: $0.00014 - $0.00028
- 2028: $0.00019 - $0.00029
- 2029: $0.00023 - $0.00036
- Key Catalysts: Potential ecosystem expansion, increased user engagement, and overall crypto market sentiment recovery could serve as primary drivers
2030-2031 Long-term Outlook
- Base Scenario: $0.00026 - $0.00031 (assuming steady market development and moderate adoption)
- Optimistic Scenario: $0.00035 - $0.00040 (assuming strong platform growth and favorable regulatory environment)
- Transformative Scenario: $0.00046 (requires exceptional market conditions, widespread adoption, and significant technological breakthroughs)
- 2026-01-19: OMI showing relatively stable pricing with potential for gradual appreciation over the forecast period
| Year |
Predicted High Price |
Predicted Average Price |
Predicted Low Price |
Price Change |
| 2026 |
0.00021 |
0.00017 |
0.00016 |
0 |
| 2027 |
0.00028 |
0.00019 |
0.00014 |
10 |
| 2028 |
0.00029 |
0.00024 |
0.00019 |
37 |
| 2029 |
0.00036 |
0.00026 |
0.00023 |
53 |
| 2030 |
0.0004 |
0.00031 |
0.00026 |
82 |
| 2031 |
0.00046 |
0.00035 |
0.00018 |
106 |
IV. OMI Professional Investment Strategy and Risk Management
OMI Investment Methodology
(I) Long-term Holding Strategy
- Suitable for: Investors seeking exposure to the digital collectibles and NFT sector with moderate to high risk tolerance
- Operational Recommendations:
- Consider accumulating positions during market corrections when OMI trades below key support levels
- Monitor ECOMI's partnership announcements and Collect app user growth metrics as fundamental indicators
- Implement a secure storage solution using Gate Web3 Wallet or hardware wallet options to safeguard long-term holdings
(II) Active Trading Strategy
- Technical Analysis Tools:
- Moving Averages: Use 50-day and 200-day moving averages to identify trend directions; crossovers may signal potential entry or exit points
- Relative Strength Index (RSI): Monitor RSI levels to identify overbought (above 70) or oversold (below 30) conditions for tactical positioning
- Swing Trading Key Points:
- Track OMI's 24-hour trading range (currently $0.00016854 - $0.00017873) to identify support and resistance zones
- Monitor volume fluctuations; significant volume spikes may indicate increased market interest or distribution
OMI Risk Management Framework
(I) Asset Allocation Principles
- Conservative Investors: 1-3% of cryptocurrency portfolio
- Moderate Investors: 3-5% of cryptocurrency portfolio
- Aggressive Investors: 5-10% of cryptocurrency portfolio
(II) Risk Hedging Solutions
- Diversification Strategy: Balance OMI holdings with more established cryptocurrencies and stablecoin positions to reduce portfolio volatility
- Stop-Loss Implementation: Set automated stop-loss orders at 10-15% below entry points to limit potential downside exposure
(III) Secure Storage Solutions
- Hot Wallet Recommendation: Gate Web3 Wallet offers convenient access for active trading while maintaining robust security features
- Cold Storage Solution: For long-term holdings, consider hardware wallet storage with proper backup and recovery procedures
- Security Considerations: Never share private keys, enable two-factor authentication, and be vigilant against phishing attempts and fraudulent websites
V. OMI Potential Risks and Challenges
OMI Market Risks
- High Volatility: OMI has experienced substantial price fluctuations, with a 1-year decline of approximately 49.98%, indicating significant market volatility
- Limited Liquidity: With a 24-hour trading volume of approximately $21,262 and listing on 7 exchanges, OMI may experience liquidity constraints during periods of market stress
- Market Cap Positioning: Ranked #548 by market capitalization with 0.0016% market dominance, OMI faces strong competition from larger digital asset projects
OMI Regulatory Risks
- NFT Regulatory Uncertainty: The evolving regulatory landscape for digital collectibles and NFTs may impact ECOMI's business model and OMI token utility
- Cross-Border Compliance: ECOMI's licensed collectibles business may face varying regulatory requirements across different jurisdictions
- Securities Classification Risk: Potential regulatory classification changes could affect OMI's trading status and accessibility on certain platforms
OMI Technical Risks
- Smart Contract Vulnerabilities: As an ERC-20 token on Ethereum, OMI is subject to potential smart contract risks and network-specific vulnerabilities
- Platform Dependency: OMI's utility is closely tied to the ECOMI Collect app; any technical issues or user adoption challenges with the platform could impact token demand
- Network Congestion: Ethereum network congestion and high gas fees may affect transaction efficiency and user experience during peak periods
VI. Conclusion and Action Recommendations
OMI Investment Value Assessment
OMI represents exposure to the digital collectibles and licensed NFT sector through the ECOMI ecosystem. With a current circulating supply of approximately 270.95 billion tokens (36.13% of total supply) and market capitalization of $46.48 million, the project operates in the growing digital collectibles space. However, the token has experienced considerable price pressure, declining from its historical high of $0.01343572 (March 2021) to current levels around $0.00017155. Investors should carefully weigh the potential upside from NFT market growth and ECOMI's licensed partnerships against the demonstrated volatility and limited liquidity currently present in the token's trading profile.
OMI Investment Recommendations
✅ Beginners: Start with minimal allocation (1-2% of crypto portfolio) and prioritize education about NFT markets and digital collectibles before increasing exposure. Use dollar-cost averaging to build positions gradually.
✅ Experienced Investors: Consider OMI as a speculative position within a diversified NFT/gaming sector allocation. Monitor ECOMI's user metrics, partnership announcements, and broader NFT market trends to inform position sizing decisions.
✅ Institutional Investors: Conduct thorough due diligence on ECOMI's business model, licensing agreements, and competitive positioning. Evaluate OMI within broader digital assets and NFT sector exposure strategies, with appropriate risk management protocols.
OMI Trading Participation Methods
- Spot Trading on Gate.com: Direct purchase and sale of OMI tokens through Gate.com's trading platform with access to various trading pairs and order types
- Gate Web3 Wallet Integration: Utilize Gate Web3 Wallet for secure self-custody while maintaining easy access to trading opportunities
- Portfolio Monitoring Tools: Leverage Gate.com's portfolio tracking features to monitor OMI performance, set price alerts, and manage overall position sizing
Cryptocurrency investment carries extremely high risks, and this article does not constitute investment advice. Investors should make prudent decisions based on their own risk tolerance and are advised to consult professional financial advisors. Never invest more than you can afford to lose.
FAQ
What is OMI coin and what are its main uses?
OMI is the native token of the ECOMI platform, designed for digital collectibles trading, virtual reality experiences, and digital asset investments. It enables seamless transactions within the Web3 ecosystem for NFT and metaverse applications.
What are the main factors affecting OMI price?
OMI price is primarily influenced by supply and demand dynamics, overall cryptocurrency market trends, trading volume, investor sentiment, and developments in the ECOMI ecosystem. Market volatility and macroeconomic factors also play significant roles.
OMI's historical price data shows volatility in the market. Based on predictive models, OMI is projected to reach $0.0002727 by 2027, with an estimated growth of +11.00% by 2032, reflecting positive long-term potential.
What risks should I pay attention to when investing in OMI coins?
OMI investment involves market volatility and technology risks. The NFT market remains immature with uncertain prospects, potentially causing significant value fluctuations. Long-term holdings require careful consideration and monitoring of market developments.
OMI's advantages include faster transaction speeds and lower transaction fees compared to other NFT cryptocurrencies. Its disadvantages are lower market awareness and a relatively smaller ecosystem. OMI shows strong growth potential in the NFT space.
* The information is not intended to be and does not constitute financial advice or any other recommendation of any sort offered or endorsed by Gate.