This comprehensive analysis examines ECOMI (OMI) token's market position and investment potential through 2031. Currently trading at $0.00016785 with a $45.48M market cap, OMI serves the digital collectibles ecosystem despite facing a 51.24% annual decline. The article projects price growth from conservative $0.00016 to optimistic $0.00037 by 2031, driven by ecosystem expansion and mainstream adoption. Key factors influencing OMI's trajectory include token supply dynamics, whale activity, regulatory environment, and platform development. The analysis presents three investment strategies—long-term holding, active trading, and portfolio allocation—alongside comprehensive risk management frameworks. Investors should carefully assess volatility risks, regulatory uncertainties, and liquidity constraints while trading on Gate exchange, with recommendations tailored for beginners, experienced traders, and institutions based on individual risk tolerance.
Introduction: OMI's Market Position and Investment Value
ECOMI (OMI), positioned as a premium licensed digital collectibles platform, has been operating since 2017 and has established its presence in the blockchain-based collectibles ecosystem. As of 2026, OMI maintains a market capitalization of approximately $45.48 million, with a circulating supply of around 270.95 billion tokens, and the price hovering around $0.00016785. This digital asset, recognized for its role in bridging physical collectibles with blockchain technology, is playing an increasingly important role in the digital entertainment and NFT collectibles sectors.
This article will comprehensively analyze OMI's price trends from 2026 to 2031, combining historical patterns, market supply and demand dynamics, ecosystem development, and macroeconomic conditions to provide investors with professional price forecasts and practical investment strategies.
I. OMI Price History Review and Market Status
OMI Historical Price Evolution Trajectory
- 2019: Initial market entry phase, price reached a historical low of $0.00000337 on November 4
- 2021: Market breakthrough period, price surged to an all-time high of $0.01343572 on March 20, representing significant growth momentum
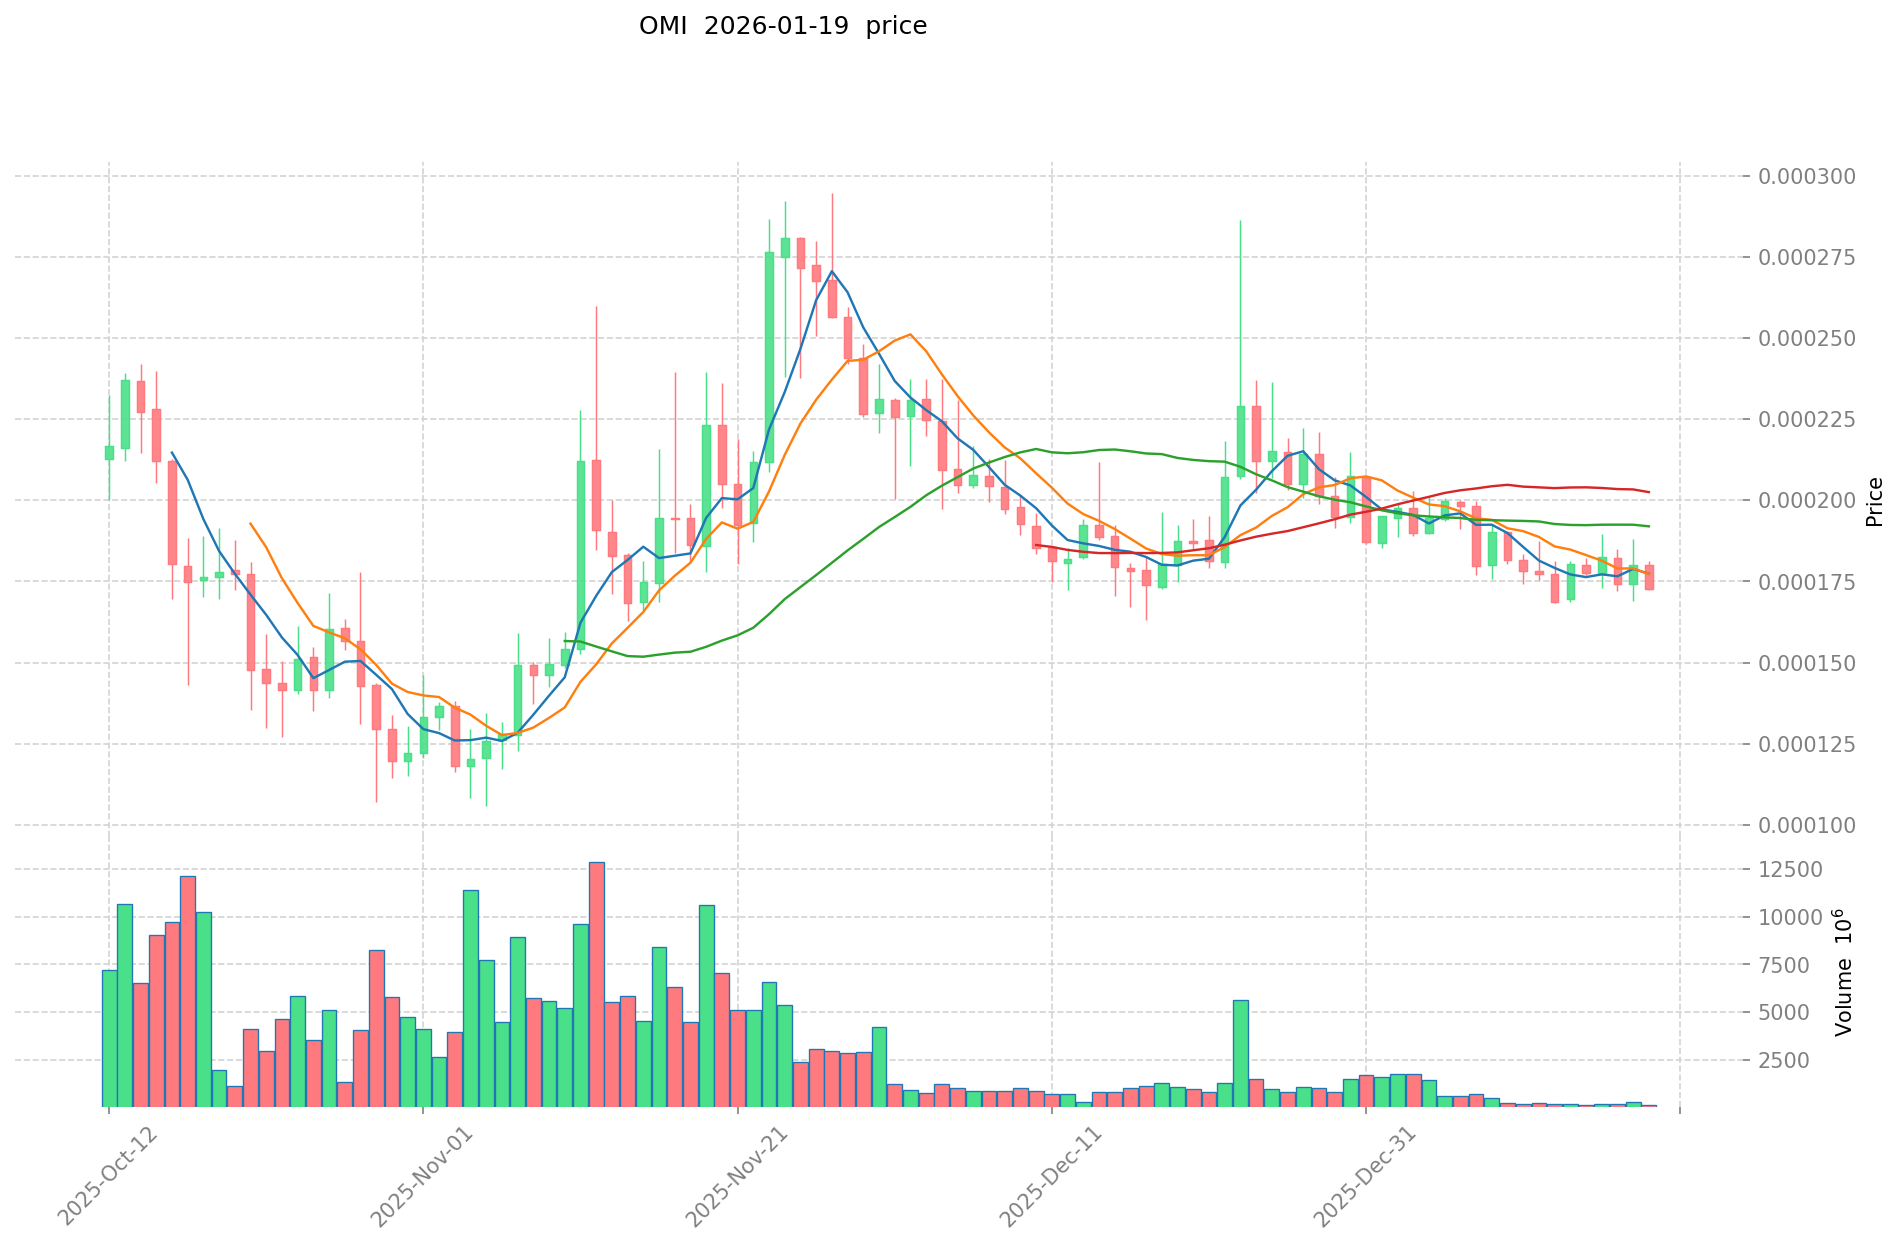
- 2025-2026: Market adjustment cycle, price experienced substantial correction with a one-year decline of 51.24%, reflecting broader market volatility
OMI Current Market Situation
As of January 19, 2026, OMI is trading at $0.00016785, showing a 24-hour decline of 4.69%. The token demonstrates notable short-term price fluctuations, with a 1-hour decrease of 1.73% and a 7-day decline of 4.73%. The 30-day performance indicates an 11.20% decrease, while the annual perspective reveals a 51.24% drop.
The current market capitalization stands at approximately $45.48 million, with a fully diluted valuation of $52.18 million. The circulating supply represents 270.95 billion OMI tokens, accounting for 36.13% of the total supply of 310.88 billion tokens. The maximum supply is capped at 750 billion tokens. Over the past 24 hours, trading volume reached $20,631.83, with the price ranging between $0.00016733 and $0.00017735.
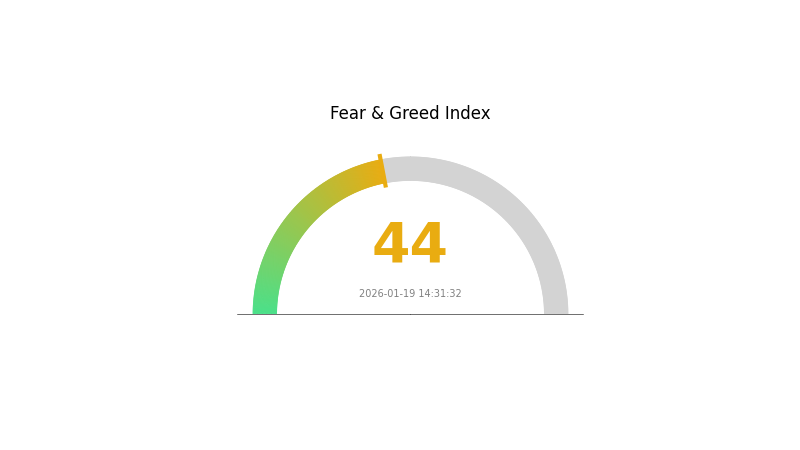
OMI holds a market dominance of 0.0015% and ranks 557th by market capitalization. The token is supported by approximately 26,695 holders and is listed on 7 exchanges. The market sentiment indicator currently reflects a fear index of 44, suggesting cautious investor sentiment in the broader cryptocurrency market.
Click to view current OMI market price
OMI Market Sentiment Index
2026-01-19 Fear and Greed Index: 44 (Fear)
Click to view the current Fear & Greed Index
The cryptocurrency market is currently experiencing a Fear sentiment phase with an OMI reading of 44. This moderate fear level suggests investors are exercising caution and defensive positioning. During such periods, market volatility typically increases as participants reassess risk exposure. The current fear sentiment may present opportunities for long-term investors to accumulate positions at potentially lower valuations. However, traders should remain vigilant and implement proper risk management strategies. Monitoring the index movements closely can help inform trading decisions as market conditions evolve.
OMI Holding Distribution
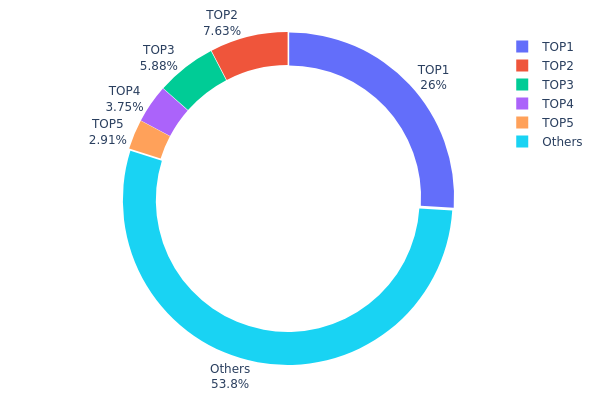
The holding distribution chart reveals the allocation of tokens across different wallet addresses, serving as a key indicator of token concentration and decentralization level within a blockchain project. This metric helps assess whether tokens are widely dispersed among numerous holders or concentrated in the hands of a few major addresses, which directly impacts market stability and price volatility.
According to the current data, the top address holds approximately 52.32 billion OMI tokens, accounting for 25.99% of the total supply, while the top five addresses collectively control 45.15% of the total circulation. The remaining 53.85% is distributed among other addresses. This distribution pattern indicates a moderate level of concentration, with the largest holder possessing over a quarter of the supply, suggesting potential influence over market dynamics.
Such concentration levels warrant attention from investors. While not reaching extreme centralization, the significant holdings of top addresses could create substantial selling pressure if these holders decide to liquidate their positions. Additionally, the relatively large proportion held by the top five addresses may expose the market to price manipulation risks. However, the fact that over half of the tokens remain distributed among other holders provides some degree of decentralization, which helps maintain basic market liquidity and reduces the risk of complete control by a single entity.
Click to view the current OMI Holding Distribution
| Top |
Address |
Holding Qty |
Holding (%) |
| 1 |
0x3154...0f2c35 |
52316542.98K |
25.99% |
| 2 |
0x38ba...00d26a |
15355845.72K |
7.63% |
| 3 |
0x704d...59b669 |
11826667.27K |
5.87% |
| 4 |
0x5fdc...8e27e9 |
7546829.24K |
3.75% |
| 5 |
0xc215...94b1eb |
5858000.00K |
2.91% |
| - |
Others |
108333122.16K |
53.85% |
II. Core Factors Influencing OMI's Future Price
Supply Mechanism
- Token Halving Events: ECOMI token halvings represent scheduled reductions in new token issuance, historically associated with supply constraints in cryptocurrency markets. Such events tend to create anticipation of reduced selling pressure.
- Historical Patterns: Previous halving events in the broader cryptocurrency market have been associated with notable price movements, though individual token performance varies based on multiple factors.
- Current Impact: Market participants may factor in potential halving dynamics when evaluating OMI's supply-demand balance, though actual price impact depends on concurrent market conditions.
Institutional and Major Holder Dynamics
- Whale Activity: Large holder movements have been observed to influence short-term price volatility for OMI, with significant fund transfers potentially signaling changing sentiment among major stakeholders.
- Partnership Growth: The project's future price potential appears connected to ongoing partnership development and expanding collaborations within the digital collectibles space.
- User Base Expansion: Continued growth in user adoption represents a fundamental factor that could support longer-term price trends for the token.
Macroeconomic Environment
- Market Sentiment: The cryptocurrency market demonstrates high sensitivity to sentiment shifts, with news cycles and social media trends playing a measurable role in short-term price movements for tokens like OMI.
- Regulatory Environment: Government regulatory frameworks and legal clarity in key markets represent significant factors shaping investor confidence and market participation levels.
- Policy Developments: Potential approvals of cryptocurrency-related financial products, such as ETFs, have historically influenced broader market dynamics and may impact OMI's trading patterns.
Technical Development and Ecosystem Building
- Platform Upgrades: Infrastructure improvements and technical enhancements to the ECOMI ecosystem may influence user experience and platform functionality.
- Exchange Listings: New exchange listings have been associated with increased liquidity and market access, potentially affecting price discovery mechanisms.
- Ecosystem Applications: The development and adoption of applications within the ECOMI ecosystem could contribute to utility-driven demand for the OMI token over time.
III. 2026-2031 OMI Price Prediction
2026 Outlook
- Conservative Forecast: $0.00016
- Neutral Forecast: $0.00017
- Optimistic Forecast: $0.00019 (requires sustained market stability and increased adoption)
2027-2029 Outlook
- Market Stage Expectation: The token is anticipated to enter a gradual growth phase, potentially benefiting from broader market recovery and enhanced platform utility.
- Price Range Forecast:
- 2027: $0.00014 - $0.00023 (approximately 5% increase)
- 2028: $0.00012 - $0.00029 (approximately 22% increase)
- 2029: $0.0002 - $0.00032 (approximately 48% increase)
- Key Catalysts: Expanding ecosystem partnerships, improved token utility mechanisms, and favorable macroeconomic conditions for digital assets could drive price appreciation during this period.
2030-2031 Long-term Outlook
- Baseline Scenario: $0.00027 - $0.00037 (assuming steady ecosystem development and market maturation)
- Optimistic Scenario: $0.00028 - $0.00037 (with accelerated adoption and strategic platform enhancements)
- Transformative Scenario: Prices potentially reaching $0.00034 - $0.00037 range by 2031 (under exceptionally favorable conditions including significant technological breakthroughs and mainstream adoption)
- 2031-01-19: OMI could potentially reach $0.00033 average price (representing approximately 94% cumulative growth from 2026 baseline)
| Year |
Predicted High Price |
Predicted Average Price |
Predicted Low Price |
Price Change |
| 2026 |
0.00019 |
0.00017 |
0.00016 |
0 |
| 2027 |
0.00023 |
0.00018 |
0.00014 |
5 |
| 2028 |
0.00029 |
0.00021 |
0.00012 |
22 |
| 2029 |
0.00032 |
0.00025 |
0.0002 |
48 |
| 2030 |
0.00037 |
0.00028 |
0.00027 |
69 |
| 2031 |
0.00034 |
0.00033 |
0.00023 |
94 |
IV. OMI Professional Investment Strategy and Risk Management
OMI Investment Methodology
(I) Long-term Holding Strategy
- Suitable for: Investors who believe in the digital collectibles market and are willing to hold through market cycles
- Operational Recommendations:
- Consider accumulating positions during market downturns when OMI trades below $0.00020
- Set a holding period of at least 12-24 months to allow the digital collectibles ecosystem to mature
- Use Gate Web3 Wallet for secure storage with private key control
(II) Active Trading Strategy
- Technical Analysis Tools:
- Moving Averages: Monitor 50-day and 200-day moving averages for trend identification
- Volume Analysis: Track 24-hour trading volume ($20,631.83) relative to historical averages to identify accumulation or distribution phases
- Swing Trading Considerations:
- The 24-hour range of $0.00016733-$0.00017735 suggests potential entry points near support levels
- Monitor broader NFT and digital collectibles market sentiment for correlation trading opportunities
OMI Risk Management Framework
(I) Asset Allocation Principles
- Conservative Investors: 1-2% of crypto portfolio allocation
- Moderate Investors: 3-5% of crypto portfolio allocation
- Aggressive Investors: 5-10% of crypto portfolio allocation
(II) Risk Hedging Solutions
- Portfolio Diversification: Balance OMI holdings with established cryptocurrencies and stablecoins
- Stop-Loss Implementation: Consider setting stop-loss orders 15-20% below entry price to limit downside exposure
(III) Secure Storage Solutions
- Hot Wallet Recommendation: Gate Web3 Wallet for convenient trading and staking access
- Cold Storage Option: Hardware wallet solutions for long-term holdings exceeding $1,000
- Security Precautions: Never share private keys, enable two-factor authentication, and verify contract address (0xeD35af169aF46a02eE13b9d79Eb57d6D68C1749e) before transactions
V. OMI Potential Risks and Challenges
OMI Market Risks
- High Volatility: OMI has declined 51.24% over the past year and 11.20% over 30 days, indicating significant price volatility
- Limited Liquidity: With only 7 exchanges listing OMI and 24-hour volume of $20,631.83, liquidity may be constrained during market stress
- Market Cap Concentration: With market dominance of only 0.0015%, OMI remains a small-cap asset vulnerable to large market movements
OMI Regulatory Risks
- NFT Regulatory Uncertainty: Evolving global regulations regarding digital collectibles may impact ECOMI's business model
- Securities Classification Risk: Regulatory bodies may classify certain digital collectibles as securities, creating compliance challenges
- Cross-border Transaction Restrictions: International regulations on digital asset transfers could affect the platform's global reach
OMI Technical Risks
- Smart Contract Vulnerabilities: As an Ethereum-based token, OMI is exposed to potential smart contract exploits
- Platform Dependency: The token's value is closely tied to the success and adoption of the ECOMI Collect application
- Circulating Supply Concerns: Only 36.13% of maximum supply is currently circulating (270.95B of 750B tokens), creating potential dilution risk
VI. Conclusion and Action Recommendations
OMI Investment Value Assessment
OMI presents a specialized investment opportunity in the digital collectibles and NFT space through the ECOMI Collect platform. The project targets the licensed digital collectibles market, allowing users to purchase, trade, and own premium branded digital assets. However, recent performance shows notable challenges, with the token down 51.24% year-over-year and trading significantly below its historical high of $0.01343572. The relatively low market capitalization of $45.48M and limited exchange listings suggest this remains a higher-risk, speculative asset. Long-term value depends heavily on the broader adoption of digital collectibles and the platform's ability to secure major brand partnerships.
OMI Investment Recommendations
✅ Beginners: Approach with extreme caution; allocate no more than 1% of overall crypto portfolio and only invest funds you can afford to lose entirely. Focus on learning about NFT market dynamics before increasing exposure.
✅ Experienced Investors: Consider OMI as a small speculative position (2-5% of crypto holdings) within a diversified NFT sector allocation. Monitor platform development milestones and partnership announcements for potential catalysts.
✅ Institutional Investors: Conduct thorough due diligence on ECOMI's business model, partnership pipeline, and competitive positioning. Consider OMI only as part of a broader digital collectibles thesis with appropriate position sizing relative to liquidity constraints.
OMI Trading Participation Methods
- Spot Trading on Gate.com: Direct purchase and sale of OMI tokens with immediate settlement
- Dollar-Cost Averaging: Regular smaller purchases to smooth out entry price over time and reduce timing risk
- Limited Orders: Place buy orders at support levels (near $0.00016733) and sell orders at resistance points (near $0.00017735) to capitalize on price ranges
Cryptocurrency investment carries extremely high risks, and this article does not constitute investment advice. Investors should make cautious decisions based on their own risk tolerance and are advised to consult professional financial advisors. Never invest more than you can afford to lose.
FAQ
What is OMI token and what is its practical use?
OMI is a blockchain-based digital token designed to transform the cultural industry. It powers NFT ecosystems, enabling users to own, trade, and monetize unique digital collectibles and cultural assets on decentralized platforms.
What are the main factors affecting OMI price?
OMI price is primarily influenced by market supply and demand dynamics, overall blockchain market sentiment, project development progress, trading volume, and adoption trends within the ecosystem.
How to analyze and predict OMI's future price trend?
Analyze OMI price trends by monitoring trading volume, market capitalization, community sentiment, and blockchain activity. Technical analysis of support/resistance levels and moving averages helps identify patterns. OMI shows upward momentum with year-end projections around $0.00019173, though prices may fluctuate based on broader market conditions and project developments.
OMI exhibits higher volatility compared to established tokens like FLOW and SAND. OMI's price fluctuates more significantly due to its earlier market stage, while FLOW and SAND demonstrate relatively more stable performance with stronger market maturity.
What are the risks to pay attention to when investing in OMI for price prediction?
OMI price prediction involves risks including market volatility, regulatory uncertainty, and competition. Price movements depend on broader crypto market trends and project development progress. Exercise caution with speculative positions.
* The information is not intended to be and does not constitute financial advice or any other recommendation of any sort offered or endorsed by Gate.