This comprehensive guide analyzes Orochi Network (ON) token's price trends and investment potential through 2031. Starting from ON's current market position at $0.103 with $14.86M market cap, the article examines historical price evolution since October 2025 launch and identifies key market dynamics including extreme fear sentiment and concentrated token holdings. It provides detailed price predictions across multiple scenarios: conservative 2026 outlook of $0.09-0.10, with potential growth to $0.12-0.24 by 2031 under optimistic conditions. The guide offers professional investment strategies including long-term holding and active trading approaches, complemented by comprehensive risk management frameworks covering asset allocation, portfolio diversification, and secure storage solutions on Gate Web3 Wallet. Key risk factors analyzed include liquidity constraints, regulatory uncertainties, and technical vulnerabilities. Suitable for experienced investors seeking exposure to verifiable data infrastructure, this
Introduction: ON's Market Position and Investment Value
Orochi Network (ON), as a verifiable data infrastructure project focused on ensuring data integrity and privacy through advanced cryptographic techniques, has been developing its position in the blockchain ecosystem since its launch in October 2025. As of January 2026, ON has a market capitalization of approximately $14.86 million, with a circulating supply of around 144.28 million tokens, and its price is maintained at approximately $0.103. This asset, recognized as a solution for applications requiring both transparency and privacy, is playing an increasingly important role in the fields of verifiable computation and secure data processing.
This article will comprehensively analyze ON's price trends from 2026 to 2031, combining historical patterns, market supply and demand dynamics, ecosystem development, and macroeconomic environment factors to provide investors with professional price forecasts and practical investment strategies.
I. ON Price History Review and Market Status
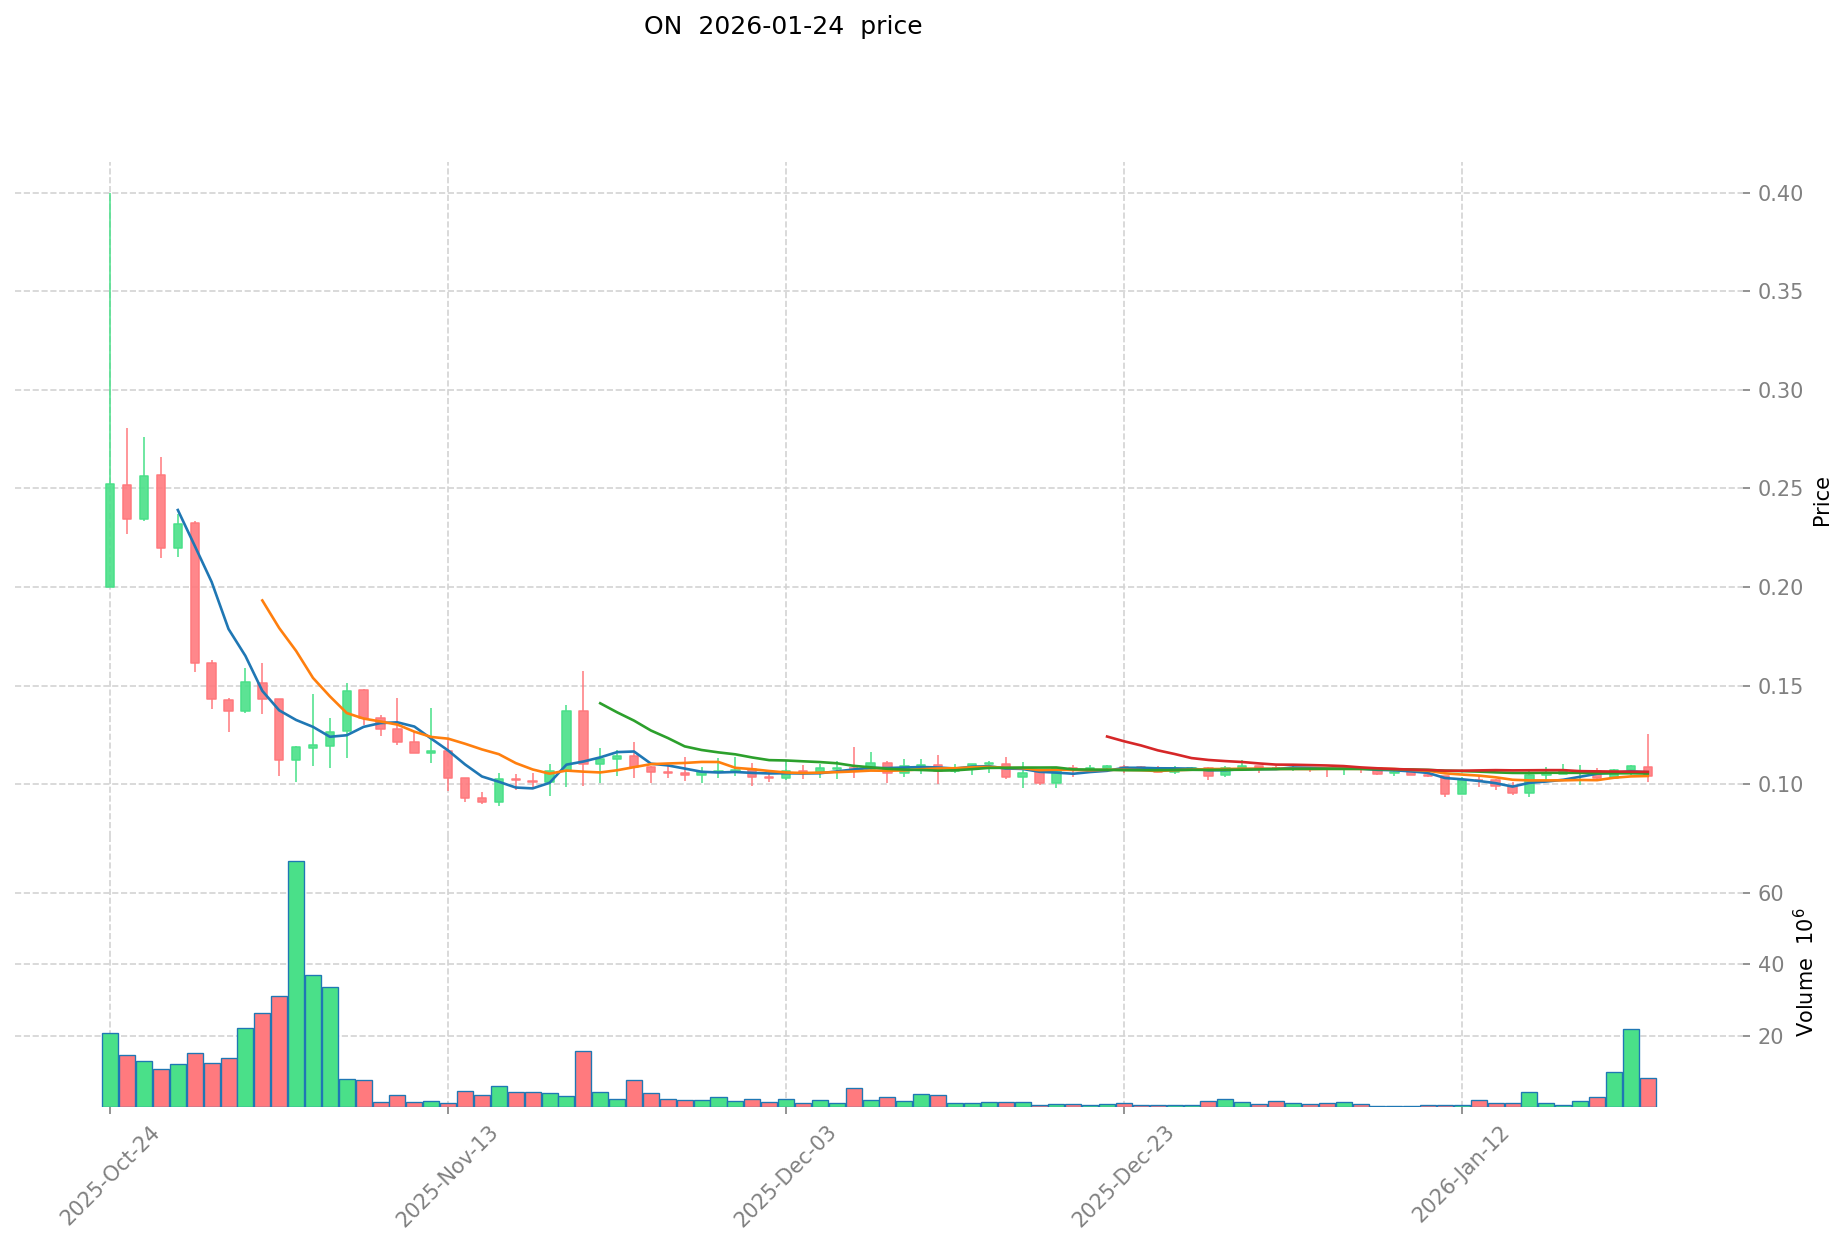
ON Historical Price Evolution Trajectory
- October 2025: Token launch on major exchanges with an initial price of $0.103, marking the entry into the cryptocurrency market
- October 24, 2025: Price reached its historical peak at $0.4, representing a notable early market reception
- November 16, 2025: Price declined to its historical low of $0.0888, reflecting market correction and volatility
- January 2026: Price stabilized around $0.103 level, showing signs of consolidation after previous fluctuations
ON Current Market Dynamics
As of January 24, 2026, ON is trading at $0.103, with a 24-hour trading volume of $646,056.79. The token has experienced a slight decline of 1.88% over the past 24 hours, with an intraday high of $0.10512 and low of $0.10125.
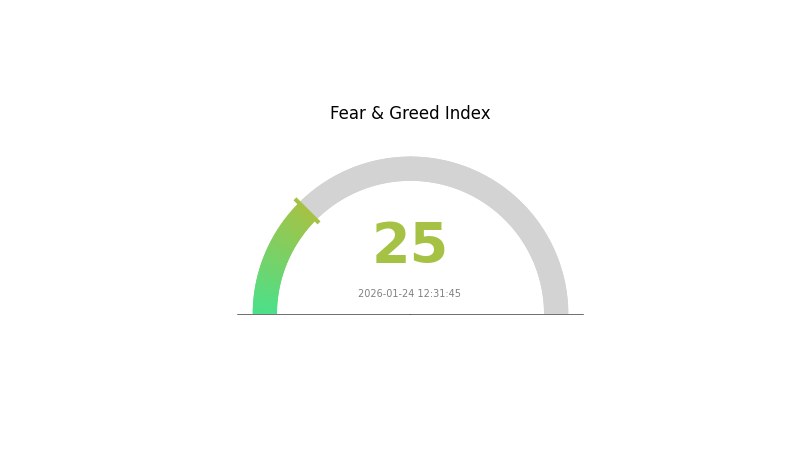
The broader market context shows extreme fear sentiment according to the current volatility index reading of 25. ON's market capitalization stands at approximately $14.86 million, with a circulating supply of 144.275 million tokens out of a maximum supply of 1 billion tokens, representing a circulation ratio of 14.43%.
Recent price performance indicates mixed momentum across different timeframes. While the token gained 0.31% in the past hour, it has declined 1.15% over the past week and 4.93% over the past 30 days. The year-over-year performance shows a decrease of 60.63% from previous levels.
The fully diluted market cap is valued at $103 million, and ON currently maintains a market dominance of 0.0032%. The token is deployed on both BSC and ETH networks, adhering to BEP-20 and ERC-20 standards respectively, with approximately 40 recorded holders across these chains.
Click to view current ON market price
ON Market Sentiment Index
2026-01-24 Fear and Greed Index: 25 (Extreme Fear)
Click to view the current Fear & Greed Index
The cryptocurrency market is currently experiencing extreme fear, with the Fear and Greed Index standing at 25. This significant decline indicates heightened market pessimism and investor anxiety. During such periods of extreme fear, market volatility typically increases as investors rush to exit positions. However, experienced traders often view extreme fear as potential buying opportunities, as assets may be undervalued. It's crucial to conduct thorough research and assess your risk tolerance before making investment decisions in these uncertain market conditions.
ON Holding Distribution
The holding distribution chart reveals the concentration of token ownership across different wallet addresses, serving as a critical indicator of market structure and decentralization level. For ON, the data demonstrates a notably concentrated ownership pattern, with the top 5 addresses collectively controlling 91.23% of the total token supply. Specifically, the largest holder possesses 147 million tokens (24.50%), followed by the second and third addresses holding 18.28% and 16.66% respectively. This high concentration level significantly deviates from the ideal decentralized distribution model, suggesting that a small number of entities maintain substantial control over the token's circulating supply.
From a market structure perspective, such concentrated holdings present both opportunities and risks. On one hand, major holders may have strong alignment with the project's long-term success, potentially providing stability during market volatility. On the other hand, this concentration creates heightened vulnerability to large-scale sell pressure, as any significant liquidation from top addresses could trigger substantial price movements. The relatively small "Others" category, representing only 8.77% of total holdings, indicates limited token distribution among retail participants and smaller investors, which may constrain organic trading activity and price discovery mechanisms.
The current distribution pattern raises considerations regarding potential market manipulation risks and liquidity dynamics. With over 90% of tokens controlled by five addresses, coordinated actions among these holders could materially impact market prices and trading volumes. This structure also suggests limited on-chain decentralization, which may affect community governance participation if applicable. Investors should monitor any shifts in this distribution pattern, particularly any transfers from major holders, as such movements could signal changes in market sentiment or project fundamentals.
Click to view current ON Holding Distribution

| Top |
Address |
Holding Qty |
Holding (%) |
| 1 |
0x28d7...b3f8a4 |
147000.00K |
24.50% |
| 2 |
0xadc5...7452d8 |
109725.00K |
18.28% |
| 3 |
0xa054...759be1 |
100000.00K |
16.66% |
| 4 |
0x059a...eb19e3 |
95800.00K |
15.96% |
| 5 |
0x4ee9...7e1d86 |
95000.00K |
15.83% |
| - |
Others |
52475.00K |
8.77% |
II. Core Factors Influencing ON's Future Price
Based on the available materials, there is insufficient data to provide a comprehensive analysis of the core factors that may influence ON's future price movements. The analysis requires detailed information about supply mechanisms, institutional dynamics, macroeconomic conditions, and technical developments, none of which are currently available in the provided sources.
Investors interested in ON should conduct independent research and consult multiple reliable sources before making any investment decisions. Market conditions in the cryptocurrency space remain highly volatile and subject to rapid changes.
III. 2026-2031 ON Price Prediction
2026 Outlook
- Conservative Prediction: $0.09172 - $0.10306
- Neutral Prediction: Around $0.10306
- Optimistic Prediction: Up to $0.12573 (requires favorable market conditions and increased adoption)
2027-2029 Outlook
- Market Stage Expectation: Gradual growth phase with potential consolidation periods as the token establishes market presence
- Price Range Predictions:
- 2027: $0.09953 - $0.15672 (approximately 11% year-over-year growth)
- 2028: $0.09083 - $0.18436 (approximately 31% cumulative growth from 2026)
- 2029: $0.10717 - $0.19035 (approximately 55% cumulative growth from 2026)
- Key Catalysts: Market maturation, technological developments, and broader ecosystem expansion may serve as primary drivers for price appreciation during this period
2030-2031 Long-term Outlook
- Baseline Scenario: $0.09458 - $0.17516 in 2030 (assuming steady market development)
- Optimistic Scenario: $0.12469 - $0.23553 by 2031 (contingent on successful implementation of growth strategies and favorable market conditions)
- Transformative Scenario: Potential to reach $0.23553 (requires significant breakthroughs in adoption and ecosystem expansion)
- January 24, 2026: ON trading at projected levels between $0.09172 - $0.12573 (establishing baseline for future growth trajectory)
| Year |
Predicted High Price |
Predicted Average Price |
Predicted Low Price |
Price Change |
| 2026 |
0.12573 |
0.10306 |
0.09172 |
0 |
| 2027 |
0.15672 |
0.1144 |
0.09953 |
11 |
| 2028 |
0.18436 |
0.13556 |
0.09083 |
31 |
| 2029 |
0.19035 |
0.15996 |
0.10717 |
55 |
| 2030 |
0.2207 |
0.17516 |
0.09458 |
70 |
| 2031 |
0.23553 |
0.19793 |
0.12469 |
92 |
IV. ON Professional Investment Strategies and Risk Management
ON Investment Methodology
(1) Long-term Holding Strategy
- Suitable for: Investors seeking exposure to verifiable data infrastructure with moderate to high risk tolerance
- Operational Recommendations:
- Consider establishing positions during market corrections when ON trades below its 30-day moving average
- Monitor the project's development progress and partnership announcements as potential value catalysts
- Implement a secure storage solution using Gate Web3 Wallet for enhanced security and easy access to portfolio management features
(2) Active Trading Strategy
- Technical Analysis Tools:
- Moving Averages: Utilize 7-day and 30-day moving averages to identify potential entry and exit points; ON currently shows short-term volatility with a -1.15% 7-day change
- Volume Analysis: Monitor the 24-hour trading volume of approximately $646,056 to gauge market interest and liquidity conditions
- Swing Trading Considerations:
- Observe the price range between the 24-hour low of $0.10125 and high of $0.10512 to identify intraday trading opportunities
- Set stop-loss orders to manage downside risk, particularly given the token's -60.63% annual performance
ON Risk Management Framework
(1) Asset Allocation Principles
- Conservative Investors: 1-2% of crypto portfolio allocation
- Aggressive Investors: 3-5% of crypto portfolio allocation
- Professional Investors: Up to 5-8% with active risk monitoring and hedging strategies
(2) Risk Hedging Solutions
- Portfolio Diversification: Balance ON holdings with established cryptocurrencies and stablecoins to reduce concentration risk
- Position Sizing: Given ON's relatively low market cap of $14.86 million and limited holder base of 40 addresses, maintain smaller position sizes to manage liquidity risk
(3) Secure Storage Solutions
- Multi-signature Wallet Recommendation: Gate Web3 Wallet offers enhanced security features suitable for storing ON tokens across both BSC and ETH networks
- Cold Storage Option: For larger holdings, consider transferring tokens to hardware wallet solutions after verifying contract addresses (BSC: 0x0e4f6209ed984b21edea43ace6e09559ed051d48, ETH: 0x33f6be84becff45ea6aa2952d7ef890b44bfb59d)
- Security Precautions: Always verify contract addresses before transactions, enable two-factor authentication, and never share private keys or seed phrases
V. ON Potential Risks and Challenges
ON Market Risks
- Liquidity Constraints: With a 24-hour trading volume of approximately $646,056 and listing on 12 exchanges, ON may experience slippage during larger trades
- Price Volatility: The token has demonstrated significant price fluctuations, declining approximately 60.63% over the past year from its high of $0.4 to current levels
- Low Market Capitalization: With a market cap of only $14.86 million and market dominance of 0.0032%, ON remains susceptible to larger market movements and manipulation risks
ON Regulatory Risks
- Data Privacy Compliance: As a verifiable data infrastructure project, ON may face evolving regulations regarding data handling and privacy protection across different jurisdictions
- Token Classification Uncertainty: Regulatory frameworks for utility tokens supporting data infrastructure services continue to develop, which may impact ON's operational model
- Cross-chain Compliance: Operating on both BSC and ETH networks may subject the project to multiple regulatory frameworks and compliance requirements
ON Technical Risks
- Smart Contract Vulnerabilities: The dual-chain deployment (BEP-20 and ERC-20) increases the attack surface and requires ongoing security audits to prevent potential exploits
- Network Dependencies: The project's reliance on external blockchain networks means it may be affected by congestion, high gas fees, or security issues on BSC or Ethereum
- Limited Holder Base: With only 40 token holders recorded, the project faces challenges in achieving broader adoption and decentralization of token distribution
VI. Conclusion and Action Recommendations
ON Investment Value Assessment
Orochi Network presents a specialized investment opportunity in the verifiable data infrastructure sector, combining advanced cryptographic techniques with practical privacy solutions. The project's dual-chain deployment and focus on data integrity address genuine market needs. However, potential investors should carefully weigh the significant headwinds: a 60.63% annual decline, limited liquidity with only $646,056 in daily trading volume, and a concentrated holder base of 40 addresses. The low circulating supply ratio of 14.43% indicates substantial token unlock risk. While the technology proposition remains compelling for the data privacy sector, ON's current market position suggests elevated risk levels that require cautious evaluation.
ON Investment Recommendations
✅ Beginners: Consider gaining experience with more established cryptocurrencies before exploring smaller market cap projects like ON; if interested, limit exposure to less than 1% of your crypto portfolio
✅ Experienced Investors: May allocate 2-3% to ON as a speculative position within a diversified crypto portfolio, with close monitoring of development milestones and partnership announcements
✅ Institutional Investors: Conduct thorough due diligence on the project's technical infrastructure, team credentials, and competitive positioning; consider pilot allocation with appropriate risk controls and liquidity management protocols
ON Trading Participation Methods
- Spot Trading: Purchase ON directly on Gate.com and other supporting exchanges, with the advantage of full ownership and flexibility to transfer to personal wallets
- Dollar-Cost Averaging: Implement systematic purchases over time to reduce the impact of price volatility, particularly suitable given ON's current market conditions
- Portfolio Integration: Incorporate ON as part of a broader data infrastructure and privacy-focused cryptocurrency allocation strategy, balanced with established projects in the sector
Cryptocurrency investments carry extreme risk, and this article does not constitute investment advice. Investors should make prudent decisions based on their own risk tolerance and are advised to consult professional financial advisors. Never invest more than you can afford to lose.
FAQ
What is the historical price trend of ON token?
ON token has experienced volatile price movements since its launch. The token started with early adoption phases, reaching notable highs during bull market periods. Price fluctuations reflect market cycles, with significant trading volume activity during peak periods. Long-term trends show potential growth trajectory as the project develops and community engagement increases.
What are the main factors affecting ON coin price?
ON price is influenced by market demand and trading volume, network activity and adoption, project development progress, overall cryptocurrency market sentiment, and macroeconomic factors. Strong ecosystem growth and partnership announcements typically drive positive price momentum.
How to analyze ON coin's technical and fundamental aspects to predict future prices?
Analyze ON's technical indicators like moving averages, RSI, and support/resistance levels. Review fundamentals including project developments, adoption metrics, and trading volume. Monitor network activity and compare performance against market trends to forecast price movements.
How is the price correlation of ON coin with other mainstream cryptocurrencies such as BTC and ETH?
ON coin shows moderate positive correlation with BTC and ETH, typically ranging from 0.6-0.8. During market uptrends, ON tends to outperform, while in downturns it may experience higher volatility. The correlation strengthens during major market movements and weakens during sideways trading phases.
What are professional analysts' price predictions for ON coin in the future?
Professional analysts project ON coin could reach $2-5 in the next 12-24 months, driven by increased adoption, network expansion, and growing institutional interest. However, market volatility remains significant, and actual performance depends on broader crypto market conditions and ON protocol developments.
* The information is not intended to be and does not constitute financial advice or any other recommendation of any sort offered or endorsed by Gate.