This comprehensive guide analyzes ONG (Ontology Gas) token's price trajectory and investment opportunities through 2031. Currently trading at $0.0831 with a $36.68 million market cap, ONG serves as the utility token powering the Ontology blockchain ecosystem. The article examines historical price evolution, current market sentiment (Fear Index at 32), and token concentration risks, with top holders controlling 83.30% of supply. Professional price forecasts predict ONG reaching $0.09468 in 2026, potentially climbing to $0.18387 by 2031 under optimistic scenarios. Investors receive detailed strategies including long-term holding approaches and active trading techniques, alongside comprehensive risk management frameworks and secure storage solutions via Gate trading platform. The analysis addresses regulatory challenges, liquidity concerns, and network dependency risks while providing actionable recommendations for beginners, experienced traders, and institutional investors seeking exposure to this blockchain in
Introduction: ONG's Market Position and Investment Value
OntologyGas (ONG) serves as the utility token and network usage right for the Ontology ecosystem, a next-generation public blockchain infrastructure and distributed trust collaboration platform. Since its launch in 2018, ONG has established itself as a fundamental component within the Ontology network, functioning as compensation for network node contributions and ensuring network stability and security. As of 2026, ONG maintains a market capitalization of approximately $36.68 million, with a circulating supply of around 441.61 million tokens, trading at approximately $0.083. This asset, serving as the operational fuel for Ontology's distributed ledger and smart contract system, plays an increasingly important role in supporting decentralized identity frameworks and data exchange protocols.
This article will comprehensively analyze ONG's price trends from 2026 to 2031, combining historical patterns, market supply-demand dynamics, ecosystem development, and macroeconomic conditions to provide investors with professional price forecasts and practical investment strategies.
I. ONG Price History Review and Market Status
ONG Historical Price Evolution Trajectory
- 2018: ONG launched in August with initial offering price around $0.19, experiencing significant volatility in its early stages
- 2018: Reached a notable price point of $4.39 in late September, marking a substantial increase from its launch period
- 2020: During broader market corrections in March, price declined to its recorded low point of approximately $0.04
ONG Current Market Situation
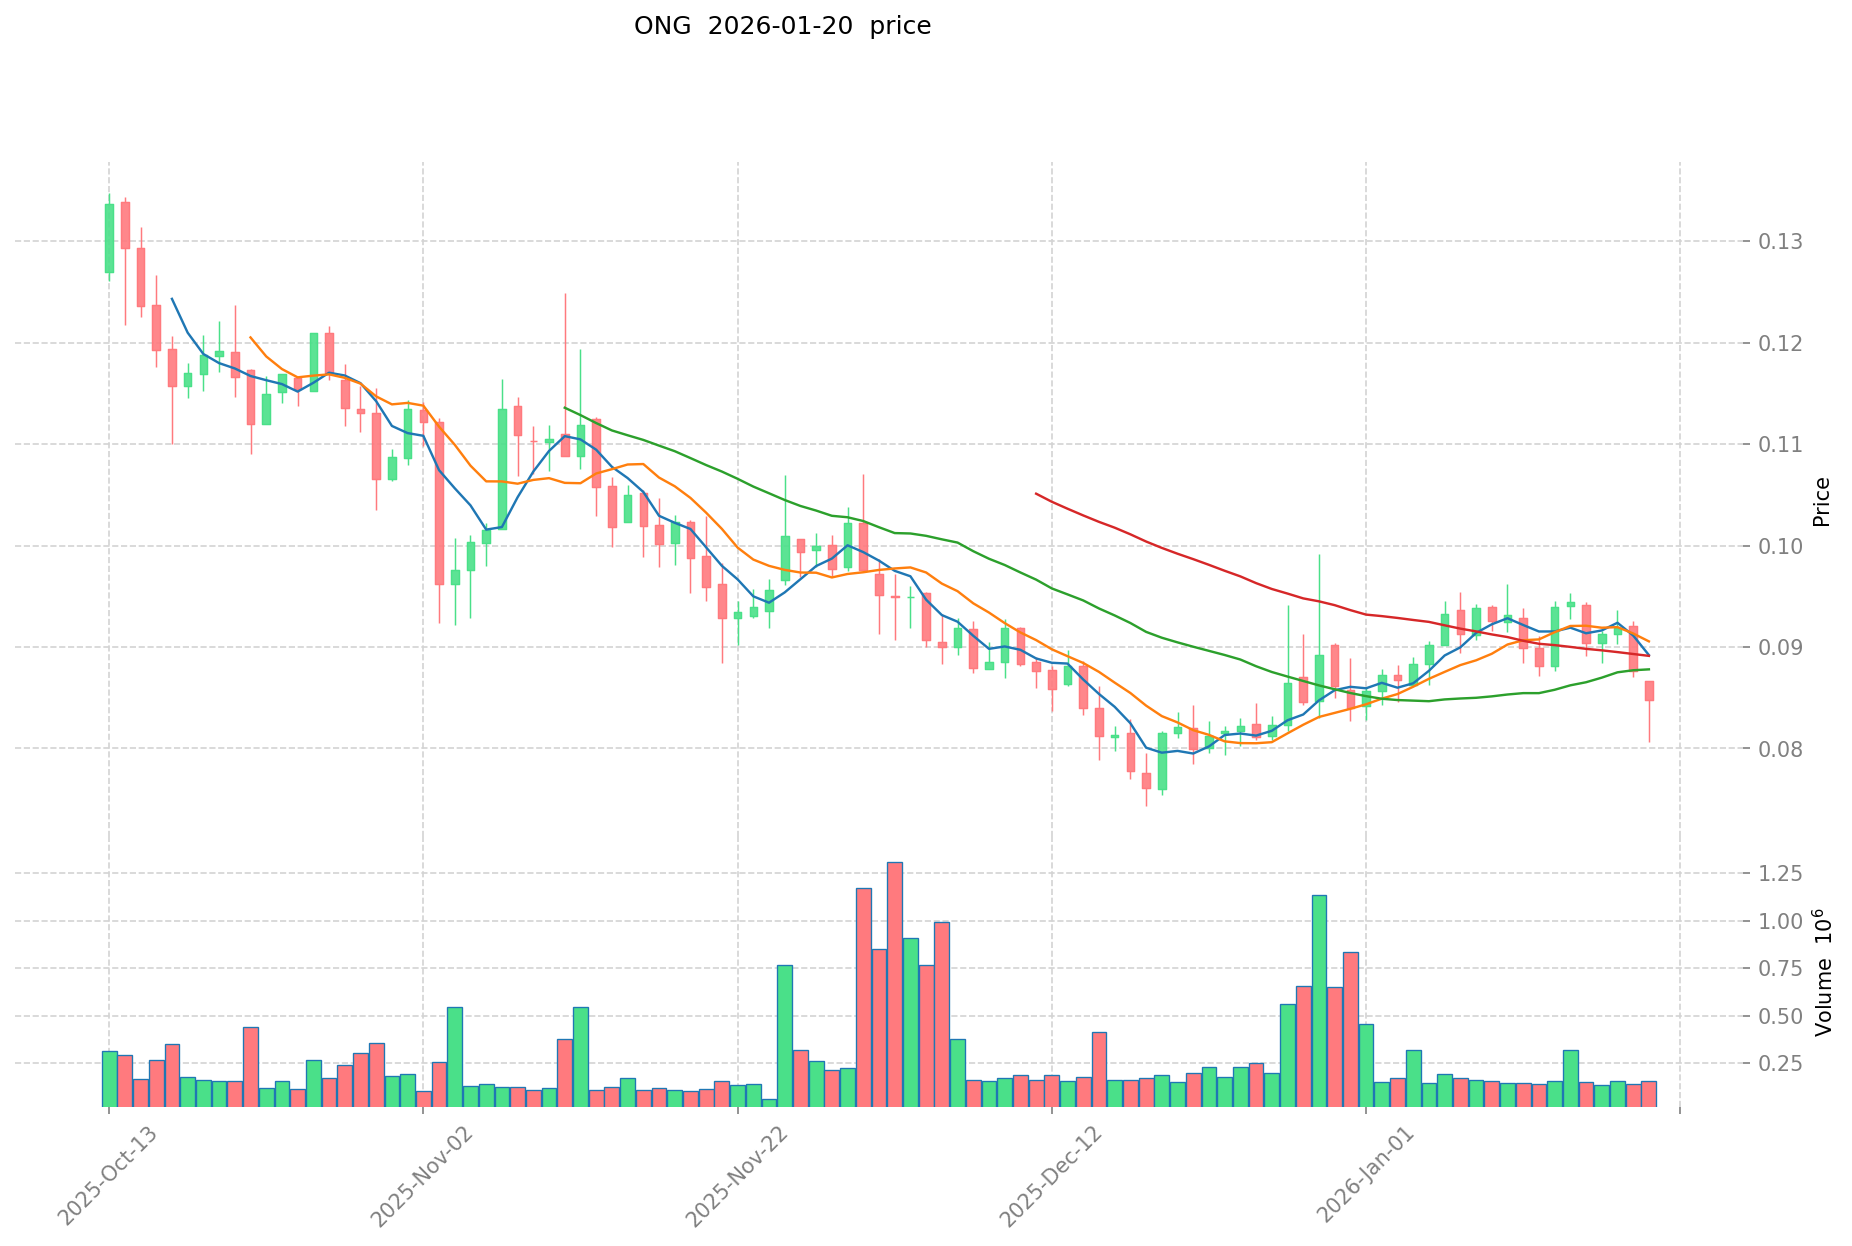
As of January 20, 2026, ONG is trading at $0.0831, showing recent price movement with a 24-hour trading range between $0.0819 and $0.0856. The asset demonstrates a circulating supply of approximately 441.61 million tokens out of a total supply of 800 million tokens, representing a circulation rate of about 44.16%.
The current market capitalization stands at approximately $36.68 million, with a fully diluted valuation of $66.44 million. Daily trading volume registers at $13,004.78, while the asset maintains a market dominance of 0.0020%. Over the past 24 hours, the price shows a slight decrease of 0.34%, while the 7-day period reflects an 8.08% decline. The 30-day trend indicates a marginal increase of 0.96%. The asset is currently available for trading on 15 exchanges and maintains approximately 1.61 million holders.
Click to view current ONG market price
ONG Market Sentiment Index
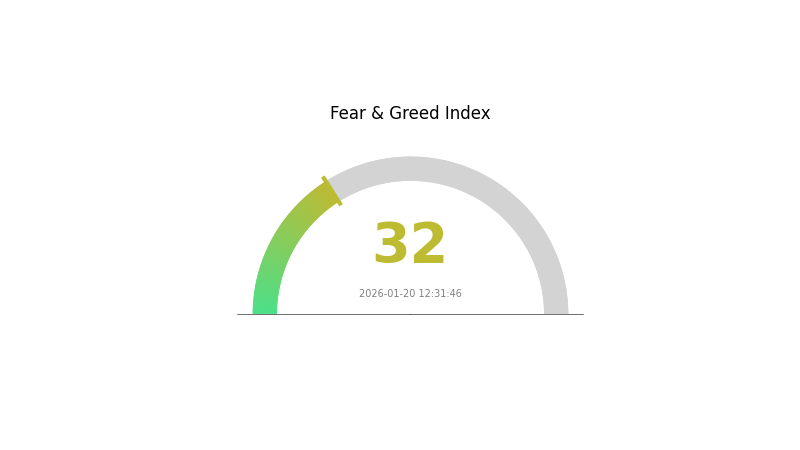
2026-01-20 Fear and Greed Index: 32 (Fear)
Click to view current Fear & Greed Index
The market is currently experiencing significant fear sentiment with an index reading of 32, indicating heightened risk aversion among investors. This level suggests pessimistic market conditions where cautious positioning dominates trading activity. When the Fear and Greed Index remains in the fear zone, it often presents potential opportunities for contrarian investors, as extreme sentiment readings historically tend to precede market reversals. Traders should remain vigilant and monitor key support levels while considering their risk management strategies during this period of elevated market anxiety.
ONG Holdings Distribution
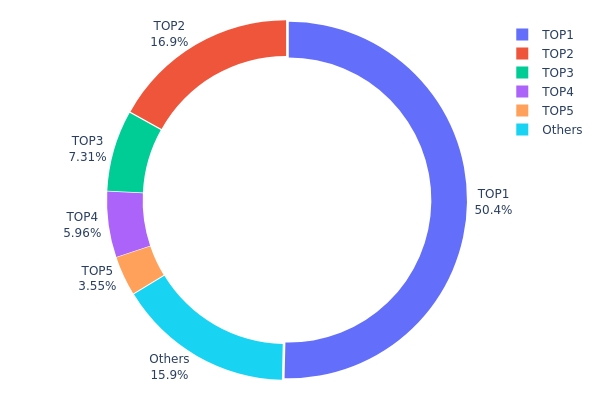
The holdings distribution chart reflects the concentration of ONG tokens across different addresses on the blockchain. This metric serves as a critical indicator of market structure, revealing how tokens are distributed among major holders versus smaller participants. A highly concentrated distribution typically suggests that a few addresses control a significant portion of the circulating supply, while a more dispersed distribution indicates broader token ownership across the network.
According to the current data, ONG exhibits a notably concentrated holdings pattern. The top address alone holds 399,231.02K tokens, representing 49.90% of the total supply—nearly half of all circulating ONG. The second-largest address controls 133,964.34K tokens (16.75%), while the third holds 57,907.41K tokens (7.24%). The top three addresses collectively account for 73.89% of the total supply, and the top five addresses control 83.30%. The remaining addresses categorized as "Others" hold merely 16.7% of the supply, further emphasizing the high degree of centralization.
This concentration level raises concerns about potential market manipulation risks and price volatility. When a small number of addresses control the majority of tokens, large-scale transfers or sales by these holders could trigger significant price fluctuations. Additionally, such centralization may undermine the project's decentralization claims and affect investor confidence. From a positive perspective, if these major holders represent project teams, foundations, or long-term strategic partners, this distribution might indicate strong conviction in the project's future development. However, the current data suggests that ONG's on-chain structure exhibits relatively low decentralization, and market participants should remain vigilant regarding concentration risks when evaluating this asset.
Click to view current ONG Holdings Distribution
| Top |
Address |
Holding Qty |
Holding (%) |
| 1 |
AFmseV...UMqNMV |
399231.02K |
49.90% |
| 2 |
ATyCXo...ahnifX |
133964.34K |
16.75% |
| 3 |
AFmseV...EH9ugK |
57907.41K |
7.24% |
| 4 |
AWd99o...KRxmc9 |
47210.52K |
5.90% |
| 5 |
AcjZFk...MgXWLE |
28101.17K |
3.51% |
| - |
Others |
126081.28K |
16.7% |
II. Core Factors Influencing ONG's Future Price
Due to the absence of available data regarding ONG's supply mechanisms, institutional dynamics, macroeconomic environment impacts, and technological developments, a comprehensive analysis of the core factors influencing ONG's future price cannot be provided at this time. Market participants are advised to monitor official project announcements and conduct independent research before making investment decisions.
III. 2026-2031 ONG Price Forecast
2026 Outlook
- Conservative estimate: $0.06893 - $0.08305
- Neutral estimate: Around $0.08305
- Optimistic estimate: Up to $0.09468 (contingent on favorable market conditions and increased adoption)
2027-2029 Mid-term Outlook
- Market stage expectation: Gradual growth phase with moderate volatility, reflecting broader cryptocurrency market trends and ecosystem development
- Price range forecast:
- 2027: $0.06398 - $0.11641, with an average price around $0.08886
- 2028: $0.07287 - $0.13856, showing approximately 23% growth potential
- 2029: $0.07598 - $0.13266, with expected 45% cumulative change from baseline
- Key catalysts: Network upgrades, strategic partnerships, regulatory clarity in major markets, and increased utility within the Ontology ecosystem
2030-2031 Long-term Outlook
- Baseline scenario: $0.06711 - $0.17981 (assuming steady ecosystem expansion and maintained network activity)
- Optimistic scenario: $0.095 - $0.18387 (assuming accelerated adoption, significant protocol improvements, and favorable regulatory environment)
- Transformative scenario: Potential to reach upper boundaries if breakthrough integrations materialize and market conditions align exceptionally well
- January 20, 2026: ONG trading within initial forecast parameters as the market establishes its trajectory for the year ahead
| Year |
Predicted High Price |
Predicted Average Price |
Predicted Low Price |
Price Change |
| 2026 |
0.09468 |
0.08305 |
0.06893 |
0 |
| 2027 |
0.11641 |
0.08886 |
0.06398 |
7 |
| 2028 |
0.13856 |
0.10264 |
0.07287 |
23 |
| 2029 |
0.13266 |
0.1206 |
0.07598 |
45 |
| 2030 |
0.17981 |
0.12663 |
0.06711 |
52 |
| 2031 |
0.18387 |
0.15322 |
0.095 |
84 |
IV. ONG Professional Investment Strategy and Risk Management
ONG Investment Methodology
(1) Long-term Holding Strategy
- Target Investors: Investors with a long-term outlook on blockchain infrastructure and distributed trust platforms
- Operational Recommendations:
- Consider accumulating ONG during market downturns, given its current price of $0.08305 compared to its all-time high of $4.39
- Monitor the network's node participation and transaction volume trends to assess long-term utility value
- Storage Solution: Use Gate Web3 Wallet for secure storage with multi-signature capabilities
(2) Active Trading Strategy
- Technical Analysis Tools:
- Support and Resistance Levels: Recent 24-hour trading shows support around $0.08186 and resistance near $0.08557
- Volume Analysis: Monitor the 24-hour trading volume of $13,004.78 to identify accumulation or distribution patterns
- Swing Trading Points:
- Consider the 7-day price decline of 8.08% as potential entry opportunities during market corrections
- Set stop-loss levels below key support zones to manage downside risk
ONG Risk Management Framework
(1) Asset Allocation Principles
- Conservative Investors: 1-2% of crypto portfolio
- Aggressive Investors: 3-5% of crypto portfolio
- Professional Investors: Up to 5-8% with active hedging strategies
(2) Risk Hedging Solutions
- Portfolio Diversification: Combine ONG with stablecoins and major cryptocurrencies to reduce volatility exposure
- Staggered Entry Strategy: Dollar-cost averaging over multiple time periods to mitigate timing risk
(3) Secure Storage Solutions
- Hot Wallet Recommendation: Gate Web3 Wallet for convenient trading access
- Cold Storage Solution: Hardware wallets for long-term holdings exceeding $5,000 equivalent
- Security Precautions: Enable two-factor authentication, regularly update security protocols, and never share private keys
V. ONG Potential Risks and Challenges
ONG Market Risks
- Price Volatility: ONG has experienced a 73.08% decline over the past year, indicating significant downside potential
- Liquidity Concerns: With a market capitalization of $36.68 million and ranking at 635, liquidity may be limited during adverse market conditions
- Competition Risk: The blockchain infrastructure sector faces intense competition from numerous Layer-1 and Layer-2 solutions
ONG Regulatory Risks
- Regulatory Uncertainty: Evolving global cryptocurrency regulations could impact ONG's trading availability and adoption
- Compliance Requirements: Changes in KYC/AML standards may affect network participation and token utility
- Jurisdictional Restrictions: Some regions may impose limitations on gas token trading and usage
ONG Technical Risks
- Network Dependency: ONG's value is directly tied to Ontology network activity and node participation
- Smart Contract Vulnerabilities: Despite established infrastructure, smart contract bugs could impact network security
- Adoption Challenges: Limited utility beyond the Ontology ecosystem may constrain long-term demand growth
VI. Conclusion and Action Recommendations
ONG Investment Value Assessment
ONG serves as the utility token for the Ontology network, representing network usage rights and compensating nodes for their contributions. With a current price of $0.08305 and a circulating supply of 441.6 million tokens (44.16% of total supply), the token shows characteristics of an established infrastructure asset. However, the significant year-over-year decline of 73.08% and relatively low market dominance of 0.0020% suggest caution. Long-term value depends on Ontology's ability to increase network adoption and transaction volume. Short-term risks include continued price pressure and limited liquidity in volatile market conditions.
ONG Investment Recommendations
✅ Beginners: Start with minimal exposure (under 2% of portfolio) and focus on understanding Ontology's ecosystem before increasing position size
✅ Experienced Investors: Consider strategic accumulation during market downturns while maintaining strict position sizing and stop-loss discipline
✅ Institutional Investors: Evaluate ONG as a niche infrastructure play within a diversified blockchain portfolio, with emphasis on fundamental analysis of network metrics
ONG Trading Participation Methods
- Spot Trading: Direct purchase and sale on Gate.com with access to ONG/USDT trading pairs
- Dollar-Cost Averaging: Regular periodic purchases to smooth entry prices and reduce timing risk
- Staking and Network Participation: Hold ONG to participate in Ontology network governance and earn potential rewards from network activities
Cryptocurrency investment carries extremely high risks, and this article does not constitute investment advice. Investors should make prudent decisions based on their own risk tolerance and are advised to consult professional financial advisors. Never invest more than you can afford to lose.
FAQ
What is ONG token and what is its purpose?
ONG is a utility token used for gas fees and network operations on the Ontology blockchain. It powers smart contract execution, transaction validation, and decentralized application functionality, serving as the essential fuel for the Ontology ecosystem.
What is the historical price trend of ONG?
ONG has experienced significant volatility since its launch. The token showed strong growth momentum in 2024-2025, with price fluctuations driven by market adoption and protocol developments. Trading volume increased substantially during bull market phases, reflecting growing investor interest in the ONG ecosystem and its utility value.
What are the main factors affecting ONG price?
ONG price is primarily influenced by market demand and supply dynamics, network adoption growth, overall cryptocurrency market sentiment, blockchain ecosystem developments, and trading volume fluctuations in the market.
What is the difference between ONG and ONT (Ontology token)?
ONG is the utility token for gas fees and transactions on the Ontology network, while ONT is the governance token used for staking and voting. ONG is generated through ONT staking and used to pay network transaction costs.
How to conduct ONG price technical analysis and prediction?
Analyze ONG price through key technical indicators: moving averages for trend direction, RSI for momentum levels, MACD for trend confirmation, and support/resistance levels. Monitor trading volume patterns and chart formations. Use candlestick analysis to identify reversal signals. Combine multiple indicators for reliable predictions and track historical price cycles.
What are professional analysts' predictions for ONG's future price?
Analysts project ONG could reach $0.15-0.25 by mid-2026, driven by increasing platform adoption and ecosystem expansion. Long-term forecasts suggest potential growth to $0.50+ as decentralized applications scale and market demand strengthens.
What are the circulating supply and total supply of ONG?
ONG has a circulating supply of approximately 1 billion tokens, with a total supply capped at 10 billion tokens. The exact figures may vary based on network updates and token burns.
Where can I trade ONG?
ONG is available for trading on major cryptocurrency exchanges including decentralized exchanges and leading spot trading platforms. You can check real-time trading volume and liquidity across multiple platforms to find the best trading conditions for your needs.
What are the risks and limitations of ONG price predictions?
ONG price predictions depend on market volatility, trading volume, and network adoption. Predictions may be inaccurate due to sudden market shifts, regulatory changes, or technological developments. Historical data doesn't guarantee future performance.
What are the price predictions and prospects for ONG in 2024?
ONG shows strong growth potential driven by increasing adoption and network expansion. Market analysts project continued upward momentum through 2024, with improved trading volume and institutional interest supporting price appreciation. Long-term fundamentals remain positive.
* The information is not intended to be and does not constitute financial advice or any other recommendation of any sort offered or endorsed by Gate.