This comprehensive analysis examines OORT's price trajectory and investment potential through 2031, providing professional forecasts and actionable strategies. The article reviews OORT's current market position at $0.0162 with an $11.2 million market cap, analyzing historical price movements and market sentiment indicators. It details core factors influencing OORT's decentralized AI infrastructure value, projects price ranges from conservative to optimistic scenarios across multiple years, and outlines both long-term holding and active trading methodologies. A robust risk management framework addresses asset allocation, portfolio diversification, and secure storage solutions on Gate exchange. The analysis concludes with actionable recommendations tailored for beginners, experienced investors, and institutional participants, emphasizing careful due diligence and risk management in this volatile emerging infrastructure sector.
Introduction: OORT's Market Position and Investment Value
OORT (OORT), positioned as a decentralized AI infrastructure for data privacy and cost savings, has been integrating global compute and storage resources to empower trustworthy AI applications since its launch in 2024. As of 2026, OORT maintains a market capitalization of approximately $11.2 million, with a circulating supply of around 691.42 million tokens, and a trading price hovering near $0.0162. This asset, known as a "decentralized AI infrastructure solution," is playing an increasingly significant role in the Web3 AI application ecosystem.
This article will comprehensively analyze OORT's price trajectory from 2026 to 2031, combining historical patterns, market supply-demand dynamics, ecosystem development, and macroeconomic conditions to provide investors with professional price forecasts and practical investment strategies.
I. OORT Price History Review and Market Status
OORT Historical Price Evolution Trajectory
- 2024: OORT reached a notable price level of $1.22 on January 15, marking a significant peak in its trading history
- 2026: The token experienced substantial downward pressure, with price declining to $0.01276 on January 7, representing a considerable adjustment from previous levels
OORT Current Market Situation
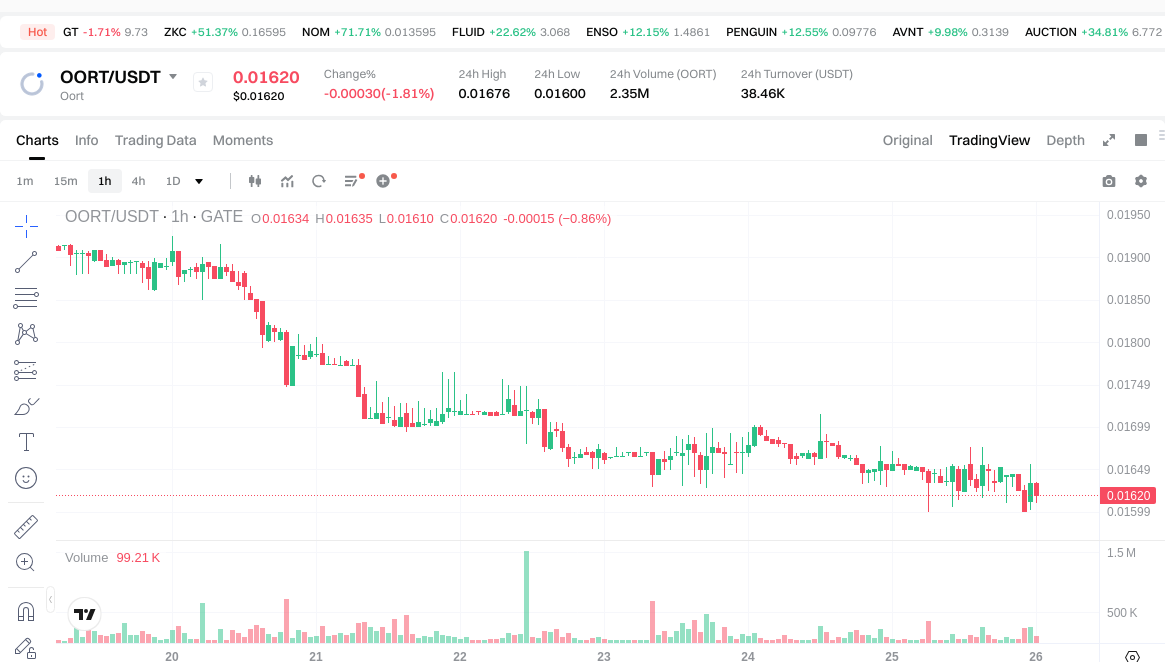
As of January 26, 2026, OORT is trading at $0.0162, reflecting a 24-hour decline of 1.69%. The token has demonstrated mixed short-term performance, with a 1-hour decrease of 0.61% and a 7-day decline of 15.09%. However, the 30-day period shows a modest recovery with a 1.56% increase.
The 24-hour trading range spans from $0.016 to $0.01676, with total trading volume reaching $37,993.95. OORT's current market capitalization stands at approximately $11.2 million, with a circulating supply of 691,417,082.91 tokens, representing 34.57% of the maximum supply of 2 billion tokens. The fully diluted market cap is calculated at $32.38 million.
The token maintains a market dominance of 0.0010%, with trading activity across 5 exchanges. The market cap to fully diluted valuation ratio stands at 34.57%, indicating a significant portion of tokens remains locked or unvested.
OORT operates as a decentralized AI infrastructure platform designed to protect data privacy while reducing costs. By integrating global computing and storage resources, the project aims to support trustworthy AI applications. The platform utilizes a mainnet architecture and was initially launched at a price of $0.1.
Current market sentiment indicators suggest a cautious environment, with the broader crypto market experiencing heightened volatility.
Click to view current OORT market price
OORT Market Sentiment Index
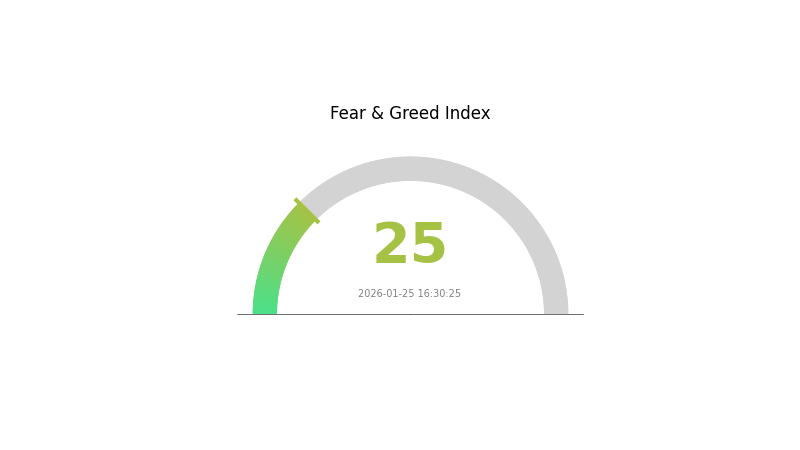
2026-01-25 Fear and Greed Index: 25 (Extreme Fear)
Click to view the current Fear & Greed Index
The cryptocurrency market is experiencing extreme fear, with the Fear and Greed Index dropping to 25. This indicates significant market pessimism and risk aversion among investors. During periods of extreme fear, asset prices often reach attractive levels, presenting potential buying opportunities for long-term investors. However, heightened volatility and uncertainty remain prevalent. Traders should exercise caution, manage risk appropriately, and avoid making impulsive decisions driven by emotions. This market condition typically reflects concerns about regulatory developments, macroeconomic factors, or major market events that have shaken investor confidence in the near term.
OORT Holdings Distribution
The address holdings distribution chart reflects the concentration of OORT tokens across different wallet addresses on the blockchain, serving as a key indicator of token decentralization and market structure stability. By analyzing the holdings percentage of top addresses, we can assess whether the token supply is excessively concentrated in the hands of a few entities, which may pose risks of market manipulation or increased price volatility. A more dispersed distribution typically indicates healthier decentralization and reduced systemic risk.
Based on current on-chain data, OORT demonstrates a relatively balanced holdings distribution pattern. The top-tier addresses maintain significant but not overwhelming positions, suggesting that no single entity or small group of whales dominates the token supply. This distribution characteristic indicates moderate decentralization, which helps mitigate the risk of coordinated sell-offs or price manipulation schemes. The presence of multiple substantial holders rather than extreme concentration in one or two addresses reflects a more mature market structure that has evolved beyond the initial distribution phase.
From a market dynamics perspective, this holdings distribution pattern contributes to relative price stability during normal trading conditions. While large holders still possess sufficient tokens to influence short-term price movements, the diversified ownership structure creates natural checks and balances that prevent single-point failures. The current distribution suggests that OORT has achieved a reasonable equilibrium between decentralization and liquidity provision, supporting sustainable long-term development. However, investors should remain vigilant regarding any significant changes in top holder concentrations, as shifts in this metric could signal evolving market sentiment or strategic repositioning by major stakeholders.
Click to view current OORT Holdings Distribution

| Top |
Address |
Holding Qty |
Holding (%) |
II. Core Factors Affecting OORT's Future Price
Based on the available materials, there is insufficient data to provide a comprehensive analysis of the core factors that may influence OORT's future price movements. The reference materials do not contain specific information regarding supply mechanisms, institutional holdings, macroeconomic correlations, or technical developments related to OORT.
Without verifiable data on token economics, major stakeholder activities, or ecosystem developments, it would be inappropriate to speculate on price-influencing factors. Investors interested in OORT should conduct thorough research using official project documentation and verified data sources before making investment decisions.
For trading OORT and other digital assets, users can visit Gate.com, which provides comprehensive trading services and market information.
III. 2026-2031 OORT Price Prediction
2026 Outlook
- Conservative Prediction: $0.01539 - $0.0162
- Neutral Prediction: Around $0.0162
- Optimistic Prediction: Up to $0.01717 (requires favorable market conditions and increased adoption)
2027-2029 Outlook
- Market Stage Expectation: OORT may enter a gradual growth phase during this period, with potential expansion in decentralized cloud computing applications and ecosystem development.
- Price Range Prediction:
- 2027: $0.01101 - $0.02203
- 2028: $0.01297 - $0.02613
- 2029: $0.01592 - $0.02934
- Key Catalysts: Technology upgrades, ecosystem partnerships, increasing demand for decentralized infrastructure solutions, and overall cryptocurrency market sentiment.
2030-2031 Long-term Outlook
- Baseline Scenario: $0.02135 - $0.03359 (assuming steady adoption of decentralized cloud services and moderate market growth)
- Optimistic Scenario: $0.02604 - $0.03359 (assuming accelerated technology adoption and favorable regulatory environment)
- Transformative Scenario: Potential to reach $0.02982 - $0.0328 range by 2031 (under conditions of widespread enterprise adoption and significant breakthrough in decentralized computing)
- 2026-01-26: OORT trading within the established range, showing potential for gradual appreciation over the forecast period
| Year |
Predicted High Price |
Predicted Average Price |
Predicted Low Price |
Price Change |
| 2026 |
0.01717 |
0.0162 |
0.01539 |
0 |
| 2027 |
0.02203 |
0.01669 |
0.01101 |
3 |
| 2028 |
0.02613 |
0.01936 |
0.01297 |
19 |
| 2029 |
0.02934 |
0.02274 |
0.01592 |
40 |
| 2030 |
0.03359 |
0.02604 |
0.02135 |
60 |
| 2031 |
0.0328 |
0.02982 |
0.02594 |
84 |
IV. OORT Professional Investment Strategy and Risk Management
OORT Investment Methodology
(I) Long-Term Holding Strategy
- Target Investors: Investors who believe in decentralized AI infrastructure and data privacy solutions with a long-term perspective
- Operational Recommendations:
- Consider accumulating positions during market corrections when the token trades closer to support levels
- Monitor OORT's ecosystem development and partnership announcements as indicators of long-term value
- Utilize Gate Web3 Wallet for secure storage of OORT tokens with self-custody controls
(II) Active Trading Strategy
- Technical Analysis Tools:
- Moving Averages: Use 50-day and 200-day moving averages to identify trend reversals and entry/exit points
- Volume Analysis: Monitor the 24-hour trading volume (currently around $38,000) to assess market liquidity and participation
- Swing Trading Key Points:
- Set stop-loss orders below recent support levels to manage downside risk
- Consider taking partial profits during rallies toward resistance levels
OORT Risk Management Framework
(I) Asset Allocation Principles
- Conservative Investors: 1-3% of crypto portfolio allocation to OORT
- Aggressive Investors: 3-7% of crypto portfolio allocation to OORT
- Professional Investors: 5-10% of crypto portfolio allocation with active position management
(II) Risk Hedging Solutions
- Portfolio Diversification: Balance OORT holdings with other AI-related tokens and established cryptocurrencies
- Position Sizing: Scale into positions gradually rather than investing lump sums to average entry prices
(III) Secure Storage Solutions
- Hot Wallet Recommendation: Gate Web3 Wallet for convenient trading and staking access
- Cold Storage Solution: Hardware wallet storage for long-term holdings exceeding trading needs
- Security Precautions: Never share private keys, enable two-factor authentication, and regularly verify wallet addresses before transactions
V. OORT Potential Risks and Challenges
OORT Market Risks
- High Volatility: OORT has experienced significant price fluctuations, with a 1-year decline of over 83%, indicating substantial market volatility
- Limited Liquidity: With a 24-hour trading volume of approximately $38,000 and listings on only 5 exchanges, liquidity constraints may impact large order execution
- Low Market Capitalization: A market cap of approximately $11.2 million places OORT in a higher risk category with greater susceptibility to market manipulation
OORT Regulatory Risks
- AI Regulation Uncertainty: Evolving regulations around artificial intelligence applications may impact OORT's decentralized AI infrastructure model
- Data Privacy Compliance: Changes in global data privacy laws could affect OORT's operations and value proposition
- Token Classification: Regulatory clarity on OORT's token status across different jurisdictions remains uncertain
OORT Technical Risks
- Competition from Established Players: The decentralized AI infrastructure space faces competition from larger, better-funded projects
- Network Adoption: Success depends on attracting sufficient compute and storage providers to the OORT network
- Integration Challenges: Technical complexity in integrating global compute and storage resources may slow ecosystem development
VI. Conclusion and Action Recommendations
OORT Investment Value Assessment
OORT presents an interesting value proposition as a decentralized AI infrastructure focused on data privacy and cost savings. The project's integration of global compute and storage resources addresses growing demand for trustworthy AI applications. However, the token has faced significant headwinds, with an 83% decline over the past year and low trading volumes. The circulating supply represents only 34.57% of the maximum supply, suggesting potential future dilution concerns. While the AI infrastructure narrative remains compelling long-term, investors should carefully weigh the substantial volatility and liquidity risks against the project's potential.
OORT Investment Recommendations
✅ Beginners: Limit exposure to 1-2% of your crypto portfolio and only invest amounts you can afford to lose completely; focus on learning about the project fundamentals before investing
✅ Experienced Investors: Consider dollar-cost averaging into positions during market weakness; monitor ecosystem developments and partnerships as key value drivers
✅ Institutional Investors: Conduct thorough due diligence on OORT's technology infrastructure and team; assess liquidity requirements carefully given the limited trading volume
OORT Trading Participation Methods
- Spot Trading: Purchase OORT tokens directly on Gate.com with support for multiple trading pairs
- Staking Programs: Explore potential staking opportunities to earn passive income on OORT holdings
- Research and Monitor: Follow OORT's official channels and community updates to stay informed about project developments before making investment decisions
Cryptocurrency investment carries extremely high risks, and this article does not constitute investment advice. Investors should make prudent decisions based on their own risk tolerance and are advised to consult professional financial advisors. Never invest more than you can afford to lose.
FAQ
What is OORT? What are its uses and value?
OORT is a decentralized storage and computing network token enabling users to participate in distributed data services. It powers a Web3 infrastructure layer providing secure, efficient storage solutions. OORT's value derives from network utility, ecosystem adoption, and its role in incentivizing node operators within the decentralized network architecture.
What are the main factors affecting OORT price?
OORT price is primarily influenced by network adoption and user growth, trading volume in the market, technology developments and upgrades, overall crypto market sentiment, and competition from similar projects. Supply dynamics and ecosystem expansion also play significant roles in price movements.
How to predict the price of OORT tokens?
Analyze OORT's market fundamentals, trading volume trends, network adoption growth, and sentiment indicators. Monitor blockchain activity, developer updates, and macroeconomic factors. Use technical analysis with support/resistance levels and moving averages for price forecasting.
What are the risks and limitations of OORT price prediction?
Price predictions depend on market volatility, data accuracy, and unforeseen events. Trading volume fluctuations, regulatory changes, and technological developments can significantly impact OORT prices. Predictions are estimates only and cannot guarantee future performance.
What are the differences between OORT and other storage tokens?
OORT stands out through its decentralized storage infrastructure, superior data redundancy mechanisms, and innovative incentive structures. It offers higher transaction throughput, lower latency, and stronger privacy protections compared to competitors. OORT's unique architecture enables efficient resource utilization and better scalability for enterprise-grade storage solutions.
What is OORT project's roadmap and future prospects?
OORT is advancing decentralized cloud infrastructure with expansion plans for edge computing nodes and AI integration. The roadmap includes enhanced scalability, enterprise partnerships, and ecosystem growth. Strong technological foundation positions OORT for significant adoption and market expansion in the Web3 infrastructure sector.
* The information is not intended to be and does not constitute financial advice or any other recommendation of any sort offered or endorsed by Gate.