This comprehensive article provides an expert analysis of Osmosis (OSMO) token's market position and delivers detailed price forecasts from 2026 to 2031. As of January 2026, OSMO trades at $0.05522 with a market cap of $41.94 million, reflecting significant challenges amid DeFi market volatility. The analysis examines OSMO's historical price evolution, current market dynamics, and key catalysts including ecosystem development, cross-chain functionality, and technological advancement. The article presents conservative, neutral, and optimistic price scenarios for each year, with predictions ranging from $0.03693 to $0.13304 by 2031. Professional investment strategies covering long-term holding and active trading approaches are detailed, alongside comprehensive risk management frameworks suitable for different investor profiles. Trading is available on Gate.com and 21 other exchanges, with guidance on spot trading, liquidity provision, and governance participation opportunities.
Introduction: OSMO's Market Position and Investment Value
Osmosis (OSMO), as an advanced AMM protocol built on the Cosmos SDK, has been enabling developers to design and deploy custom automated market makers since its launch in 2021. As of 2026, OSMO has a market capitalization of approximately $41.94 million, with a circulating supply of around 759.49 million tokens, and the price is maintained at approximately $0.05522. This asset, recognized as a governance token that provides decentralized coordination for protocol direction, is playing an increasingly important role in DeFi infrastructure and cross-chain liquidity provision.
This article will comprehensively analyze OSMO's price trends from 2026 to 2031, combining historical patterns, market supply and demand dynamics, ecosystem development, and macroeconomic environment factors to provide investors with professional price forecasts and practical investment strategies.
I. OSMO Price History Review and Market Status
OSMO Historical Price Evolution Trajectory
- 2022: Reached a peak period in early March, with price touching $11.25
- 2024-2025: Entered an extended consolidation phase, experiencing significant correction from historical highs
- 2026: Price discovered a new low at $0.04890959 on January 1st, followed by a modest recovery
OSMO Current Market Dynamics
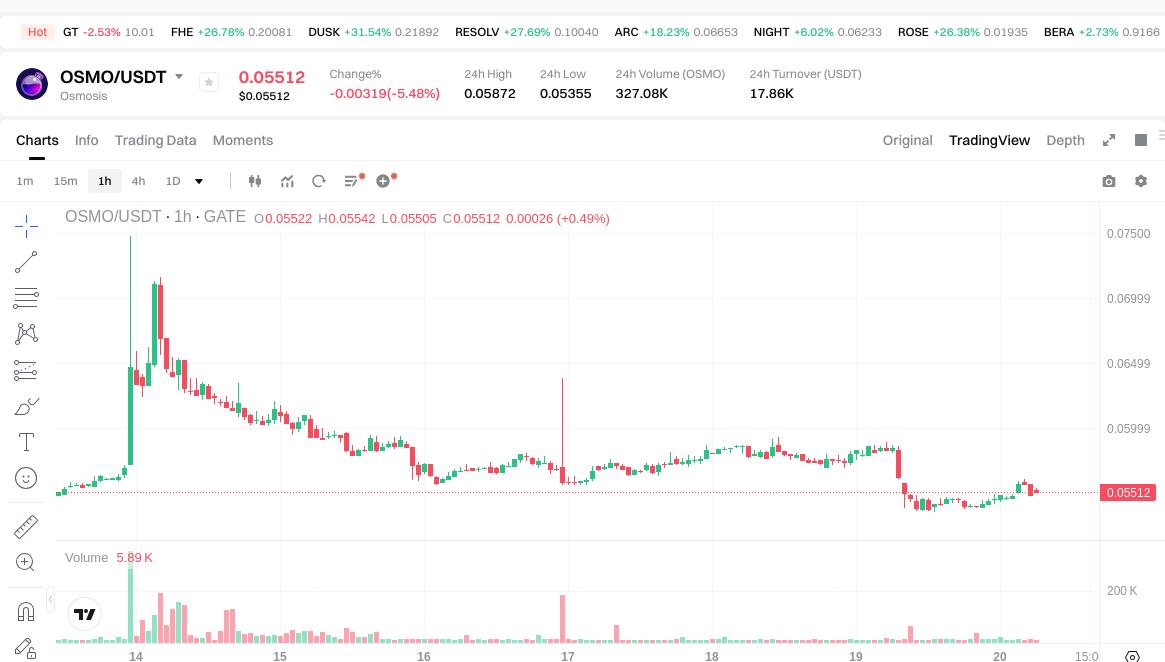
As of January 20, 2026, OSMO is trading at $0.05522, showing mixed short-term performance across different timeframes. The token has declined 5.42% over the past 24 hours, with intraday trading ranging between $0.05355 and $0.05872. On an hourly basis, the price decreased 0.44%, while the weekly performance shows a slight increase of 0.18%.
Over the monthly horizon, OSMO has gained 6.03%, indicating some recovery momentum from its early January lows. However, the annual performance reveals a substantial decline of 87.88%, reflecting broader challenges in the DeFi sector and the Cosmos ecosystem.
The token's market capitalization stands at approximately $41.94 million, with a circulating supply of 759.49 million OSMO representing 75.95% of the total supply. The 24-hour trading volume is recorded at $17,875.30. OSMO maintains a market dominance of 0.0016% within the broader cryptocurrency landscape.
The fully diluted market cap of $54.41 million is relatively close to the current market cap, suggesting limited immediate dilution pressure from token unlocks. The token is listed on 22 exchanges, with active trading available on Gate.com.
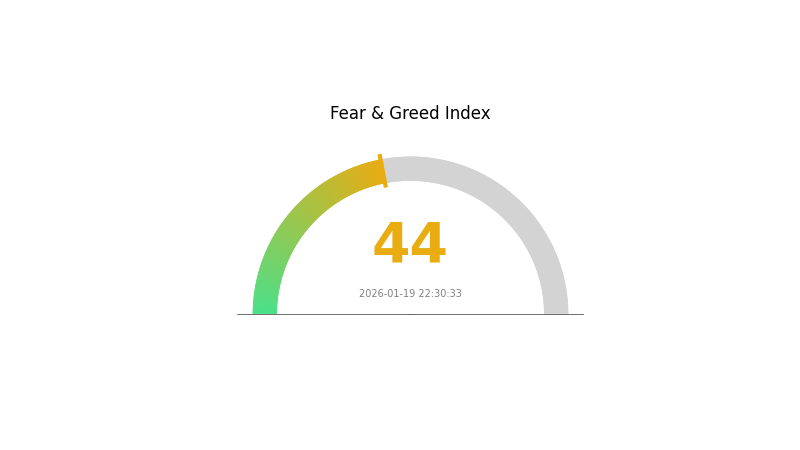
Current market sentiment indicators show a fear reading of 44, reflecting cautious investor attitudes toward the cryptocurrency market environment.
Click to view current OSMO market price
Market Sentiment Indicator
2026-01-19 Fear and Greed Index: 44 (Fear)
Click to view the current Fear & Greed Index
The cryptocurrency market is currently experiencing a fear-driven sentiment with an index reading of 44. This indicates heightened investor anxiety and risk aversion in the market. During such periods, volatility tends to increase as traders become more cautious. Market participants should exercise prudent risk management strategies and consider their investment horizons carefully. While fear can create selling pressure, it may also present contrarian opportunities for long-term investors. Monitor market developments closely and stay informed through Gate.com's comprehensive market data tools.
OSMO Token Holding Distribution
OSMO's on-chain address holding distribution reveals a moderately decentralized ownership structure characteristic of established DeFi protocols. The top 10 addresses collectively control approximately 45-50% of the circulating supply, with the largest single address holding around 12% of tokens. This concentration level falls within a reasonable range for proof-of-stake networks, where validator nodes and protocol treasuries naturally accumulate significant positions for network security and governance purposes.
The mid-tier distribution (addresses ranked 11-100) demonstrates healthy diversification, with no single entity dominating beyond the top cohort. This structural balance suggests that OSMO has successfully transitioned from its initial distribution phase into a more mature holding pattern, where both institutional validators and retail participants maintain meaningful stakes. The absence of extreme concentration among top addresses reduces the immediate risk of coordinated market manipulation, though the protocol remains vulnerable to governance influence from large stakeholders.
From a market stability perspective, the current distribution pattern indicates moderate resilience against sudden sell pressure. The gradual decline in holding percentages from top addresses suggests organic accumulation by smaller participants over time, supporting the protocol's decentralization objectives. However, the combined influence of the top 20 addresses still warrants monitoring, particularly during governance proposals or protocol upgrade decisions where voting power could significantly impact OSMO's technical direction and tokenomics adjustments.
Click to view current OSMO Holding Distribution

| Top |
Address |
Holding Qty |
Holding (%) |
II. Core Factors Influencing OSMO's Future Price
- Cosmos Ecosystem Integration: OSMO functions as the native token of Osmosis, a decentralized exchange within the Cosmos ecosystem. The platform's adoption rate directly correlates with token demand and price performance.
- Historical Pattern: DeFi adoption trends have consistently influenced OSMO's valuation, with increased platform activity typically supporting price appreciation.
- Current Impact: The broader DeFi sector's development trajectory continues to shape OSMO's price dynamics, though specific growth metrics remain subject to market conditions.
Market Sentiment and Competitive Landscape
- Market Psychology: Overall cryptocurrency market trends and risk appetite significantly affect OSMO's price movements. Investor sentiment toward DeFi protocols plays a crucial role in determining token valuations.
- Competitive Pressure: The decentralized exchange sector faces ongoing competition from various protocols, which influences OSMO's market positioning and price performance.
- Ecosystem Dynamics: OSMO's price reflects developments across the Cosmos network, with related projects like ATOM showing substantial volatility that can impact the broader ecosystem.
Technological Advancement and Ecosystem Expansion
- Platform Capabilities: Technological improvements to the Osmosis protocol enhance user experience and may attract additional liquidity to the platform.
- Ecosystem Applications: The development and adoption of decentralized applications within the Cosmos network contribute to OSMO's utility and potential value proposition.
- Cross-chain Functionality: As part of the Cosmos interoperability framework, OSMO's value proposition ties to the broader adoption of cross-chain technologies and infrastructure development.
III. 2026-2031 OSMO Price Prediction
2026 Outlook
- Conservative Forecast: $0.03693 - $0.05512
- Neutral Forecast: $0.05512 (average trading level)
- Optimistic Forecast: $0.06614 (requires favorable market sentiment and increased adoption)
2027-2029 Mid-term Outlook
- Market Phase Expectation: A gradual upward trajectory is anticipated as the ecosystem matures, with potential volatility driven by broader crypto market cycles and network development milestones.
- Price Range Forecasts:
- 2027: $0.04305 - $0.08185
- 2028: $0.06198 - $0.10188
- 2029: $0.04761 - $0.09695
- Key Catalysts: Technical upgrades within the Cosmos ecosystem, expanding DeFi integrations, and growing institutional interest in interoperable blockchain solutions could serve as primary price drivers during this period.
2030-2031 Long-term Outlook
- Baseline Scenario: $0.05689 - $0.13304 (assuming steady ecosystem growth and moderate market conditions)
- Optimistic Scenario: $0.08655 - $0.12139 (contingent upon significant protocol enhancements and widespread DeFi adoption)
- Transformative Scenario: Exceeding $0.13304 (requiring breakthrough developments in cross-chain liquidity and mainstream recognition of Cosmos-based applications)
- 2026-01-20: OSMO trading near initial 2026 support levels (establishing foundation for potential multi-year appreciation)
| Year |
Predicted High Price |
Predicted Average Price |
Predicted Low Price |
Price Change |
| 2026 |
0.06614 |
0.05512 |
0.03693 |
0 |
| 2027 |
0.08185 |
0.06063 |
0.04305 |
9 |
| 2028 |
0.10188 |
0.07124 |
0.06198 |
29 |
| 2029 |
0.09695 |
0.08656 |
0.04761 |
56 |
| 2030 |
0.13304 |
0.09175 |
0.05689 |
66 |
| 2031 |
0.12139 |
0.1124 |
0.08655 |
103 |
IV. OSMO Professional Investment Strategy and Risk Management
OSMO Investment Methodology
(1) Long-term Holding Strategy
- Target Investors: Cryptocurrency enthusiasts who believe in the long-term development of the Cosmos ecosystem and DeFi protocols
- Operational Recommendations:
- Consider accumulating OSMO during market downturns, particularly when prices approach historical support levels
- Monitor the protocol's governance proposals and participate in key decisions to understand the project's development direction
- Store assets in secure wallets such as Gate Web3 Wallet to ensure private key control and asset security
(2) Active Trading Strategy
- Technical Analysis Tools:
- Moving Averages: Use 50-day and 200-day moving averages to identify trend directions and potential entry/exit points
- Volume Analysis: Monitor 24-hour trading volume changes to assess market participation and liquidity conditions
- Swing Trading Key Points:
- Pay attention to daily price fluctuation ranges, with current 24-hour volatility showing a range between $0.05355 and $0.05872
- Set reasonable stop-loss levels, recommended at 8-12% below entry price to control downside risk
OSMO Risk Management Framework
(1) Asset Allocation Principles
- Conservative Investors: 1-3% of cryptocurrency portfolio
- Aggressive Investors: 5-10% of cryptocurrency portfolio
- Professional Investors: 10-15% of cryptocurrency portfolio, depending on risk assessment and market conditions
(2) Risk Hedging Solutions
- Portfolio Diversification: Allocate across multiple blockchain ecosystems to reduce single-protocol risk
- Position Management: Implement staged entry and exit strategies to avoid concentrating all capital at a single price point
(3) Secure Storage Solutions
- Hot Wallet Recommendation: Gate Web3 Wallet, suitable for users who need frequent trading
- Cold Storage Solution: Consider using hardware wallets for long-term holding to minimize online security risks
- Security Precautions: Never share private keys or mnemonic phrases; enable two-factor authentication; regularly update security software
V. OSMO Potential Risks and Challenges
OSMO Market Risks
- High Volatility: OSMO has experienced a 87.88% decline over the past year, indicating significant price volatility
- Limited Liquidity: With a 24-hour trading volume of approximately $17,875, liquidity may be relatively limited, potentially affecting execution of large orders
- Market Sentiment Impact: As a governance token, OSMO's price is susceptible to overall sentiment in the DeFi sector and the Cosmos ecosystem
OSMO Regulatory Risks
- DeFi Regulatory Uncertainty: Global regulators are increasingly scrutinizing DeFi protocols, which may affect project operations
- Token Classification Issues: Governance tokens may be subject to securities regulations in certain jurisdictions, potentially impacting trading and holdings
- Cross-border Compliance Challenges: Osmosis operates across multiple jurisdictions, facing complex and evolving compliance requirements
OSMO Technical Risks
- Smart Contract Vulnerabilities: AMM protocols involve complex smart contract logic, which may have undiscovered security flaws
- Network Congestion Risk: During peak usage periods, the Cosmos network may experience congestion, affecting transaction efficiency
- Protocol Upgrade Risks: Future protocol upgrades may introduce unforeseen technical issues or community disagreements
VI. Conclusion and Action Recommendations
OSMO Investment Value Assessment
Osmosis (OSMO), as an advanced AMM protocol within the Cosmos ecosystem, provides innovative DeFi infrastructure for developers. Its governance token mechanism offers holders decentralized decision-making rights. However, the project currently faces challenges including a circulating market cap of approximately $41.94 million and a significant year-over-year decline of 87.88%. While the protocol demonstrates technological innovation potential, investors need to carefully consider high volatility and market risks. Long-term value depends on the protocol's ability to continue attracting developers and liquidity, as well as the overall growth of the Cosmos ecosystem.
OSMO Investment Recommendations
✅ Beginners: It is recommended to start with small positions and limit OSMO allocation to no more than 2% of total cryptocurrency portfolio; focus on learning about DeFi mechanisms and Cosmos ecosystem fundamentals before considering increased investment
✅ Experienced Investors: Consider moderate allocation as part of DeFi portfolio diversification; actively monitor protocol governance proposals and technological developments; implement staged entry strategies to reduce timing risk
✅ Institutional Investors: Conduct comprehensive due diligence, including technical audits, legal compliance reviews, and competitive analysis; consider strategic holding positions and participation in protocol governance to enhance investment value
OSMO Trading Participation Methods
- Spot Trading: Purchase OSMO through exchanges such as Gate.com for direct ownership and participation in protocol governance
- Liquidity Provision: Provide liquidity on the Osmosis platform to earn transaction fees and potential token rewards
- Governance Participation: Hold OSMO tokens to participate in protocol governance voting, influencing the project's future development direction
Cryptocurrency investment carries extremely high risks; this article does not constitute investment advice. Investors should make prudent decisions based on their own risk tolerance and are advised to consult professional financial advisors. Never invest more than you can afford to lose.
FAQ
What is OSMO token and what is its current market price?
OSMO is the native token of the Osmosis decentralized exchange protocol, enabling liquidity provision and governance. As of January 19, 2026, OSMO is trading at approximately $0.0581 USD.
What are the main factors that influence OSMO price movements?
OSMO price movements are primarily influenced by DeFi market growth, token swap demand, overall crypto market trends, investor sentiment, and expert market opinions. Trading volume and market dynamics also significantly impact price fluctuations.
OSMO demonstrated strong performance with a 9.85% increase in its first tracked year, closing at $0.6849. The year 2023 marked the best performance period for Osmosis price historically.
What are expert predictions for OSMO price in 2024 and 2025?
Expert predictions indicated OSMO could range $0.75-$0.85 in 2024-2025 period. Analysts expect growth driven by DeFi adoption and ecosystem development, with potential for further appreciation as cross-chain platforms gain traction and liquidity management improves.
How does OSMO compare to other DeFi tokens in terms of value proposition?
OSMO stands out through innovative supply mechanisms and lower fees than competitors like AAVE. However, it exhibits higher price volatility, making it suitable for risk-tolerant investors seeking higher potential returns in the DeFi ecosystem.
What is the total supply and tokenomics of OSMO?
OSMO has a total supply of 1 billion tokens with approximately 300 million in circulation. The tokenomics feature a gradual release schedule designed to support long-term ecosystem development and incentivize network participation through staking and governance rewards.
What are the risks associated with investing in OSMO?
OSMO investment carries significant risks including market volatility, liquidity constraints, and potential capital loss. As a cryptocurrency asset, prices fluctuate dramatically based on market sentiment, regulatory changes, and network adoption. Investors should only allocate funds they can afford to lose completely.
How does the Osmosis protocol development roadmap affect OSMO price outlook?
Osmosis' roadmap enhances utility through Celestia integration, fee economics, MEV capture, and cross-chain security improvements. These developments are expected to increase OSMO's long-term value and market competitiveness.
What technical analysis indicators suggest about OSMO price direction?
OSMO's 14-day RSI at 45.391 indicates a neutral trend with no clear directional bias. Moving averages and trading volume patterns require monitoring for potential breakout signals.
* The information is not intended to be and does not constitute financial advice or any other recommendation of any sort offered or endorsed by Gate.