This comprehensive analysis examines OWL token's price trajectory from 2026 to 2031, providing expert forecasts for this AI-powered cross-chain interoperability protocol. With over 3 million users and 13 million transactions already processed, OWL demonstrates significant adoption potential. The article reviews market positioning at $30.55M market cap, analyzes historical price movements, and presents layered price predictions ranging from conservative to optimistic scenarios. Key investment strategies include long-term holding for infrastructure exposure and active trading approaches, while detailed risk management frameworks address market volatility, liquidity concerns, and regulatory uncertainties. Investors gain actionable insights into position sizing, storage solutions via Gate Web3 Wallet, and comprehensive guidance for different investor profiles seeking exposure to cross-chain innovation.
Introduction: OWL's Market Position and Investment Value
Owlto Finance (OWL), as an AI-powered interoperability protocol dedicated to cross-chain liquidity expansion and scalability for native tokens, stablecoins, and real-world assets (RWA), has achieved significant milestones since its launch in 2026. As of January 2026, OWL has reached a market capitalization of approximately $30.55 million, with a circulating supply of around 330 million tokens, and its price maintained at approximately $0.09257. This asset, recognized as a "fast, low-cost, and secure cross-chain solution," is playing an increasingly critical role in the blockchain interoperability sector.
Owlto Finance has demonstrated impressive on-chain traction, reaching over 3 million users across more than 200 countries and regions, and completing over 13 million transactions. The project has secured backing from renowned investment institutions including Matrixport, Bixin Ventures, CEIC, Presto Labs, Skyland, Blocore, and SNZ, reflecting strong confidence in its technological infrastructure and market potential.
This article will comprehensively analyze OWL's price trajectory from 2026 to 2031, incorporating historical patterns, market supply and demand dynamics, ecosystem development, and macroeconomic conditions to provide investors with professional price forecasts and practical investment strategies.
I. OWL Price History Review and Market Status
OWL Historical Price Evolution Trajectory
- January 2026: Token launch and initial market entry, price established initial trading range between $0.04452 and $0.12642
- January 15, 2026: Price reached all-time low at $0.04452, reflecting early market volatility
- January 16, 2026: Price peaked at all-time high of $0.12642, demonstrating significant upward momentum
OWL Current Market Situation
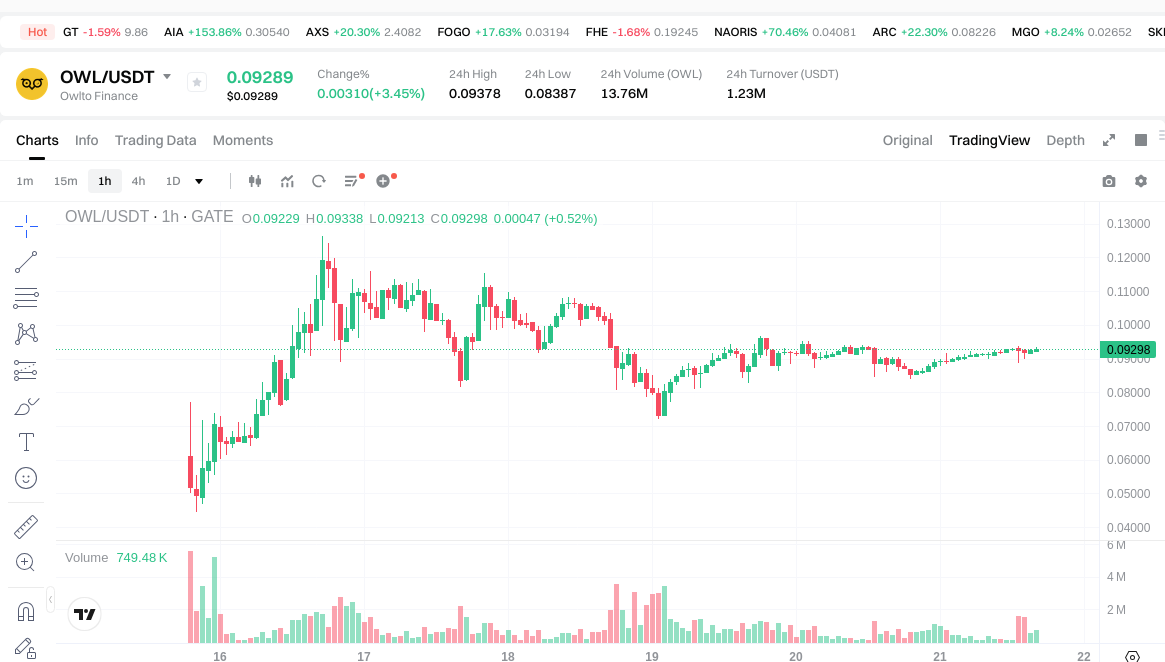
As of January 21, 2026, OWL is trading at $0.09257, showing a 24-hour increase of 3.7% and a 7-day gain of 30.16%. The token maintains a market capitalization of approximately $30.55 million with a circulating supply of 330 million tokens, representing 16.5% of the maximum supply of 2 billion tokens. The fully diluted market cap stands at $185.14 million.
The 24-hour trading volume reaches $1.23 million, with price fluctuating between $0.08387 and $0.09378 during this period. The token holder base has grown to 81,966 addresses, indicating expanding community adoption. Market sentiment currently shows extreme fear with a volatility index of 24.
OWL operates on the BSC (BEP-20) standard with its contract address at 0x51e667e91b4b8cb8e6e0528757f248406bd34b57. The token is listed on 11 exchanges and maintains an active trading presence on Gate.com.
Click to view current OWL market price
OWL Market Sentiment Index
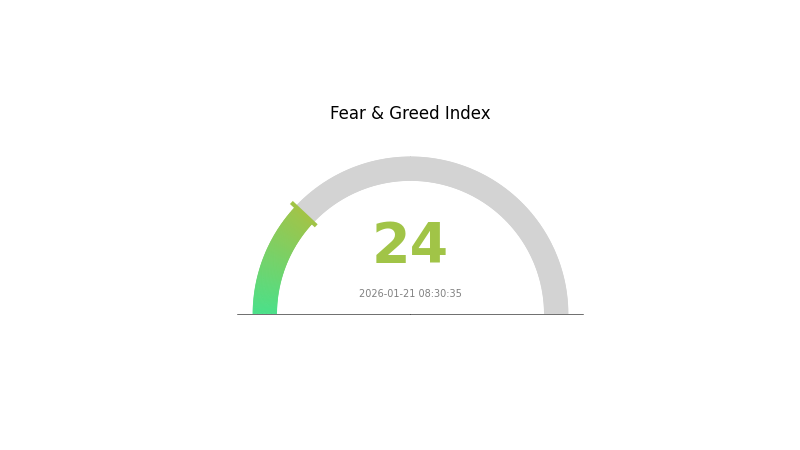
2026-01-21 Fear and Greed Index: 24 (Extreme Fear)
Click to view current Fear & Greed Index
The cryptocurrency market is experiencing extreme fear, with the index standing at 24. This reading indicates heightened pessimism and risk aversion among investors. Such extreme fear levels typically present contrarian trading opportunities, as markets tend to overcorrect during panic phases. Investors should remain cautious and avoid impulsive decisions during volatile periods. Consider dollar-cost averaging strategies to mitigate timing risk. Monitor key support levels and maintain a long-term perspective on your investment thesis during such extreme sentiment extremes.
OWL Holding Distribution
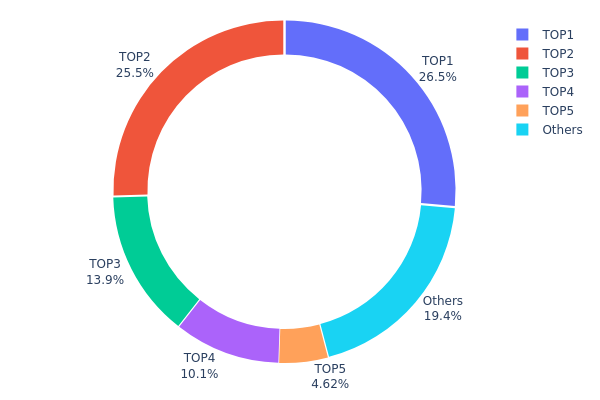
The holding distribution chart illustrates the allocation of token supply across different wallet addresses, providing insights into the decentralization level and concentration risk of a cryptocurrency. By analyzing the proportion of tokens held by top addresses versus the broader community, investors can assess potential market manipulation risks and overall network health.
Based on the current data, OWL demonstrates a highly concentrated holding structure. The top address controls 26.47% of the total supply (approximately 86 million tokens), while the second-largest holder possesses 25.48% (82.79 million tokens). Together, the top two addresses account for over 51% of the entire circulating supply. When expanding the analysis to the top five addresses, the concentration reaches an alarming 80.54%, leaving only 19.46% distributed among other market participants. This extreme centralization poses significant concerns for market stability and fair price discovery.
Such concentrated holdings create substantial risks for OWL investors. Large holders, often referred to as "whales," possess disproportionate influence over price movements and can trigger severe volatility through coordinated selling or buying activities. The current distribution suggests limited decentralization, making the token vulnerable to potential price manipulation and creating an asymmetric power dynamic within the ecosystem. Additionally, this concentration pattern indicates weak community participation and may reflect early-stage distribution characteristics where founding teams, venture capitalists, or strategic partners retain dominant positions. For potential investors, this structure warrants careful consideration regarding liquidity risks and the genuine decentralization of the project's governance and economic model.
Click to view current OWL Holding Distribution
| Top |
Address |
Holding Qty |
Holding (%) |
| 1 |
0xa687...1e51f3 |
85999.99K |
26.47% |
| 2 |
0xee9b...607581 |
82786.67K |
25.48% |
| 3 |
0x22d7...c68268 |
45256.38K |
13.93% |
| 4 |
0x3e4f...124c5e |
32666.67K |
10.05% |
| 5 |
0xd9bf...c90860 |
15000.01K |
4.61% |
| - |
Others |
63083.59K |
19.46% |
II. Core Factors Influencing OWL's Future Price
Due to the lack of available data regarding OWL's supply mechanisms, institutional dynamics, macroeconomic influences, and technical developments, a comprehensive analysis cannot be provided at this time. As more information becomes available about OWL's tokenomics, adoption trends, and ecosystem growth, these factors will play a crucial role in shaping its price trajectory.
Investors interested in OWL should monitor official announcements, on-chain data, and market sentiment indicators to better understand the potential price drivers as the project evolves.
III. 2026-2031 OWL Price Prediction
2026 Outlook
- Conservative prediction: $0.07055 - $0.09283
- Neutral prediction: Around $0.09283
- Optimistic prediction: Up to $0.10954 (requires favorable market conditions and increased adoption)
2027-2029 Outlook
- Market stage expectation: The token is anticipated to enter a gradual growth phase, with price movements reflecting broader market sentiment and project developments
- Price range prediction:
- 2027: $0.085 - $0.1285 (approximately 8% increase from 2026)
- 2028: $0.08958 - $0.14011 (approximately 23% increase from 2026)
- 2029: $0.10198 - $0.18867 (approximately 36% increase from 2026)
- Key catalysts: Potential ecosystem expansion, technological improvements, and evolving market dynamics could support upward price trajectory during this period
2030-2031 Long-term Outlook
- Baseline scenario: $0.1312 - $0.17862 in 2030 (assuming sustained market interest and steady development progress)
- Optimistic scenario: $0.09596 - $0.23569 in 2031 (assuming accelerated adoption and favorable regulatory environment)
- Transformative scenario: Prices reaching the upper range of predictions (contingent upon significant ecosystem breakthroughs and mainstream acceptance)
- 2026-01-21: OWL shows a projected average price of $0.09283 in 2026 (representing the baseline for future growth expectations)
| Year |
Predicted High Price |
Predicted Average Price |
Predicted Low Price |
Price Change |
| 2026 |
0.10954 |
0.09283 |
0.07055 |
0 |
| 2027 |
0.1285 |
0.10118 |
0.085 |
8 |
| 2028 |
0.14011 |
0.11484 |
0.08958 |
23 |
| 2029 |
0.18867 |
0.12748 |
0.10198 |
36 |
| 2030 |
0.17862 |
0.15807 |
0.1312 |
69 |
| 2031 |
0.23569 |
0.16835 |
0.09596 |
80 |
IV. OWL Professional Investment Strategy and Risk Management
OWL Investment Methodology
(I) Long-Term Holding Strategy
- Suitable for: Investors seeking exposure to cross-chain infrastructure and AI-powered interoperability solutions
- Operational Recommendations:
- Consider accumulating OWL during market corrections, given its 16.5% circulating supply ratio, which may indicate controlled token release schedules
- Monitor the project's growth in user adoption, as the platform has already served over 3 million users across 200+ countries
- Storage Solution: Use Gate Web3 Wallet for secure storage, enabling access to cross-chain features while maintaining custody of private keys
(II) Active Trading Strategy
- Technical Analysis Tools:
- Volume Analysis: Track the 24-hour trading volume of $1.23M to identify liquidity patterns and potential breakout signals
- Price Range Monitoring: Observe support near $0.08387 (24h low) and resistance around $0.09378 (24h high) for short-term trading opportunities
- Swing Trading Key Points:
- Pay attention to the 30.16% weekly gain, which suggests strong momentum that may attract profit-taking behavior
- Consider the 16.5% market cap to FDV ratio when evaluating potential dilution risks from future token unlocks
OWL Risk Management Framework
(I) Asset Allocation Principles
- Conservative Investors: 1-3% of crypto portfolio allocation
- Aggressive Investors: 5-8% of crypto portfolio allocation
- Professional Investors: Up to 10% with active hedging strategies
(II) Risk Hedging Solutions
- Position Sizing: Implement gradual entry strategies across multiple price levels to reduce timing risk
- Stop-Loss Implementation: Set protective stops 10-15% below entry points to limit downside exposure
(III) Secure Storage Solutions
- Hot Wallet Option: Gate Web3 Wallet for active trading and cross-chain operations
- Cold Storage Solution: Consider hardware wallet solutions for long-term holdings exceeding $10,000
- Security Precautions: Enable two-factor authentication, verify contract address (0x51e667e91b4b8cb8e6e0528757f248406bd34b57 on BSC) before transactions, and never share private keys
V. OWL Potential Risks and Challenges
OWL Market Risks
- Volatility Exposure: Recent price movement shows significant fluctuation, with 24-hour change of 3.7% and weekly gain of 30.16%, indicating potential for sharp reversals
- Liquidity Concerns: With 11 exchanges listing OWL and $1.23M in 24-hour volume, liquidity may be limited during market stress periods
- Market Cap Concentration: At a market ranking of 709 and 0.0058% dominance, OWL remains a smaller-cap asset subject to higher volatility
OWL Regulatory Risks
- Cross-Chain Compliance: As an interoperability protocol facilitating transfers across multiple blockchains, OWL may face evolving regulatory scrutiny regarding cross-border transactions
- RWA Integration Uncertainty: The protocol's focus on real-world asset tokenization operates in a regulatory landscape that continues to develop globally
- Jurisdictional Variations: With users in 200+ countries, compliance with diverse regional regulations presents ongoing operational challenges
OWL Technical Risks
- Smart Contract Vulnerabilities: As a BSC-based token (BEP-20), OWL depends on the security of its contract implementation and the underlying blockchain infrastructure
- Cross-Chain Bridge Risks: The protocol's core functionality of enabling cross-chain transfers introduces potential attack vectors related to bridge security
- Scalability Challenges: Supporting 13 million+ transactions across multiple chains requires robust technical infrastructure that may face stress during peak demand periods
VI. Conclusion and Action Recommendations
OWL Investment Value Assessment
Owlto Finance presents a compelling infrastructure play in the cross-chain interoperability sector, backed by notable investors including Matrixport and Bixin Ventures. The protocol's traction of 3 million+ users and 13 million+ transactions demonstrates real adoption. However, investors should weigh the project's growth potential against its current 16.5% circulating supply, market volatility evidenced by recent 30%+ weekly gains, and the technical complexities inherent in cross-chain operations. The long-term value proposition centers on capturing liquidity flows in an increasingly multi-chain ecosystem, while short-term risks include price volatility and execution risks associated with early-stage protocols.
OWL Investment Recommendations
✅ Beginners: Start with small allocations (1-2% of portfolio), focus on understanding the cross-chain ecosystem, and use Gate Web3 Wallet for simplified management
✅ Experienced Investors: Consider 3-5% allocation with active monitoring of protocol development, user growth metrics, and token unlock schedules
✅ Institutional Investors: Evaluate strategic positioning with 5-8% allocation, conduct thorough due diligence on smart contract audits, and implement comprehensive risk management frameworks
OWL Trading Participation Methods
- Spot Trading: Trade OWL on Gate.com and 10 other exchanges, with attention to liquidity depth before executing large orders
- Gradual Accumulation: Use dollar-cost averaging to build positions over time, mitigating timing risk in a volatile market
- Cross-Chain Utilization: Engage with Owlto Finance's protocol features to gain firsthand experience with the platform's utility and user experience
Cryptocurrency investment carries extremely high risks, and this article does not constitute investment advice. Investors should make cautious decisions based on their own risk tolerance and are advised to consult professional financial advisors. Never invest more than you can afford to lose.
FAQ
What is OWL token? What are its uses?
OWL is a governance and utility token designed for decentralized prediction and price forecasting within the Web3 ecosystem. It enables holders to participate in voting, access premium prediction features, and earn rewards through platform participation and liquidity provision.
What factors affect OWL price?
OWL price is influenced by market demand, trading volume, project development progress, ecosystem adoption, investor sentiment, and overall cryptocurrency market conditions. Technological upgrades and partnership announcements also impact price movements significantly.
How to analyze and predict OWL's future price trends?
Analyze OWL's price trends by monitoring trading volume, market sentiment, technical indicators like moving averages and RSI, on-chain metrics, project developments, and overall crypto market conditions. Track historical price patterns, support and resistance levels, and community engagement to forecast potential price movements.
What distinguishes OWL from other similar tokens?
OWL stands out through its innovative tokenomics, superior liquidity depth, and advanced predictive mechanisms. It offers lower transaction fees, faster settlement speeds, and stronger community governance compared to competing tokens, delivering enhanced value for price prediction enthusiasts.
What are the risks to pay attention to when investing in OWL tokens?
OWL token investments carry market volatility risks, liquidity fluctuations, and regulatory uncertainties. Smart contract vulnerabilities, project execution risks, and macroeconomic factors may impact token value. Conduct thorough research before investing.
* The information is not intended to be and does not constitute financial advice or any other recommendation of any sort offered or endorsed by Gate.