This comprehensive article provides expert price analysis and market forecasts for Particle Network (PARTI) from 2026 through 2031. PARTI, a leading chain abstraction infrastructure addressing multi-blockchain fragmentation, is analyzed through historical performance review, current market sentiment, and detailed price predictions. The article outlines PARTI's market position at $0.08994 with $20.96M market cap and offers conservative to optimistic price scenarios across the forecast period. Professional investment strategies including long-term holding and active trading approaches are detailed alongside critical risk management frameworks suited to different investor profiles. Investors learn secure storage solutions via Gate Web3 Wallet, technical analysis tools, and comprehensive risk assessment covering market volatility, liquidity constraints, regulatory uncertainties, and technical challenges. The analysis concludes with actionable recommendations for beginners through institutional investors seeking W
Introduction: PARTI's Market Position and Investment Value
Particle Network (PARTI) serves as a leading chain abstraction infrastructure in the Web3 ecosystem, addressing the critical challenge of user, data, and liquidity fragmentation across multiple blockchain networks through its core Universal Accounts technology. Since its launch in 2025, the project has established itself as a significant player in the multi-chain infrastructure space, attracting over 171,024 holders and achieving listing on 37 exchanges. As of January 23, 2026, PARTI maintains a market capitalization of approximately $20.96 million, with a circulating supply of 233 million tokens out of a maximum supply of 1 billion, trading at around $0.08994.
This asset, recognized for its innovative approach to chain abstraction and unified account management, is playing an increasingly vital role in streamlining user experience across the fragmented blockchain landscape. Despite experiencing notable price fluctuations since its all-time high earlier in 2025, PARTI continues to represent a compelling case study in infrastructure-focused blockchain projects.
This article will comprehensively analyze PARTI's price trajectory from 2026 through 2031, combining historical patterns, market supply-demand dynamics, ecosystem development milestones, and macroeconomic factors to provide investors with professional price forecasts and practical investment strategies.
I. PARTI Price History Review and Market Status
PARTI Historical Price Evolution Trajectory
- 2025: Token launched in March with an initial offering price of $0.15, experiencing significant volatility throughout the year
- 2025: Reached a notable price level of $0.44305 in March, marking a strong initial market performance
- 2025: Experienced considerable price decline from the peak level to $0.03239 by October, reflecting broader market adjustments
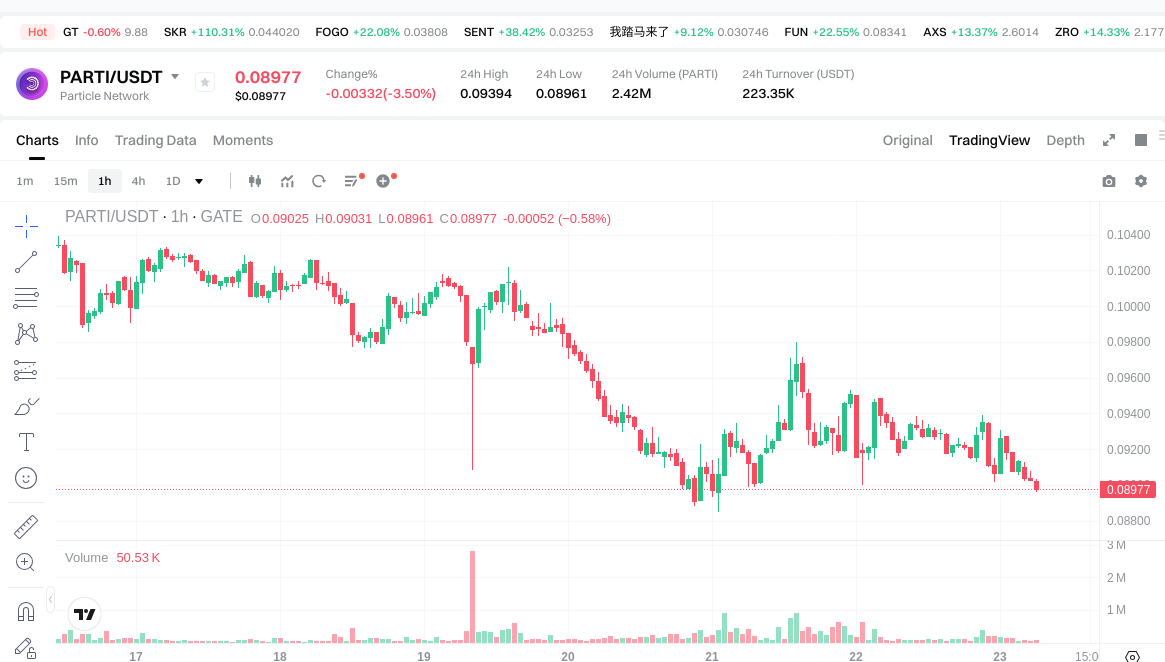
PARTI Current Market Situation
As of January 23, 2026, PARTI is trading at $0.08994, representing a decline across multiple timeframes. The token has shown a decrease of 0.76% over the past hour, 3.84% over 24 hours, and 12.4% over the past week. The 30-day performance indicates an 8.45% decrease, while the year-over-year comparison shows a significant decline of 78.17%.
The 24-hour trading range spans from $0.08986 to $0.09394, with a total trading volume of $221,209.75. The current market capitalization stands at approximately $20.96 million, with 233 million tokens in circulation out of a maximum supply of 1 billion tokens, representing a 23.3% circulation ratio. The fully diluted market capitalization is calculated at $89.94 million.
PARTI maintains a market share of 0.0028% and is listed on 37 exchanges, with a holder base of 171,024 addresses. The current market sentiment index indicates a reading of 20, corresponding to extreme fear conditions in the broader cryptocurrency market. The token has established contract addresses on BSC and BASE networks.
Click to view current PARTI market price
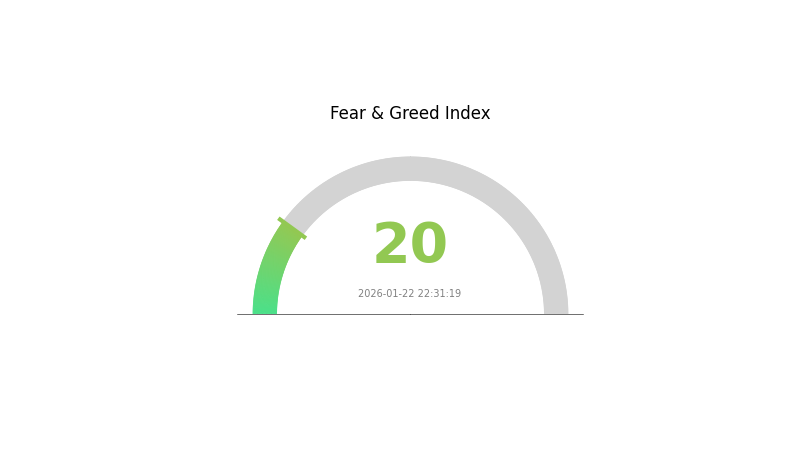
PART I Market Sentiment Indicator
2026-01-22 Fear and Greed Index: 20 (Extreme Fear)
Click to view current Fear & Greed Index
The cryptocurrency market is currently experiencing extreme fear, with the Fear and Greed Index standing at just 20 points. This exceptionally low reading indicates widespread investor pessimism and heightened market anxiety. During such periods, panic selling often intensifies, and market volatility reaches elevated levels. Contrarian investors may view this as a potential buying opportunity, as extreme fear historically precedes market recovery. However, risk management remains crucial, and investors should exercise caution while monitoring key support levels and market fundamentals closely.
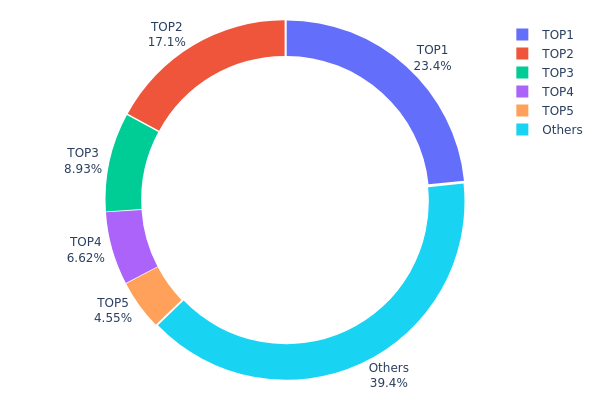
PARTI Holding Distribution
The holding distribution chart reflects the allocation of token supply across different wallet addresses, serving as a key indicator of decentralization levels and concentration risks. By analyzing the proportion of holdings among top addresses, we can assess potential market manipulation risks and the overall health of on-chain structure.
Based on current data, PARTI exhibits a relatively concentrated holding pattern. The top five addresses collectively hold 60.57% of the total supply, with the largest single address controlling 23.38% (108,900.07K tokens). The second-largest holder possesses 17.12%, while the third through fifth addresses hold 8.92%, 6.61%, and 4.54% respectively. The remaining 39.43% is distributed among other addresses, indicating that a significant portion of the supply remains concentrated within a small number of wallets.
This concentration level suggests moderate centralization risks. When major holders control over 60% of supply, their trading decisions can significantly impact market liquidity and price stability. Large-scale sell-offs by top addresses could trigger substantial price volatility, while coordinated actions among these holders might enable market manipulation. However, the fact that nearly 40% remains distributed among smaller addresses provides some buffer against extreme centralization. From a market structure perspective, this distribution pattern reflects a project still in its early stages, where founding teams, early investors, or strategic partners maintain substantial positions. Investors should monitor on-chain movements of these major addresses and assess whether gradual distribution improvements occur over time to enhance decentralization and market stability.
Click to view current PARTI Holding Distribution
| Top |
Address |
Holding Qty |
Holding (%) |
| 1 |
0x3b27...e57830 |
108900.07K |
23.38% |
| 2 |
0x5a52...70efcb |
79754.75K |
17.12% |
| 3 |
0xf977...41acec |
41562.75K |
8.92% |
| 4 |
0x7aaa...9c1471 |
30810.00K |
6.61% |
| 5 |
0xc312...303878 |
21165.66K |
4.54% |
| - |
Others |
183468.19K |
39.43% |
II. Core Factors Influencing PARTI's Future Price
Based on the available materials, there is insufficient specific information regarding PARTI's supply mechanisms, institutional dynamics, macroeconomic positioning, or technical development roadmap. Without concrete data on tokenomics, major holder activities, monetary policy correlations, or ecosystem developments, a comprehensive analysis of price-influencing factors cannot be accurately constructed at this time.
For traders and investors interested in PARTI, it is recommended to monitor official project announcements and verified on-chain data through reliable sources before making investment decisions.
III. 2026-2031 PARTI Price Prediction
2026 Outlook
- Conservative forecast: $0.07632 - $0.08979
- Neutral forecast: $0.08979
- Optimistic forecast: $0.12032 (requires favorable market conditions)
2027-2029 Outlook
- Market stage expectation: Moderate growth phase with increasing volatility
- Price range forecast:
- 2027: $0.10085 - $0.13342
- 2028: $0.06558 - $0.15382
- 2029: $0.06963 - $0.16247
- Key catalysts: Market adoption trends and ecosystem development
2030-2031 Long-term Outlook
- Baseline scenario: $0.14202 - $0.1495 (assuming steady market conditions)
- Optimistic scenario: $0.17756 - $0.18239 (assuming enhanced adoption)
- Transformative scenario: Above $0.18239 (under exceptionally favorable conditions)
- 2026-01-23: PARTI shows early-stage development with potential for gradual appreciation over the forecast period
| Year |
Predicted High Price |
Predicted Average Price |
Predicted Low Price |
Price Change |
| 2026 |
0.12032 |
0.08979 |
0.07632 |
0 |
| 2027 |
0.13342 |
0.10505 |
0.10085 |
16 |
| 2028 |
0.15382 |
0.11924 |
0.06558 |
32 |
| 2029 |
0.16247 |
0.13653 |
0.06963 |
51 |
| 2030 |
0.18239 |
0.1495 |
0.14202 |
66 |
| 2031 |
0.17756 |
0.16594 |
0.10122 |
84 |
IV. PARTI Professional Investment Strategies and Risk Management
PARTI Investment Methodology
(I) Long-term Holding Strategy
- Suitable for: Investors seeking exposure to Web3 chain abstraction infrastructure with medium to long-term horizons
- Operational Recommendations:
- Consider gradual accumulation during market consolidation phases, particularly when prices approach technical support levels
- Monitor project development milestones, including Universal Accounts adoption metrics and ecosystem expansion announcements
- Storage Solution: Utilize Gate Web3 Wallet for secure asset custody, enabling both storage and potential participation in ecosystem activities
(II) Active Trading Strategy
- Technical Analysis Tools:
- Volume Analysis: Monitor 24-hour trading volume (currently $221,209.75) to identify accumulation or distribution patterns
- Support and Resistance Levels: Track key price zones, with recent 24-hour range between $0.08986 (low) and $0.09394 (high)
- Swing Trading Key Points:
- Consider volatility patterns, noting recent 7-day decline of 12.4% and 30-day decline of 8.45%
- Implement stop-loss mechanisms to manage downside risk in volatile market conditions
PARTI Risk Management Framework
(I) Asset Allocation Principles
- Conservative Investors: 1-3% of crypto portfolio allocation
- Aggressive Investors: 5-8% of crypto portfolio allocation
- Professional Investors: Up to 10-15% with active risk monitoring
(II) Risk Hedging Solutions
- Portfolio Diversification: Balance PARTI holdings with established assets to mitigate sector-specific risks
- Position Sizing: Scale positions according to market capitalization ($20.96M) and liquidity metrics
(III) Secure Storage Solutions
- Hot Wallet Recommendation: Gate Web3 Wallet for active trading and ecosystem participation
- Cold Storage Solution: Consider hardware wallet solutions for long-term holdings exceeding active trading requirements
- Security Considerations: Enable two-factor authentication, regularly update security protocols, and never share private keys or seed phrases
V. PARTI Potential Risks and Challenges
PARTI Market Risks
- Price Volatility: Token has experienced a 78.17% decline over one year, indicating high volatility potential
- Liquidity Constraints: With market capitalization of $20.96M and circulating supply representing 23.3% of maximum supply, liquidity may be limited during high-volume trading periods
- Market Sentiment Dependency: Performance correlation with broader Web3 infrastructure sector trends and overall crypto market conditions
PARTI Regulatory Risks
- Jurisdictional Uncertainty: Evolving regulatory frameworks for Web3 infrastructure projects across different jurisdictions may impact operational scope
- Compliance Requirements: Potential future regulatory requirements for chain abstraction technologies could affect project development roadmap
- Cross-chain Regulatory Complexity: Multi-chain operational model may face varied regulatory interpretations across different blockchain ecosystems
PARTI Technical Risks
- Smart Contract Vulnerabilities: As with any blockchain-based project, potential security vulnerabilities in smart contract implementations require ongoing audits
- Technological Competition: Rapid evolution in chain abstraction and account abstraction technologies may introduce competitive pressures
- Integration Complexity: Universal Accounts technology requires successful integration with multiple blockchain networks, creating potential technical dependencies
VI. Conclusion and Action Recommendations
PARTI Investment Value Assessment
Particle Network addresses a critical pain point in Web3 infrastructure through its Universal Accounts technology, targeting the fragmentation challenge across multiple blockchains. The project's focus on chain abstraction positions it within a growing sector of blockchain infrastructure development. However, investors should carefully consider the significant price volatility evidenced by the 78.17% one-year decline and the project's relatively modest market capitalization of $20.96M. The circulating supply of 23.3% suggests potential future token unlock events that could impact price dynamics. Long-term value proposition depends on successful adoption of Universal Accounts technology and continued ecosystem expansion, while short-term risks include market volatility, liquidity constraints, and competitive pressures in the evolving Web3 infrastructure landscape.
PARTI Investment Recommendations
✅ Beginners: Start with minimal allocation (0.5-1% of crypto portfolio) and focus on understanding the chain abstraction concept and project fundamentals before increasing exposure
✅ Experienced Investors: Consider 3-5% allocation with active monitoring of development milestones, token unlock schedules, and ecosystem adoption metrics
✅ Institutional Investors: Conduct comprehensive due diligence on technology architecture, team credentials, and competitive positioning; consider phased entry strategy aligned with project development milestones
PARTI Trading Participation Methods
- Spot Trading: Available on Gate.com and 36 other exchanges, providing multiple liquidity options for entry and exit
- Dollar-Cost Averaging: Implement systematic accumulation strategy to mitigate timing risk in volatile market conditions
- Portfolio Integration: Consider PARTI as part of broader Web3 infrastructure allocation alongside complementary technologies
Cryptocurrency investment carries extremely high risks, and this article does not constitute investment advice. Investors should make prudent decisions based on their own risk tolerance and are advised to consult professional financial advisors. Never invest more than you can afford to lose.
FAQ
What is the historical price trend of PARTI token and what is the current market price?
PARTI token has demonstrated strong growth momentum throughout 2025, rising from initial levels to establish itself as a prominent asset in the prediction market sector. Current market valuation reflects increased adoption and ecosystem expansion, with trading volume reaching significant levels as investor interest strengthens.
What are the main factors affecting PARTI price?
PARTI price is primarily influenced by market demand and trading volume, project development progress, overall crypto market sentiment, tokenomics changes, and community engagement levels. Regulatory developments and macroeconomic factors also play significant roles in price movements.
How to conduct price prediction analysis for PARTI tokens and what analytical methods are available?
Analyze PARTI through multiple methods: technical analysis using chart patterns and indicators, fundamental analysis of tokenomics and adoption, market sentiment tracking, trading volume trends, and on-chain metrics. Combine historical price data, developer activity, and community growth for comprehensive prediction insights.
How is the market liquidity and trading volume of PARTI tokens?
PARTI tokens maintain strong market liquidity with consistent daily trading activity. The token demonstrates robust trading volume across multiple platforms, ensuring efficient price discovery and minimal slippage for traders engaging in the ecosystem.
What are the risks to pay attention to when investing in PARTI tokens?
PARTI token risks include market volatility, liquidity fluctuations, regulatory uncertainties, smart contract vulnerabilities, and project execution risks. Price may fluctuate significantly based on market conditions and adoption rates. Investors should conduct thorough research before participation.
What are PARTI token's future development prospects and application scenarios?
PARTI token drives decentralized AI prediction markets and creative content platforms. Future applications include AI-powered asset pricing, community governance expansion, and Web3 entertainment integration. Strong institutional adoption and ecosystem growth signal significant long-term value appreciation potential.
* The information is not intended to be and does not constitute financial advice or any other recommendation of any sort offered or endorsed by Gate.