This comprehensive analysis examines Marlin Protocol's POND token through a six-year forecast lens from 2026 to 2031. The article evaluates POND's current market position at $0.00369 with $30.27 million market cap, traces historical price evolution from its $0.323362 all-time high in December 2020, and projects price ranges across multiple scenarios: conservative to optimistic forecasts for each year. Core sections cover market sentiment analysis, token holding distribution showing 69.68% concentration among top five addresses, and identification of key growth catalysts including ecosystem expansion and technological upgrades. The article provides actionable investment strategies for different investor profiles, implements comprehensive risk management frameworks, and addresses regulatory and technical challenges. Investment recommendations span beginner-friendly spot trading on Gate.com to institutional-level due diligence protocols, emphasizing portfolio allocation guidelines and secure custody solutions fo
Introduction: POND's Market Position and Investment Value
Marlin (POND), serving as an open protocol providing high-performance programmable network infrastructure for DeFi and Web 3.0, has been developing its ecosystem since its launch in December 2020. As of January 2026, Marlin holds a market capitalization of approximately $30.27 million, with a circulating supply of around 8.2 billion tokens, and the price maintains at approximately $0.00369. This asset, positioned as a foundational infrastructure provider for decentralized networks, is playing an increasingly significant role in the Web3 ecosystem through its governance mechanisms, protocol incentives, and staking requirements.
This article will comprehensively analyze POND's price trajectory from 2026 to 2031, combining historical patterns, market supply and demand dynamics, ecosystem development, and macroeconomic environment factors to provide investors with professional price forecasts and practical investment strategies.
I. POND Price History Review and Market Status
POND Historical Price Evolution Trajectory
- December 2020: POND reached its all-time high of $0.323362 on December 22, 2020, shortly after its launch on December 21, 2020, with an initial listing price of $0.008
- 2021-2025: The token experienced a prolonged downward trend, declining from its peak levels as market conditions evolved
- January 2026: POND recorded its all-time low of $0.00358793 on January 21, 2026, representing a decline from its historical peak
POND Current Market Situation
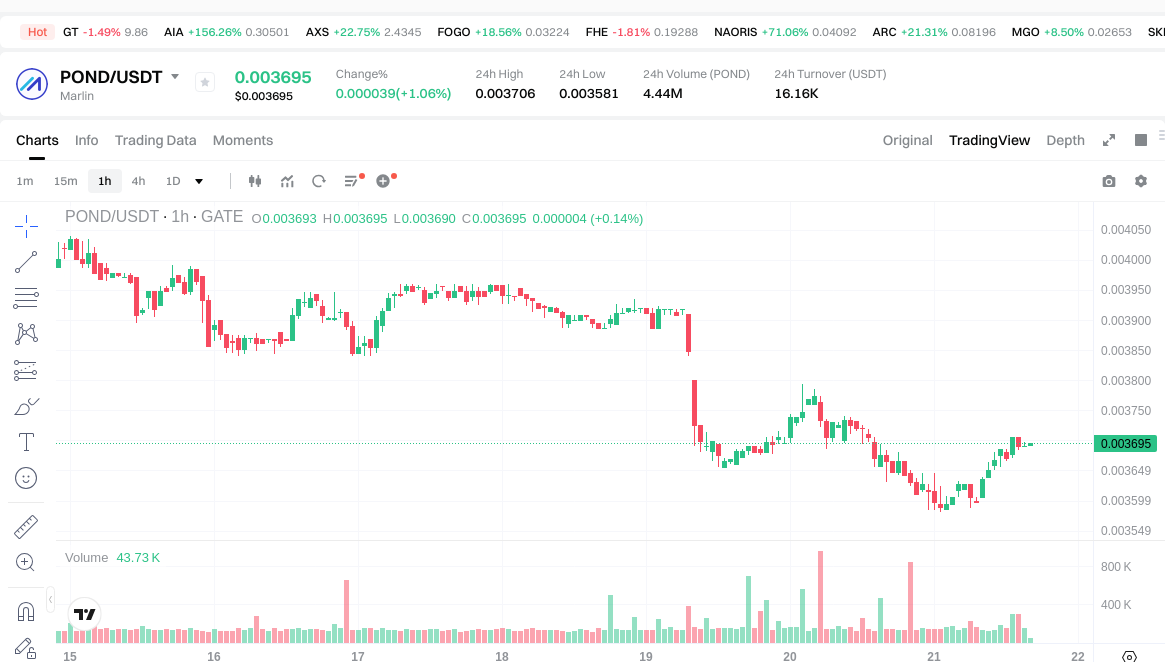
As of January 21, 2026, POND is trading at $0.00369, showing a modest 24-hour gain of 0.68%. The token has demonstrated mixed short-term performance, with a 1-hour decline of 0.22%, while experiencing more substantial losses over longer timeframes, including an 8.3% decrease over the past 7 days and a 7.43% decline over the past 30 days.
The current market capitalization stands at approximately $30.27 million, with POND ranking 713th among cryptocurrencies and holding a 0.0011% market dominance. The 24-hour trading volume registers at $16,173.93, indicating moderate market activity. With 8.2 billion tokens in circulation out of a maximum supply of 10 billion, the circulating supply represents 82.02% of the total supply. The fully diluted market cap is approximately $36.9 million.
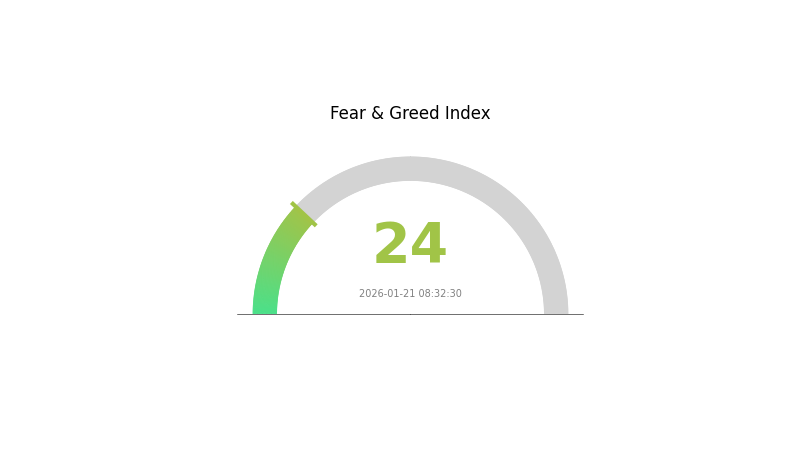
POND's 24-hour price range spans from $0.003581 to $0.003706. The token is available for trading on 22 exchanges and has a holder base of 11,258 addresses. The market sentiment index currently stands at 24, indicating an "Extreme Fear" level in the broader market environment.
Click to view the current POND market price
POND Market Sentiment Index
January 21, 2026 - Fear and Greed Index: 24 (Extreme Fear)
Click to view the current Fear & Greed Index
The cryptocurrency market is currently experiencing extreme fear, with the Fear and Greed Index standing at 24. This indicates significant market pessimism and heightened risk aversion among investors. During such periods, volatility typically increases as traders reassess positions and market sentiment becomes increasingly bearish. Investors should exercise caution and consider their risk tolerance carefully. This environment may present both opportunities and challenges depending on individual investment strategies and time horizons.
POND Holding Distribution
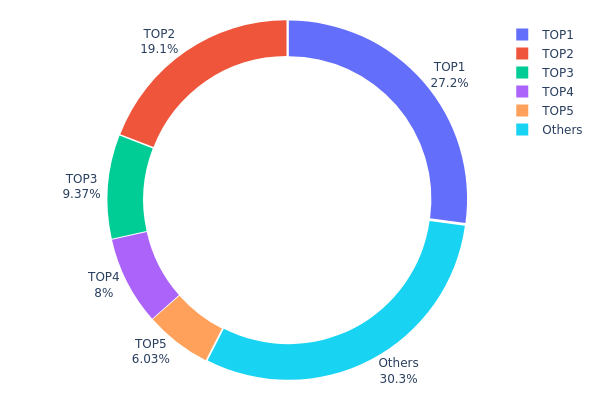
The holding distribution chart reveals the concentration of POND tokens across different wallet addresses, providing insights into the token's centralization level and potential market manipulation risks. As of January 21, 2026, the data shows a relatively concentrated holding pattern, with the top 5 addresses controlling approximately 69.68% of the total token supply.
The top holder (0xcee2...97180d) possesses 2,717,145.49K POND tokens, representing 27.17% of the total supply, while the second-largest holder (0xe5fe...9ebecc) controls 19.12%. The third through fifth positions hold 9.37%, 8.00%, and 6.02% respectively. This concentration pattern indicates a moderate level of centralization, which could potentially introduce volatility risks during large-scale token movements. The remaining 30.32% is distributed among other addresses, suggesting some degree of wider market participation, though the dominance of major holders remains significant.
From a market structure perspective, this distribution pattern presents both opportunities and risks. The concentrated holdings could lead to increased price volatility if major holders decide to liquidate their positions or engage in significant trading activities. However, it may also suggest strategic long-term holding by institutional investors or project stakeholders. The current distribution reflects a semi-centralized ecosystem structure, where token movements by top holders could substantially impact market liquidity and price discovery mechanisms on platforms like Gate.com, warranting careful monitoring by investors and traders.
Click to view current POND Holding Distribution
| Top |
Address |
Holding Qty |
Holding (%) |
| 1 |
0xcee2...97180d |
2717145.49K |
27.17% |
| 2 |
0xe5fe...9ebecc |
1912624.02K |
19.12% |
| 3 |
0xaba3...8f2f4e |
937035.84K |
9.37% |
| 4 |
0xf977...41acec |
800000.00K |
8.00% |
| 5 |
0x7f75...14edf9 |
602774.07K |
6.02% |
| - |
Others |
3030420.58K |
30.32% |
II. Core Factors Influencing POND's Future Price
Based on the available information, there is insufficient data to provide a comprehensive analysis of the core factors that may influence POND's future price. The reference materials do not contain specific information regarding supply mechanisms, institutional dynamics, macroeconomic environments, or technical developments related to POND.
To make informed investment decisions regarding POND, investors should conduct independent research through official project channels, verified blockchain explorers, and reputable cryptocurrency analysis platforms. Key areas to investigate would include tokenomics structure, development roadmap updates, partnership announcements, and broader market conditions affecting the DeFi and Web3 sectors.
For trading POND and accessing real-time market data, users can visit Gate.com, which provides comprehensive trading tools and market analytics for cryptocurrency investors.
III. 2026-2031 POND Price Prediction
2026 Outlook
- Conservative Forecast: $0.00307 - $0.0037
- Neutral Forecast: Around $0.0037
- Optimistic Forecast: Up to $0.00525 (requires favorable market sentiment and increased platform adoption)
2027-2029 Mid-term Outlook
- Market Stage Expectation: The token may experience gradual growth as the ecosystem matures, with potential fluctuations reflecting broader crypto market cycles and protocol development milestones.
- Price Range Forecast:
- 2027: $0.00277 - $0.00478, average around $0.00447
- 2028: $0.00245 - $0.00555, average around $0.00463
- 2029: $0.00494 - $0.0057, average around $0.00509
- Key Catalysts: Ecosystem expansion, strategic partnerships, technological upgrades, and overall cryptocurrency market recovery could serve as primary drivers for price appreciation.
2030-2031 Long-term Outlook
- Baseline Scenario: $0.00378 - $0.00804 in 2030 (assuming steady ecosystem growth and stable market conditions), with average price around $0.0054
- Optimistic Scenario: $0.00464 - $0.00692 in 2031 (assuming accelerated adoption and favorable regulatory environment), with average price around $0.00672
- Transformative Scenario: Potential to reach upper bounds if the project achieves significant breakthroughs in decentralized computing solutions and captures substantial market share in its niche
- 2026-01-21: POND trading within the projected 2026 range, reflecting current market positioning
| Year |
Predicted High Price |
Predicted Average Price |
Predicted Low Price |
Price Change |
| 2026 |
0.00525 |
0.0037 |
0.00307 |
0 |
| 2027 |
0.00478 |
0.00447 |
0.00277 |
21 |
| 2028 |
0.00555 |
0.00463 |
0.00245 |
25 |
| 2029 |
0.0057 |
0.00509 |
0.00494 |
37 |
| 2030 |
0.00804 |
0.0054 |
0.00378 |
46 |
| 2031 |
0.00692 |
0.00672 |
0.00464 |
82 |
IV. POND Professional Investment Strategy and Risk Management
POND Investment Methodology
(1) Long-term Holding Strategy
- Suitable for: Blockchain infrastructure believers and DeFi ecosystem supporters
- Operational Recommendations:
- Accumulate POND during network development phases when utilization metrics show growth
- Consider staking tokens to participate in network operations and earn protocol rewards
- Storage Solution: Use Gate Web3 Wallet for secure self-custody with multi-chain support
(2) Active Trading Strategy
- Technical Analysis Tools:
- Volume Analysis: Monitor the 24-hour trading volume (currently $16,173.93) relative to market cap to identify liquidity conditions
- Support/Resistance Levels: Track the 24-hour range ($0.003581 - $0.003706) to establish short-term trading zones
- Swing Trading Considerations:
- Position sizing should account for the token's volatility patterns observed in recent price movements
- Set stop-loss orders to manage downside exposure during periods of market uncertainty
POND Risk Management Framework
(1) Asset Allocation Principles
- Conservative Investors: 1-2% of crypto portfolio allocation
- Aggressive Investors: 3-5% of crypto portfolio allocation
- Professional Investors: Up to 8% with active monitoring and hedging strategies
(2) Risk Hedging Solutions
- Portfolio Diversification: Balance POND holdings with established infrastructure tokens and stablecoins
- Position Scaling: Implement dollar-cost averaging during accumulation phases to reduce timing risk
(3) Secure Storage Solutions
- Hot Wallet Option: Gate Web3 Wallet for active trading and staking participation
- Cold Storage Approach: Hardware wallet integration for long-term holdings exceeding trading allocations
- Security Precautions: Enable multi-factor authentication, verify contract addresses (0x57b946008913b82e4df85f501cbaed910e58d26c on Ethereum), and maintain backup recovery phrases in secure offline locations
V. POND Potential Risks and Challenges
POND Market Risks
- Price Volatility: The token has experienced significant price fluctuations, with a 1-year decline of 77.03%, reflecting broader market sentiment and project adoption cycles
- Liquidity Considerations: With a market cap of approximately $30.27 million and daily volume around $16,173, large position entries or exits may impact price
- Market Dominance: At 0.0011% market dominance, POND remains a smaller-cap asset subject to increased volatility compared to established cryptocurrencies
POND Regulatory Risks
- Infrastructure Protocol Classification: Evolving regulatory frameworks may impact how network infrastructure protocols are classified and governed
- Staking and Rewards: Jurisdictional interpretations of staking rewards may affect taxation and compliance requirements for token holders
- Cross-border Operations: As a global network protocol, Marlin may face varying regulatory requirements across different operating jurisdictions
POND Technical Risks
- Smart Contract Vulnerabilities: As with any blockchain protocol, potential security vulnerabilities in smart contracts could impact token functionality
- Network Adoption: The token's utility depends on sustained adoption and usage of the Marlin network infrastructure
- Competitive Landscape: The network infrastructure sector includes multiple competing solutions, which may affect Marlin's market positioning
VI. Conclusion and Action Recommendations
POND Investment Value Assessment
Marlin (POND) presents an infrastructure-focused investment opportunity within the DeFi and Web 3.0 ecosystem. The protocol addresses network performance challenges through its programmable infrastructure approach. With 82.02% of tokens in circulation and a market cap-to-fully-diluted-valuation ratio of 82.02%, the tokenomics show substantial distribution. However, investors should consider the significant price decline over the past year and the token's smaller market presence when evaluating risk-adjusted return potential. The long-term value proposition depends on increased network adoption and successful execution of the protocol's technical roadmap.
POND Investment Recommendations
✅ Beginners: Consider starting with minimal allocation (under 2% of crypto portfolio) to gain exposure while learning about network infrastructure protocols. Focus on understanding the staking mechanism and governance participation before increasing position size.
✅ Experienced Investors: Evaluate POND as a speculative infrastructure play with 3-5% portfolio allocation. Monitor network usage metrics, partnership developments, and technical milestones to inform position adjustments.
✅ Institutional Investors: Conduct thorough due diligence on protocol architecture, competitive positioning, and team execution capability. Consider strategic allocation aligned with broader infrastructure thesis, with active risk management protocols in place.
POND Trading Participation Methods
- Spot Trading: Purchase POND tokens on Gate.com and 21 other exchanges for direct exposure to price movements
- Staking Participation: Stake tokens to support network operations and earn protocol rewards, contributing to ecosystem security
- Governance Involvement: Participate in protocol governance decisions using POND tokens to influence network development and resource allocation
Cryptocurrency investment carries extreme risk, and this article does not constitute investment advice. Investors should make cautious decisions based on their own risk tolerance and are advised to consult professional financial advisors. Never invest more than you can afford to lose.
FAQ
What is POND token? What is the role of Marlin Protocol?
POND is the native token of Marlin Protocol, a decentralized infrastructure layer enabling high-performance, low-latency blockchain networks. It powers network validation, governance, and resource allocation within the protocol ecosystem.
What is POND's historical price trend? What were the past highs and lows?
POND has experienced significant volatility since launch. Historical data shows price peaks around $0.15-$0.20 during bull markets and lows near $0.02-$0.05 during corrections. Long-term trend indicates growth potential as ecosystem adoption increases.
What are the main factors affecting POND price?
POND price is primarily influenced by market demand and trading volume, ecosystem development progress, DeFi protocol adoption, network activity levels, and overall cryptocurrency market sentiment. Technological updates and partnerships also significantly impact price movements.
What is the POND price prediction for 2024-2025?
Based on market trends and technical analysis, POND was projected to range between $0.08-$0.15 during 2024-2025. Factors influencing price include ecosystem adoption, community growth, and overall crypto market sentiment. Price movements depend on project developments and market conditions.
POND focuses on decentralized data infrastructure with unique value proposition. While ARB and OP lead in transaction volume, POND targets data provision and privacy. POND demonstrates distinct growth trajectory through ecosystem expansion and developer adoption in Web3 data markets.
What is the circulating supply and total supply of POND? How does the token release schedule affect the price?
POND has a circulating supply of approximately 525 million tokens with a total supply of 1 billion. The gradual token release schedule supports price stability by preventing sudden market flooding. Strategic vesting of community and team allocations encourages long-term development, positively influencing price dynamics.
What are the risks of investing in POND?
POND investment risks include market volatility, liquidity fluctuations, regulatory uncertainties in crypto sectors, and technological development challenges. Token value depends on adoption rates and competitive landscape. Always conduct thorough research before investing.
How to analyze POND's technical and fundamental aspects for price prediction?
Analyze POND's technical indicators like moving averages, RSI, and support/resistance levels. For fundamentals, examine ecosystem development, community growth, trading volume trends, and tokenomics. Monitor network activity and partnership announcements to assess long-term value drivers and market sentiment.
* The information is not intended to be and does not constitute financial advice or any other recommendation of any sort offered or endorsed by Gate.