This comprehensive analysis examines PVP token's market position and price dynamics within the programmable on-chain application infrastructure sector. Trading at $1.29 with a $2.57 million market cap as of January 2026, PVP demonstrates significant growth potential despite extreme market fear conditions. The article evaluates critical factors including token supply mechanics, extreme holder concentration (96.20% held by single address), and ecosystem development catalysts. Professional price forecasts span 2026-2031, incorporating conservative, neutral, and optimistic scenarios. Strategic investment frameworks address asset allocation principles, risk management protocols, and secure storage solutions on Gate exchange. Key risk considerations include limited liquidity, regulatory uncertainties, and technical vulnerabilities. Designed for beginners to institutional investors seeking data-driven investment strategies within emerging cryptocurrency infrastructure projects.
Introduction: PVP's Market Position and Investment Value
PVPFun (PVP), as an intelligent infrastructure designed for Programmable versus Playable (PvP) products, has been empowering creators, developers, and communities to build, deploy, and monetize programmable on-chain applications and experiences. As of January 31, 2026, PVP maintains a market capitalization of approximately $2.57 million, with a circulating supply of around 2 million tokens and a current price near $1.29. This asset, characterized by its programmable infrastructure capabilities, is playing an increasingly important role in the on-chain application development ecosystem.
This article will comprehensively analyze PVP's price trends from 2026 to 2031, combining historical patterns, market supply and demand dynamics, ecosystem development, and macroeconomic conditions to provide investors with professional price forecasts and practical investment strategies.
I. PVP Price History Review and Market Status
PVP Historical Price Evolution Trajectory
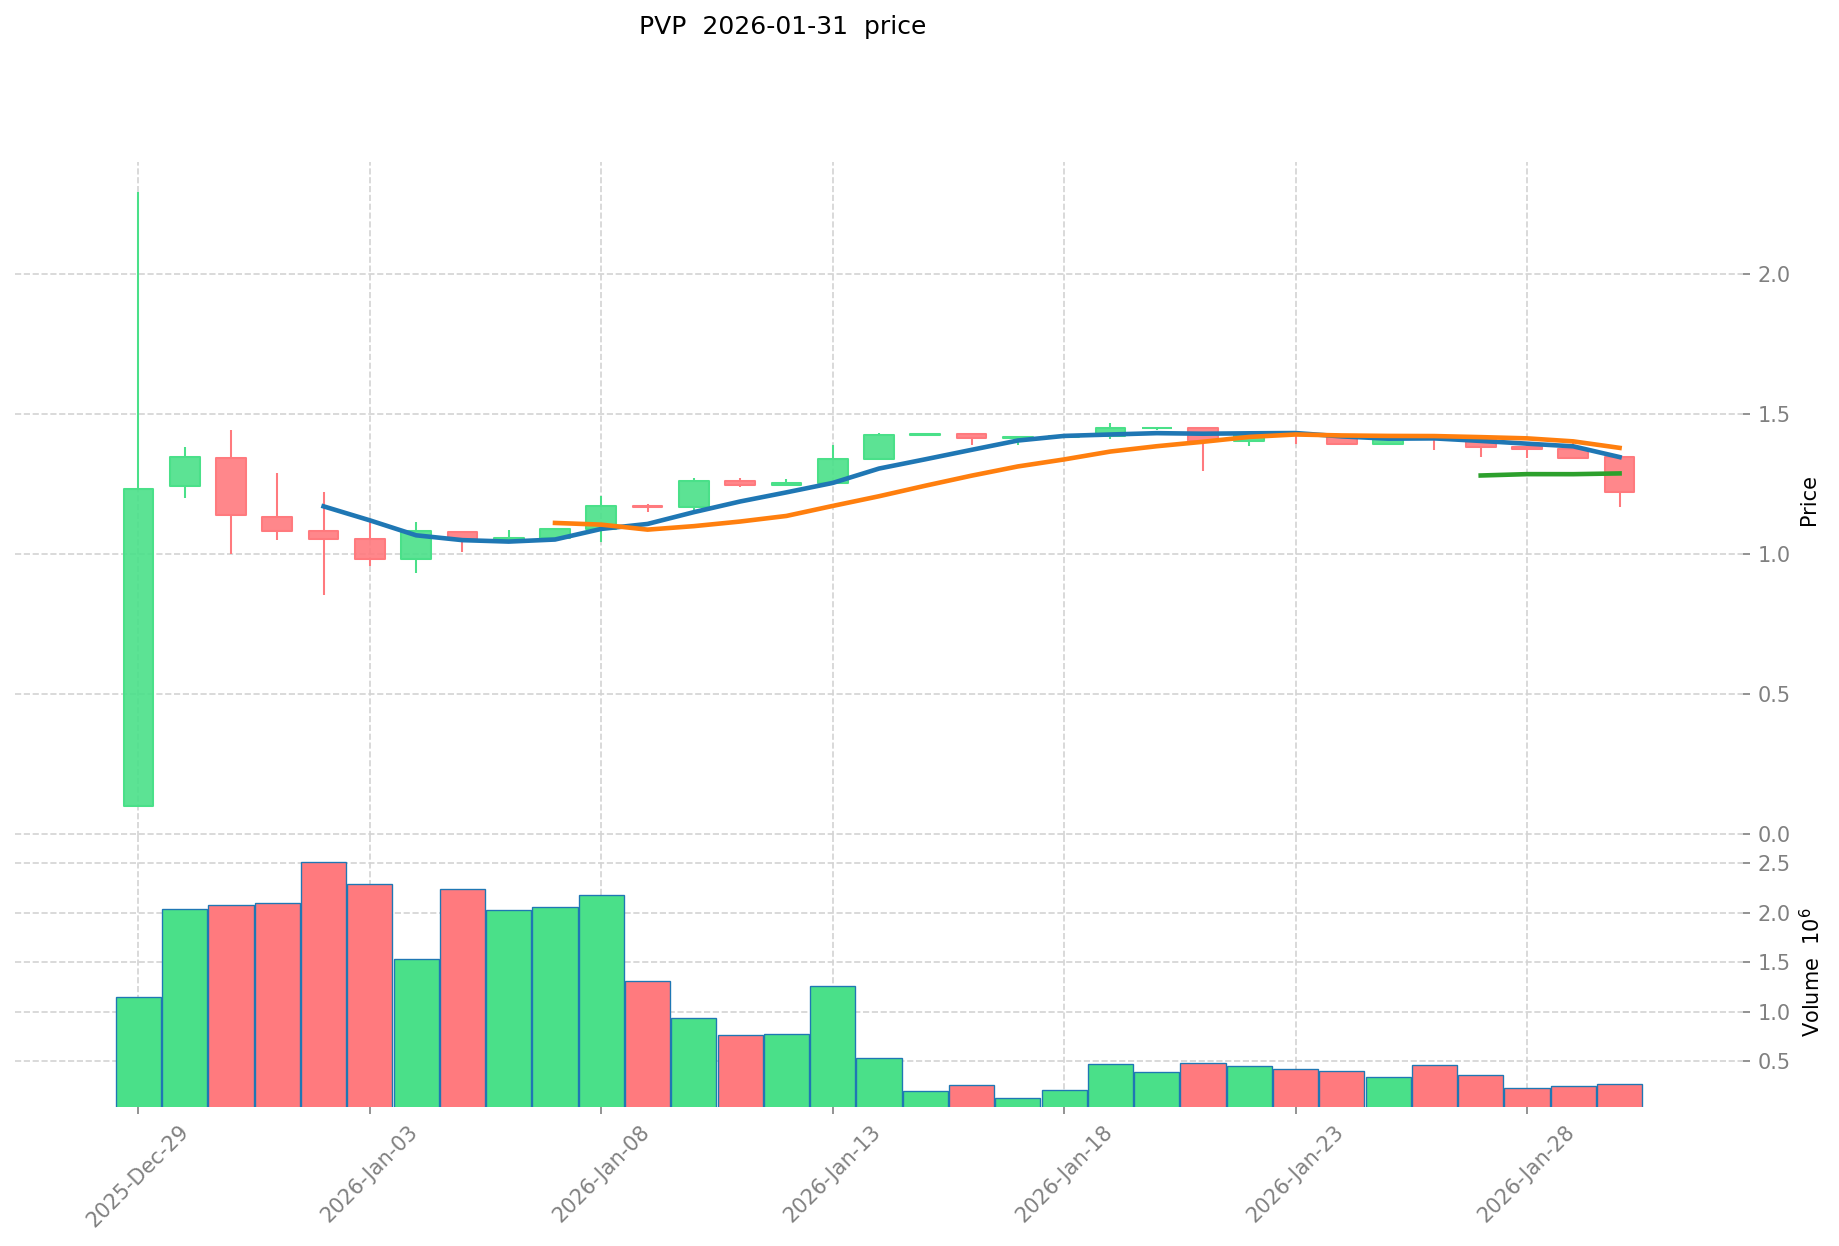
- December 2025: PVP token was officially launched on Gate.com, with initial price fluctuations between $0.1 and $2.29, showing significant volatility in its early trading phase
- December 2025: The token experienced notable price movements during its debut period, demonstrating initial market discovery and price establishment
PVP Current Market Situation
As of January 31, 2026, PVP is trading at $1.2866, representing a modest decline of 0.29% over the past 24 hours. The token has exhibited mixed performance across different timeframes, with a 0.48% increase in the last hour, while showing a 9.29% decrease over the past week. On a monthly basis, PVP has demonstrated positive momentum with a 16.08% gain over the last 30 days.
The 24-hour trading range has been established between $1.152 and $1.311, with total trading volume reaching $312,067.59. The current market capitalization stands at approximately $2.57 million, with a circulating supply of 2 million tokens out of a maximum supply of 100 million tokens, representing a circulating ratio of 2%. The fully diluted market cap is calculated at $128.66 million.
PVP maintains a market dominance of 0.0044% and holds a ranking of 1916 among digital assets. The token has attracted a community of 3,129 holders and is currently listed on 2 exchanges. The market cap to fully diluted valuation ratio stands at 2%, indicating substantial potential supply yet to enter circulation.
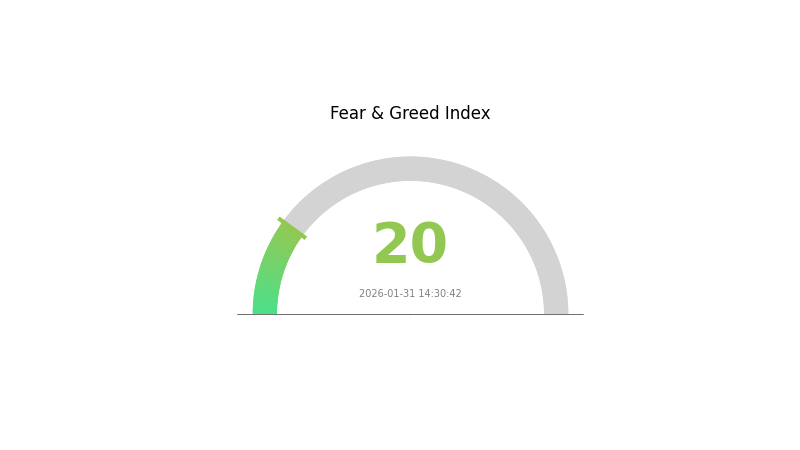
The broader market sentiment indicator shows a reading of 20, reflecting an Extreme Fear environment in the cryptocurrency market, which may influence trading behavior and price action across digital assets including PVP.
Click to view current PVP market price
PVP Market Sentiment Indicator
2026-01-31 Fear and Greed Index: 20 (Extreme Fear)
Click to view current Fear & Greed Index
The cryptocurrency market is currently experiencing extreme fear, with the Fear and Greed Index dropping to 20. This indicates that market participants are highly pessimistic about near-term price movements. During such periods of extreme fear, risk-averse investors typically reduce positions while contrarian traders may see potential buying opportunities. Market volatility remains elevated, and investor sentiment is dominated by bearish sentiment. Close monitoring of key support levels and market catalysts is recommended for trading decisions.
PVP Holdings Distribution
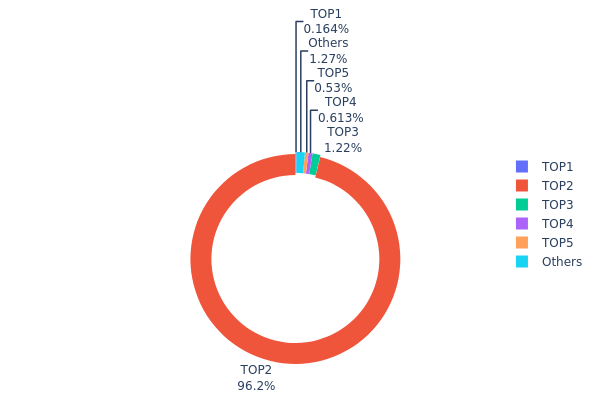
The holdings distribution chart reveals the allocation pattern of PVP tokens across different wallet addresses on the blockchain, serving as a critical indicator of asset concentration and decentralization level. This metric helps assess whether token holdings are excessively concentrated in a few addresses, which could potentially impact market stability and price dynamics.
Based on the current data, PVP exhibits an extremely high concentration characteristic. The second-ranked address (0x8f9c...48c09e) holds an overwhelming 96,204.71K tokens, accounting for 96.20% of the total supply. This level of concentration is exceptionally rare in the cryptocurrency market and indicates that nearly all circulating tokens are controlled by a single entity. The remaining addresses collectively hold less than 4% of the supply, with the third-largest holder possessing only 1,223.29K tokens (1.22%), followed by addresses holding 613.21K (0.61%) and 529.93K (0.52%) respectively.
Such extreme concentration poses significant implications for market structure and price volatility. The dominant address holds near-absolute control over token supply, creating substantial risks of price manipulation and sudden market movements. Any transfer or sale activity from this address could trigger dramatic price fluctuations, while the lack of distributed ownership limits natural market-making mechanisms. This structure suggests PVP may function more as a centrally controlled asset rather than a decentralized token, with liquidity and trading depth potentially constrained by the concentration of holdings. The minimal holdings across other addresses indicate limited organic distribution and a highly centralized on-chain architecture that deviates significantly from typical decentralized token economics.
Click to view current PVP Holdings Distribution
| Top |
Address |
Holding Qty |
Holding (%) |
| 1 |
0xea07...543885 |
163.69K |
0.16% |
| 2 |
0x8f9c...48c09e |
96204.71K |
96.20% |
| 3 |
0x124d...44f012 |
1223.29K |
1.22% |
| 4 |
0xaf1d...89e91c |
613.21K |
0.61% |
| 5 |
0x0d07...b492fe |
529.93K |
0.52% |
| - |
Others |
1265.17K |
1.29% |
II. Core Factors Influencing Future PVP Price Trends
Supply Mechanism
-
Capacity Expansion and Market Competition: The PVP industry is experiencing significant capacity expansion, with new entrants such as Anhui Huafu Material Technology (37,300 tons/year) and Henan Pengfei New Materials (10,000 tons/year) expected to add approximately 50,000 tons of combined capacity. This represents nearly twice the 2024 production capacity of industry leader Xinkeyuan. The rapid release of new production capacity is intensifying market competition and creating downward pressure on prices.
-
Historical Patterns: From 2022 to 2023, PVP prices experienced a temporary surge due to supply chain disruptions caused by the European energy crisis and geopolitical conflicts, which forced major European manufacturers like BASF to reduce production. Industrial-grade K30 prices reached over 80,000 yuan/ton during this period. However, as European production capacity recovered and raw material BDO prices declined from 30,000 yuan/ton to approximately 13,000 yuan/ton in 2025, PVP prices have retreated to around 30,000 yuan/ton.
-
Current Impact: The upstream monomer NVP has seen prices drop to historic lows of 17.2 yuan/kg, reflecting intense price competition. Industry analysts suggest that with the looser supply-demand balance, PVP prices may face continued pressure in the near term.
Industry Dynamics and Market Structure
-
Major Market Players: Global leaders BASF and Ashland collectively hold over 40% of the global market share, with annual capacities of 24,800 tons and 21,000 tons respectively. These companies are gradually exiting lower-end market segments while maintaining technical advantages in high-end pharmaceutical-grade products. In the domestic market, companies such as Jiaozuo Zhongwei, Sichuan Tianhua, Chongqing Steck, and Ningxia Weiyuan (with capacities exceeding 5,000 tons each) are actively developing their respective market segments and expanding international sales channels.
-
Competitive Landscape: Recent industry exhibitions, including CPHI Europe in Frankfurt, have demonstrated intensifying competition. Market participants report that European clients are demanding cost reductions, while customers from South Asia regions often negotiate with quotes from at least five suppliers, driving aggressive price competition.
-
Strategic Differentiation: Industry participants are adopting diverse strategic approaches. While established players like BASF and Ashland focus on high-value pharmaceutical applications, emerging companies such as Sichuan Tianhua are targeting the rapidly growing new energy sector, developing specialized products like low-viscosity PVP-K15 for lithium battery electrode dispersants.
Macroeconomic and Industry Environment
-
Application Sector Growth: Traditional application sectors (pharmaceuticals and daily chemicals) account for approximately 65% of PVP demand. The new energy sector (lithium batteries and photovoltaics) has emerged as the fastest-growing segment, with its share increasing from 8% in 2020 to 22% in 2023, according to data from China Research Institute.
-
Policy Support: PVP has been included in key new materials industry directories, with regions such as Jiangsu and Zhejiang offering subsidies of up to 20% for PVP applications in new energy projects. These policy initiatives may support market development in emerging application areas.
-
Regulatory Considerations: Market participants are closely monitoring the progress of EU REACH regulation revisions, which could significantly impact the industry's profit distribution structure.
Technology Development and Product Innovation
-
Product Portfolio Diversification: Major manufacturers produce various PVP series including K-series, A/V series, and specialized formulations for different applications. The industry is increasingly focusing on developing specialized products tailored to specific end-use requirements.
-
Emerging Applications: PVP is finding new applications in lithium battery technology, where it serves as an electrode dispersant. Companies are investing in research and development to optimize product specifications for new energy applications, which could open additional demand channels.
-
Quality Requirements: As consumer demand for downstream products increases in terms of quantity, quality, and variety, corresponding requirements for PVP products are also rising. This trend is driving technological advancement and new product development in the industry.
III. 2026-2031 PVP Price Forecast
2026 Outlook
- Conservative forecast: $0.69-$0.90
- Neutral forecast: $1.00-$1.28
- Optimistic forecast: $1.40-$1.65 (requires sustained market momentum and positive ecosystem developments)
2027-2029 Mid-term Outlook
- Market stage expectations: PVP may enter a gradual growth phase as market conditions stabilize and adoption potentially increases
- Price range forecasts:
- 2027: $1.42-$1.80 (projected 14% increase)
- 2028: $1.36-$2.11 (projected 27% increase)
- 2029: $1.67-$2.79 (projected 45% increase)
- Key catalysts: Potential expansion of use cases, broader market recovery trends, and enhanced platform utility could serve as primary drivers for price appreciation
2030-2031 Long-term Outlook
- Baseline scenario: $2.24-$2.94 (assuming steady ecosystem development and moderate market growth)
- Optimistic scenario: $2.60-$3.30 (assuming accelerated adoption and favorable regulatory environment)
- Transformative scenario: $3.50-$3.82 (under exceptionally favorable conditions including widespread mainstream adoption)
- 2031-01-31: PVP may reach average levels around $2.63 with potential highs near $3.82 (projected 104% cumulative increase from 2026 baseline)
| Year |
Predicted High Price |
Predicted Average Price |
Predicted Low Price |
Price Change |
| 2026 |
1.65262 |
1.2811 |
0.69179 |
0 |
| 2027 |
1.80424 |
1.46686 |
1.42285 |
14 |
| 2028 |
2.10986 |
1.63555 |
1.35751 |
27 |
| 2029 |
2.79033 |
1.8727 |
1.66671 |
45 |
| 2030 |
2.93771 |
2.33152 |
2.23825 |
81 |
| 2031 |
3.82019 |
2.63461 |
1.92327 |
104 |
IV. PVP Professional Investment Strategy and Risk Management
PVP Investment Methodology
(1) Long-term Holding Strategy
- Suitable for: Investors who believe in the long-term potential of programmable on-chain applications and can tolerate short-term volatility
- Operational Recommendations:
- Consider accumulating positions during market corrections, as the token showed a 7-day decline of 9.29% but maintained a 30-day increase of 16.08%
- Monitor the project's development progress and ecosystem expansion on PvPfun platform
- Store assets in secure wallets like Gate Web3 Wallet for enhanced security and ease of access
(2) Active Trading Strategy
- Technical Analysis Tools:
- Price Action Analysis: Monitor the 24-hour trading range between $1.152 and $1.311 to identify support and resistance levels
- Volume Analysis: Track the 24-hour trading volume of $312,067.59 to gauge market interest and liquidity
- Band Trading Essentials:
- Establish entry and exit points based on the token's recent volatility patterns
- Set stop-loss orders to manage downside risk, particularly given the 9.29% weekly decline
PVP Risk Management Framework
(1) Asset Allocation Principles
- Conservative Investors: 1-3% of crypto portfolio allocation
- Aggressive Investors: 5-10% of crypto portfolio allocation
- Professional Investors: Up to 15% of crypto portfolio allocation with active monitoring
(2) Risk Hedging Solutions
- Portfolio Diversification: Combine PVP holdings with established cryptocurrencies to reduce concentration risk
- Position Sizing: Limit initial positions given the token's low circulating supply of 2 million tokens (2% of total supply)
(3) Secure Storage Solutions
- Hot Wallet Recommendation: Gate Web3 Wallet for convenient trading and staking activities
- Cold Storage Option: Consider hardware wallet solutions for long-term holdings exceeding $10,000
- Security Precautions: Enable two-factor authentication, verify contract addresses (0x009c69b994ae68e90f20a63ce1659ab949547073 on BSC), and never share private keys
V. PVP Potential Risks and Challenges
PVP Market Risks
- Low Liquidity: With only 2% of tokens in circulation and trading on 2 exchanges, liquidity remains limited, potentially causing significant price volatility
- High Volatility: Recent price movements show substantial fluctuations, with a 9.29% weekly decline despite positive monthly performance
- Market Cap Exposure: Current market capitalization of approximately $2.57 million represents a micro-cap cryptocurrency with elevated risk profile
PVP Regulatory Risks
- Token Classification Uncertainty: Programmable on-chain application platforms may face evolving regulatory scrutiny across different jurisdictions
- Compliance Requirements: Future regulatory frameworks for decentralized application infrastructure could impact project operations and token utility
- Geographic Restrictions: Potential limitations on token trading and platform access in certain regions due to local cryptocurrency regulations
PVP Technical Risks
- Smart Contract Vulnerabilities: As a BEP-20 token on BSC, potential risks exist related to contract security and blockchain infrastructure dependencies
- Platform Development Risk: Success depends on the team's ability to deliver programmable features and attract creators and developers to the ecosystem
- Limited Track Record: With a relatively recent launch and small holder base of 3,129 addresses, the project's long-term viability requires further validation
VI. Conclusion and Action Recommendations
PVP Investment Value Assessment
PvPfun presents an interesting proposition in the programmable on-chain application infrastructure space, targeting creators, developers, and communities. The token has demonstrated positive 30-day performance of 16.08%, suggesting early market interest in the platform's vision. However, the extremely low circulation rate of 2% and limited exchange listings indicate the project remains in early developmental stages. The current market cap to fully diluted valuation ratio suggests significant unlocking risk ahead. While the concept of programmable versus playable products shows innovation potential, investors should carefully weigh the early-stage nature and associated risks against potential long-term value creation.
PVP Investment Recommendations
✅ Beginners: Limit exposure to less than 2% of total crypto portfolio, focus on learning about the project fundamentals before investing, and consider starting with small position sizes to understand price dynamics
✅ Experienced Investors: Allocate 3-5% of crypto portfolio for speculative positions, actively monitor project development milestones and ecosystem growth, and employ technical analysis for optimal entry points
✅ Institutional Investors: Conduct comprehensive due diligence on team background and technology architecture, establish direct communication channels with project team, and consider strategic investment with clear performance metrics and exit strategies
PVP Trading Participation Methods
- Spot Trading on Gate.com: Trade PVP against major trading pairs with competitive fees and reliable liquidity
- Dollar-Cost Averaging: Implement systematic purchase plans to mitigate timing risk and build positions gradually
- Portfolio Integration: Include PVP as part of a diversified cryptocurrency portfolio focused on infrastructure and application layer projects
Cryptocurrency investment carries extremely high risks, and this article does not constitute investment advice. Investors should make cautious decisions based on their own risk tolerance and are advised to consult professional financial advisors. Never invest more than you can afford to lose.
FAQ
What is the basic principle of PVP price prediction?
PVP price prediction is based on supply-demand balance and player behavior. Market prices typically equal production costs. When supply-demand imbalances occur, prices fluctuate significantly. PVP mechanisms control item output through competitive gameplay, directly influencing market pricing dynamics.
How to predict PVP's future price trends using historical data?
Analyze historical price patterns, trading volume trends, and market cycles. Use statistical models and time-series forecasting techniques. Monitor key support and resistance levels. Track market sentiment indicators and on-chain metrics. Combine technical analysis with fundamental factors for comprehensive predictions.
What are the main factors affecting PVP price fluctuations?
PVP price fluctuations are primarily driven by raw material costs (especially BDO), market demand and supply dynamics, production expenses, and competitive market conditions. Market sentiment and trading volume also play significant roles in price movements.
What are the common technical analysis methods used in PVP price prediction?
Common technical analysis methods for PVP price prediction include moving averages, RSI (Relative Strength Index), MACD, Bollinger Bands, and support/resistance levels. These tools help identify trend directions, momentum, and potential price reversal points for more accurate predictions.
How is the accuracy of PVP price predictions assessed?
PVP price prediction accuracy is evaluated through historical data backtesting, model performance metrics, and market trend alignment. Accuracy improves with higher quality data, advanced analytical methodologies, and continuous model optimization against actual market movements.
What is the difference between short-term and long-term PVP price predictions?
Short-term PVP predictions focus on price changes within hours to weeks for immediate trading decisions, while long-term predictions span months to years for strategic planning. Short-term relies on recent market momentum, while long-term considers fundamental developments and adoption trends.
What risk factors should be noted when making PVP price predictions?
Monitor market volatility, trading volume fluctuations, liquidity conditions, sentiment shifts, and macroeconomic factors. Consider regulatory changes, technical chart patterns, and momentum indicators for accurate price movement predictions.
* The information is not intended to be and does not constitute financial advice or any other recommendation of any sort offered or endorsed by Gate.