This comprehensive analysis examines Quack AI (Q), an AI-native governance infrastructure for Web3 DAOs and RWA projects. As of January 2026, Q trades at $0.01653 with a $26.71M market cap. The article reviews Q's price history from launch in September 2025, analyzes current market sentiment during extreme fear conditions, and evaluates holding distribution patterns. It provides detailed price forecasts spanning 2026-2031, ranging from conservative ($0.01124-$0.019) to optimistic scenarios ($0.03171 by 2031), suggesting cumulative growth potential of approximately 57%. The guide offers tailored investment strategies for beginners, experienced, and institutional investors, comprehensive risk management frameworks across market, regulatory, and technical dimensions, and practical trading recommendations on Gate exchange. Detailed risk assessments address volatility, liquidity, and regulatory challenges specific to multi-chain governance solutions.
Introduction: Q's Market Position and Investment Value
Quack AI (Q), as an AI-native governance layer for Web3, has been transforming decentralized governance processes since its launch in 2025. As of January 2026, Q has achieved a market capitalization of approximately $26.71 million, with a circulating supply of about 1.616 billion tokens, and its price is maintained around $0.01653. This asset, known as "the intelligent governance infrastructure for DAOs and RWA projects," is playing an increasingly significant role in areas such as automated proposal management, multi-chain governance coordination, and compliant decision-making frameworks.
This article will comprehensively analyze Q's price trends from 2026 to 2031, combining historical patterns, market supply and demand dynamics, ecosystem development, and macroeconomic environment factors to provide investors with professional price forecasts and practical investment strategies.
I. Q Price History Review and Market Status
Q Historical Price Evolution Trajectory
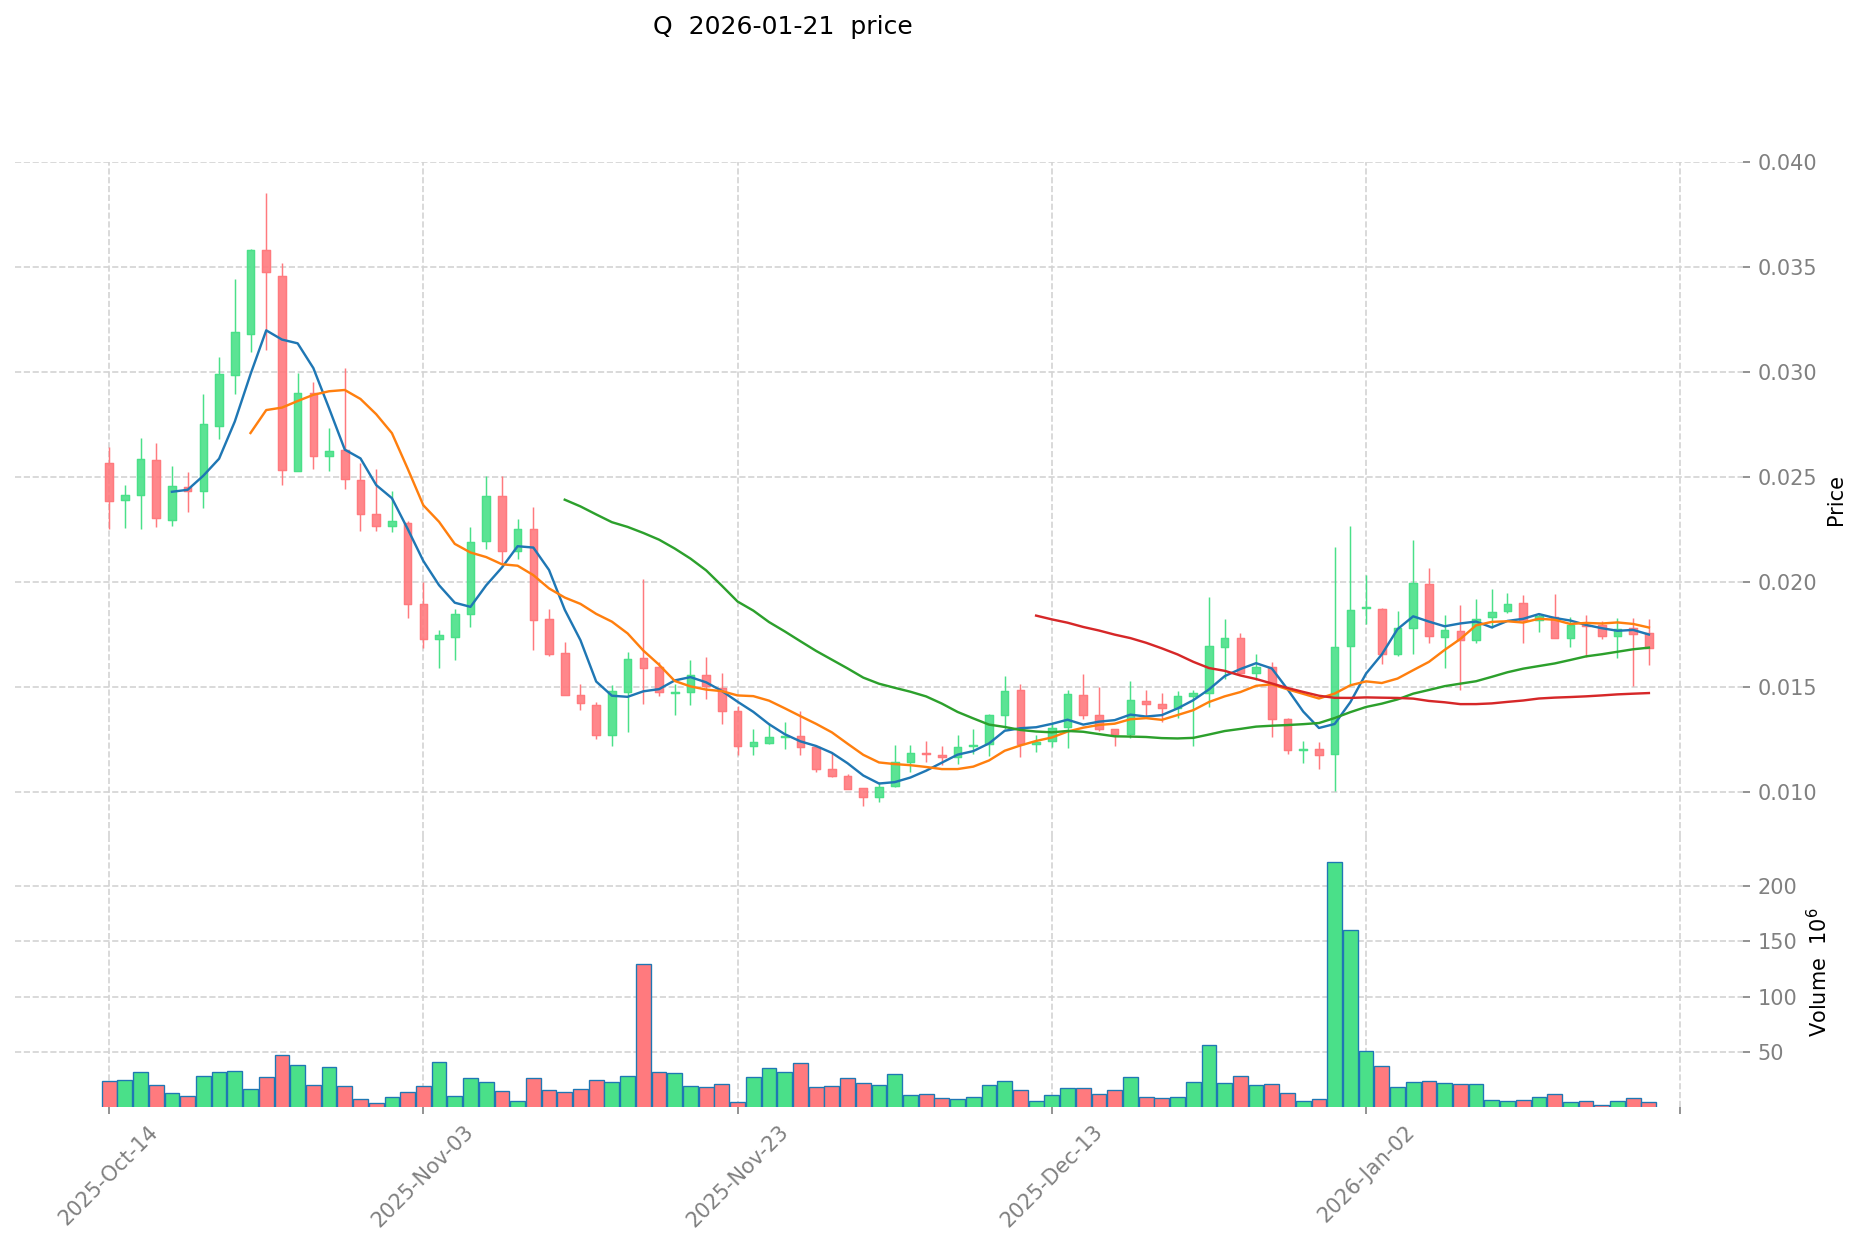
- September 2025: Q token launched with an initial price of $0.01, marking the beginning of its market journey
- September 2025: Price reached an all-time low of $0.002, representing a significant early-stage volatility period
- October 2025: Token achieved its all-time high of $0.053205, demonstrating strong initial market interest and adoption momentum
Q Current Market Status
As of January 22, 2026, Q is trading at $0.016529, positioned at #749 in the cryptocurrency market rankings. The token has demonstrated mixed short-term performance, with a 0.4% increase over the past hour but experiencing a 1.25% decline in the last 24 hours. The 24-hour trading range shows price movement between $0.016231 and $0.017014, indicating moderate intraday volatility.
Over the past week, Q has declined by 8.20%, reflecting some near-term bearish pressure. However, the 30-day performance presents a more positive outlook with a 13.79% gain, suggesting underlying strength and recovery from previous lows. The current price represents approximately a 68.93% decrease from its all-time high of $0.053205 recorded in October 2025, while remaining significantly above its all-time low of $0.002 from September 2025.
The token maintains a 24-hour trading volume of $86,858.73 and a market capitalization of approximately $26.71 million. With a circulating supply of 1.616 billion tokens out of a maximum supply of 10 billion, the current circulation rate stands at 16.16%. The fully diluted market cap reaches $165.29 million, representing the potential total valuation if all tokens were in circulation. Q holds a 0.0053% share of the total cryptocurrency market.
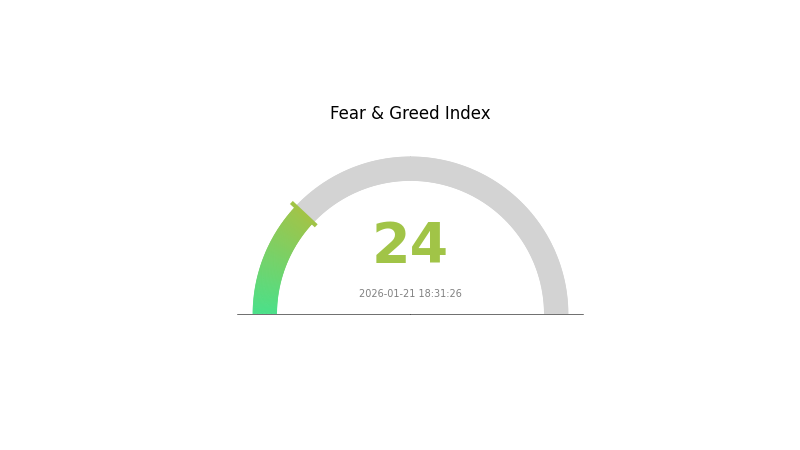
The broader market sentiment index currently registers at 24, indicating an "Extreme Fear" environment, which may be influencing Q's recent price movements. Q is listed on 14 exchanges and has attracted a holder base of 23,380 addresses, demonstrating growing community participation.
Click to view current Q market price
Q Market Sentiment Indicator
2026-01-21 Fear and Greed Index: 24 (Extreme Fear)
Click to view current Fear & Greed Index
The cryptocurrency market is currently experiencing extreme fear, with the Fear and Greed Index at 24. This indicates strong negative sentiment among investors, characterized by significant pessimism and risk aversion. Market participants are showing heightened caution, with selling pressure potentially outweighing buying interest. Such extreme fear conditions often present contrarian opportunities for long-term investors, as panic-driven price declines may create entry points. However, traders should remain vigilant and conduct thorough analysis before making investment decisions during such volatile periods.
Q Holding Distribution
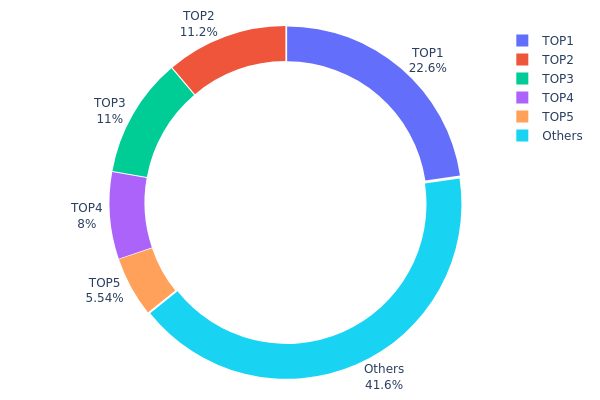
The holding distribution chart illustrates the proportion of total Q token supply held by different wallet addresses, serving as a key metric to assess the degree of token concentration and decentralization within the ecosystem. By analyzing the distribution pattern across top holders and remaining addresses, this indicator reveals potential risks related to market manipulation, liquidity concentration, and overall network health.
According to current on-chain data, Q demonstrates a moderate level of concentration among its top holders. The largest address controls approximately 22.64% of the total supply (1,132,444.45K tokens), while the top five addresses collectively hold 58.36% of all circulating tokens. This concentration level falls within a concerning range, as nearly 60% of supply remains under the control of a small number of entities. The remaining 41.64% is distributed among other addresses, suggesting limited participation breadth across the broader holder base.
This distribution structure presents several implications for market dynamics. The substantial holdings concentrated in top addresses creates heightened volatility risk, as large-scale sell-offs from any major holder could trigger significant price fluctuations. Additionally, such concentration raises potential concerns regarding price manipulation capabilities and reduces the token's resistance to coordinated market actions. From a decentralization perspective, the current holding pattern indicates moderate centralization risk that may impact long-term ecosystem stability and investor confidence in the project's governance structure.
Click to view current Q Holding Distribution
| Top |
Address |
Holding Qty |
Holding (%) |
| 1 |
0x74d8...633f55 |
1132444.45K |
22.64% |
| 2 |
0x42d4...519e8c |
559596.00K |
11.19% |
| 3 |
0x78ac...c2671e |
550000.00K |
11.00% |
| 4 |
0x8cac...49cedf |
400000.00K |
8.00% |
| 5 |
0xc882...84f071 |
276888.29K |
5.53% |
| - |
Others |
2081063.62K |
41.64% |
II. Core Factors Influencing Q's Future Price
Based on the available materials, there is insufficient data to provide a comprehensive analysis of the core factors that may impact Q's future price trajectory. The reference materials do not contain specific information regarding supply mechanisms, institutional dynamics, macroeconomic influences, or technical developments related to Q.
Without verifiable data on supply models, halving events, institutional holdings, corporate adoption patterns, monetary policy correlations, or ecosystem developments, it would be inappropriate to present speculative analysis. A thorough evaluation of Q's price drivers requires concrete data on tokenomics, market participant behavior, regulatory landscape, and technological roadmap milestones.
For accurate price factor analysis, additional research materials covering Q's fundamental characteristics, market structure, and development timeline would be necessary.
III. 2026-2031 Q Price Forecast
2026 Outlook
- Conservative forecast: $0.01124 - $0.019
- Neutral forecast: Around $0.01652
- Optimistic forecast: Up to $0.019 (requires favorable market conditions and increased adoption)
2027-2029 Outlook
- Market stage expectation: Gradual growth phase with potential for moderate price appreciation as the project matures and expands its ecosystem
- Price range forecast:
- 2027: $0.01012 - $0.02043, averaging around $0.01776
- 2028: $0.01146 - $0.02387, averaging around $0.01909
- 2029: $0.01332 - $0.02621, averaging around $0.02148
- Key catalysts: Technology upgrades, expanding partnerships, increased trading volume, and broader market recovery could drive price momentum during this period
2030-2031 Long-term Outlook
- Baseline scenario: $0.01478 - $0.02814 (assuming steady market conditions and consistent project development)
- Optimistic scenario: $0.02384 - $0.03171 (with strong ecosystem growth, increased institutional interest, and favorable regulatory environment)
- Transformational scenario: Potential to reach $0.03171 by 2031 (under conditions of significant technological breakthroughs, mass adoption, and exceptionally bullish crypto market conditions)
The forecast suggests a cumulative growth potential of approximately 57% from 2026 to 2031 under favorable conditions, with the average price potentially rising from $0.01652 in 2026 to $0.02599 by 2031. However, investors should note that cryptocurrency markets remain highly volatile, and actual prices may vary significantly from these projections based on numerous factors including market sentiment, regulatory developments, and broader economic conditions.
| Year |
Predicted High Price |
Predicted Average Price |
Predicted Low Price |
Price Change |
| 2026 |
0.019 |
0.01652 |
0.01124 |
0 |
| 2027 |
0.02043 |
0.01776 |
0.01012 |
7 |
| 2028 |
0.02387 |
0.01909 |
0.01146 |
15 |
| 2029 |
0.02621 |
0.02148 |
0.01332 |
29 |
| 2030 |
0.02814 |
0.02384 |
0.01478 |
44 |
| 2031 |
0.03171 |
0.02599 |
0.01559 |
57 |
IV. Q Professional Investment Strategies and Risk Management
Q Investment Methodology
(1) Long-Term Holding Strategy
- Suitable for: Investors focused on Web3 governance infrastructure and AI-driven DAO solutions
- Operational Recommendations:
- Consider accumulating Q tokens during market corrections, given the project's multi-chain support across BNB Chain, Arbitrum, Base, Linea, and Polygon
- Monitor adoption metrics among DAO and RWA projects as indicators of long-term utility
- Storage Solution: Use Gate Web3 Wallet with BSC network support for secure custody of Q tokens (Contract: 0xc07e1300dc138601fa6b0b59f8d0fa477e690589)
(2) Active Trading Strategy
- Technical Analysis Tools:
- Volume Analysis: Track the 24-hour trading volume ($86,858.73) relative to market cap ($26.71M) to identify liquidity patterns
- Price Range Monitoring: Observe the current 24H range ($0.016231 - $0.017014) for short-term entry and exit points
- Swing Trading Considerations:
- Note the 30-day gain of 13.79% while factoring in the 7-day decline of 8.20% for momentum assessment
- Monitor the circulating supply ratio of 16.16% as future token unlocks may impact price dynamics
Q Risk Management Framework
(1) Asset Allocation Principles
- Conservative Investors: 1-3% of crypto portfolio allocated to Q
- Moderate Investors: 3-5% of crypto portfolio allocated to Q
- Aggressive Investors: 5-8% of crypto portfolio allocated to Q
(2) Risk Hedging Approaches
- Diversification: Balance Q holdings with established governance tokens and infrastructure assets
- Position Sizing: Limit initial exposure given the relatively low circulating supply (1.616B out of 10B max supply)
(3) Secure Storage Solutions
- Hot Wallet Recommendation: Gate Web3 Wallet for active trading and staking participation
- Cold Storage Approach: Hardware wallet solution for long-term holdings, ensuring proper backup of BSC-compatible addresses
- Security Precautions: Verify contract address (0xc07e1300dc138601fa6b0b59f8d0fa477e690589) before transactions; enable multi-factor authentication on exchange accounts
V. Q Potential Risks and Challenges
Q Market Risks
- Volatility Risk: Current price of $0.016529 represents a 68.93% decline from ATH of $0.053205 (October 7, 2025), indicating potential for continued price fluctuations
- Liquidity Risk: Relatively modest 24-hour trading volume compared to market cap may result in price slippage during large transactions
- Market Share Risk: With 0.0053% market dominance, Q faces competition from established governance and AI crypto projects
Q Regulatory Risks
- DAO Governance Compliance: Evolving regulations around decentralized autonomous organizations may impact QuackAI's operational model
- Multi-Chain Regulatory Complexity: Operations across multiple blockchains (BNB Chain, Arbitrum, Base, Linea, Polygon) subject the project to varying jurisdictional requirements
- AI Integration Oversight: Increasing scrutiny of AI applications in financial decision-making may affect platform adoption
Q Technical Risks
- Smart Contract Risk: As a BEP-20 token operating across multiple chains, vulnerabilities in bridge protocols or governance contracts could affect token security
- Integration Complexity: The platform's reliance on on-chain and off-chain data aggregation introduces technical dependencies that may experience disruptions
- Scalability Challenges: Automated governance workflows across multiple blockchains may encounter performance bottlenecks during high-activity periods
VI. Conclusion and Action Recommendations
Q Investment Value Assessment
QuackAI positions itself within the emerging intersection of AI and Web3 governance infrastructure, targeting DAO and RWA project decision-making processes. With support across five major blockchain networks and 23,380 holders, the project demonstrates early adoption. However, investors should note the limited circulating supply (16.16% of max supply), significant price volatility from ATH, and the project's relatively recent launch (September 2025). The long-term value proposition depends on widespread DAO adoption of AI-driven governance solutions, while short-term risks include market volatility, token unlock schedules, and execution of the technical roadmap.
Q Investment Recommendations
✅ Beginners: Start with minimal allocation (under 2% of crypto portfolio) after thoroughly researching the project documentation at quackai.gitbook.io/docs; focus on understanding DAO governance mechanisms before investing
✅ Experienced Investors: Consider strategic accumulation during market corrections; monitor governance proposal activity and partnership announcements for adoption signals; maintain position sizing discipline given the early-stage nature
✅ Institutional Investors: Evaluate QuackAI's multi-chain governance infrastructure as a potential portfolio diversification tool within Web3 infrastructure allocations; conduct thorough due diligence on smart contract audits and team credentials
Q Trading Participation Methods
- Spot Trading: Trade Q/USDT pairs on Gate.com with access to real-time market data and liquidity
- Wallet Integration: Use Gate Web3 Wallet to interact directly with QuackAI's governance platform across supported chains
- Portfolio Tracking: Monitor Q holdings alongside other governance tokens through Gate.com portfolio management tools
Cryptocurrency investment carries extremely high risks. This article does not constitute investment advice. Investors should make prudent decisions based on their own risk tolerance and are advised to consult professional financial advisors. Never invest more than you can afford to lose.
FAQ
Q has demonstrated strong upward momentum throughout 2025, appreciating significantly over the past year. The token gained approximately 185% year-over-year, reflecting growing market adoption and ecosystem development. Price volatility remains present, typical for emerging crypto assets, with various support and resistance levels established during market cycles.
What are the main factors affecting Q price?
Q price is primarily influenced by market demand and supply dynamics, overall cryptocurrency market sentiment, project development progress and adoption rate, trading volume and market liquidity, macroeconomic conditions, and regulatory changes in the crypto industry.
What is the professional analysts' price prediction for Q in the future?
Professional analysts project Q could reach $0.50-$1.00 by end of 2026, driven by increased adoption and ecosystem development. Long-term forecasts suggest potential for $2.00+ as the protocol scales. Market sentiment remains bullish based on technical analysis and fundamental growth metrics.
Q demonstrates strong competitive positioning with superior price momentum compared to peer assets. Characterized by higher volatility and growth potential, Q outperforms in trading volume metrics during bull market cycles, positioning it favorably within its asset class category.
What are the risks and uncertainties in Q price prediction?
Q price prediction faces uncertainties from market volatility, regulatory changes, macroeconomic factors, and trading volume fluctuations. Technical analysis limitations and unexpected news events can significantly impact accuracy. Always conduct thorough research before making decisions.
How to use technical analysis methods to predict Q price trends?
Analyze Q price charts using moving averages, RSI, and MACD indicators. Monitor trading volume and support/resistance levels. Combine candlestick patterns with trend analysis to identify potential price movements and entry/exit points effectively.
* The information is not intended to be and does not constitute financial advice or any other recommendation of any sort offered or endorsed by Gate.