This comprehensive guide analyzes QKA (Qkacoin), a Solana-based meme token currently trading at $0.4819 with a $15.26 million market cap, providing professional price forecasts through 2031. The article reviews QKA's market position, historical price evolution from its $2.5 peak in July 2025 to current recovery trends, and delivers strategic investment insights. Price predictions range from $0.37-$0.68 in 2026, potentially reaching $1.06 by 2031 under favorable conditions. Expert analysis covers active trading strategies, risk management frameworks, asset allocation principles, and secure storage solutions via Gate Web3 Wallet. The guide addresses market volatility, regulatory risks, and technical considerations specific to meme coins. Designed for investors at all levels, it combines technical analysis tools, community sentiment monitoring, and diversification strategies to navigate QKA's high-risk profile while identifying potential opportunities.
Introduction: QKA's Market Position and Investment Value
Qkacoin (QKA), positioned as a quokka-themed meme token, has established its presence in the cryptocurrency market since its launch. As of January 24, 2026, QKA maintains a market capitalization of approximately $15.26 million, with a circulating supply of 31.67 million tokens and a current price around $0.48. This asset, characterized by its community-driven nature and SPL token standard on the Solana blockchain, is gaining attention within the meme coin sector.
This article will comprehensively analyze QKA's price trends from 2026 to 2031, combining historical patterns, market supply-demand dynamics, ecosystem development, and macroeconomic environment factors to provide professional price forecasts and practical investment strategies for investors.
I. QKA Price History Review and Market Status
QKA Historical Price Evolution Trajectory
- 2025: QKA experienced significant price volatility during its initial phase, with the price reaching a notable level of $2.5 on July 29, 2025, marking a peak in market interest.
- 2025: Following the peak, the market entered a correction phase, with the price declining to $0.15587 on December 16, 2025, reflecting broader market adjustments.
- 2026: As of January 24, 2026, QKA shows signs of recovery with a 30-day price increase of approximately 39.96%, indicating renewed market attention.
QKA Current Market Status
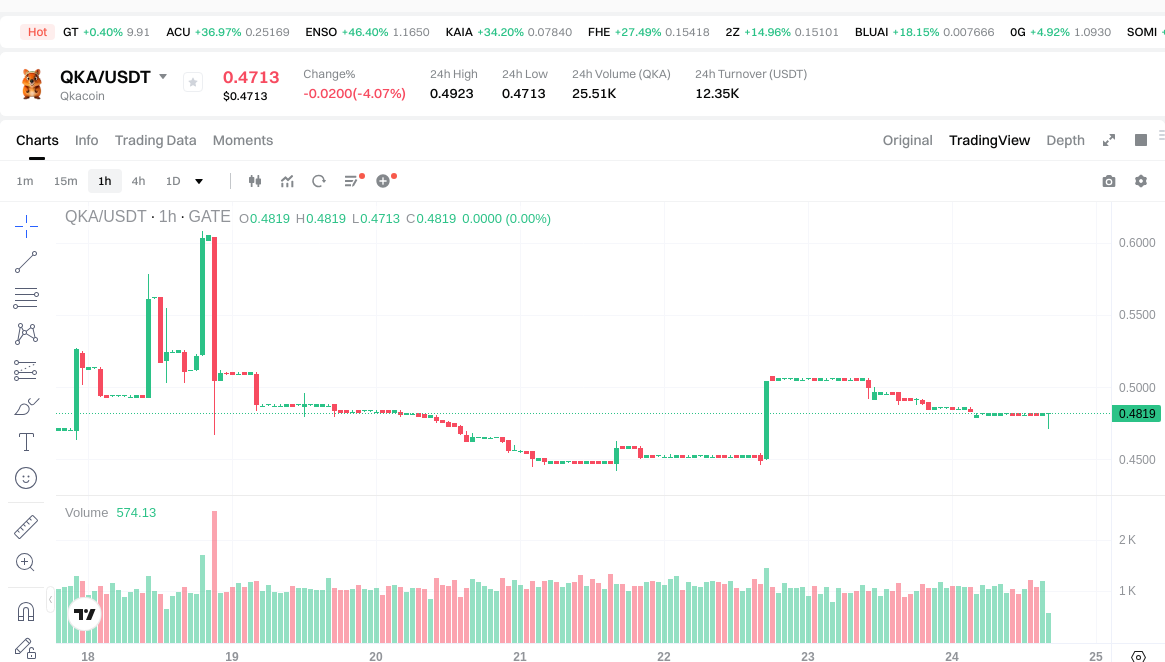
As of January 24, 2026, QKA is trading at $0.4819, with a market capitalization of approximately $15.26 million and a market ranking of 996. The token shows a circulating supply of 31,668,129 QKA, representing 100% of the maximum supply of 31,668,129 tokens.
In terms of recent price movements, QKA has experienced a decline of 2.11% over the past 24 hours, with the price ranging between $0.4794 and $0.4923. The 1-hour performance shows a slight decrease of 0.21%, while the 7-day performance indicates a positive trend with a 2.21% increase. The 30-day performance demonstrates notable growth of 39.96%, and the 1-year performance shows an increase of 33.96%.
The 24-hour trading volume stands at approximately $12,342.25, with the token deployed on the Solana blockchain using the SPL algorithm. The fully diluted valuation matches the current market capitalization at approximately $15.26 million, with a market cap to FDV ratio of 100%. The token currently accounts for 0.00048% of the total cryptocurrency market.
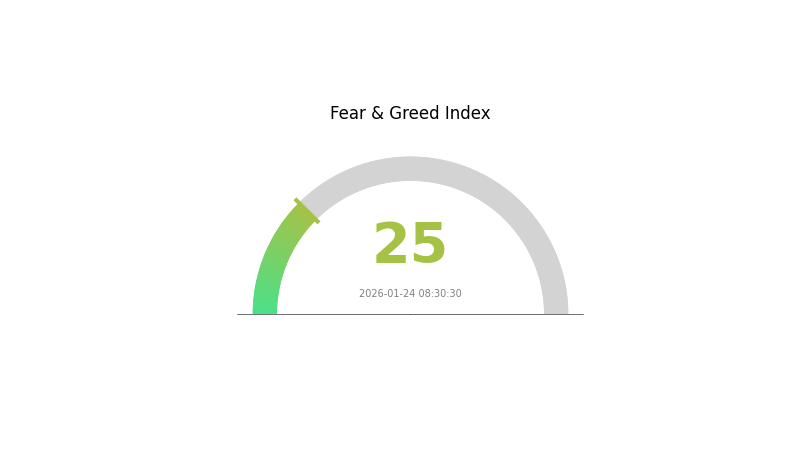
The current market sentiment index stands at 25, indicating a phase of extreme fear in the broader cryptocurrency market, which may influence investor behavior and trading activities surrounding QKA.
Click to view the current QKA market price
QKA Market Sentiment Index
2026-01-24 Fear and Greed Index: 25 (Extreme Fear)
Click to view the current Fear & Greed Index
The crypto market is currently experiencing extreme fear, with the Fear and Greed Index at 25. This indicates severe market pessimism and heightened risk aversion among investors. During such periods, asset prices typically reach lower levels, creating potential buying opportunities for long-term investors with strong risk tolerance. However, caution is advised, as extreme fear often reflects underlying market uncertainty. Investors should conduct thorough research and develop sound investment strategies before making decisions. Monitor the index closely for potential market shifts.
QKA Holdings Distribution
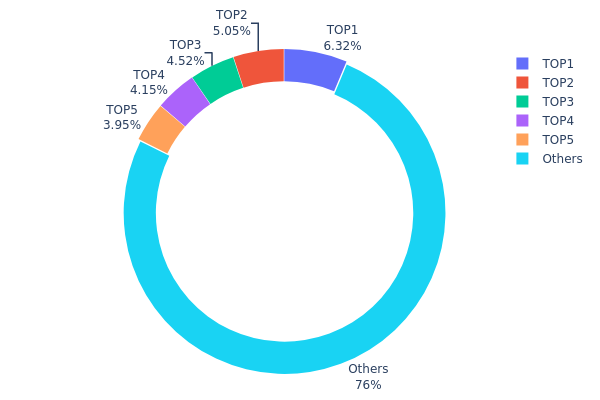
The holdings distribution chart illustrates the concentration of token ownership across different wallet addresses, providing insights into the decentralization level and potential market control dynamics. By analyzing the distribution of QKA tokens among top holders versus smaller participants, we can assess the token's structural stability and vulnerability to large-scale market manipulation.
According to the current data, QKA demonstrates a relatively moderate concentration pattern. The top five addresses collectively hold 7,595.63K tokens, representing 23.96% of the total supply. The largest single holder (DRA3dV...rx6Zry) controls 2,000K tokens or 6.31%, while the second and third largest addresses hold 5.05% and 4.51% respectively. The remaining 76.04% of tokens are distributed among other addresses, suggesting a fairly broad ownership base beyond the major stakeholders.
This distribution structure indicates a balanced market composition that mitigates extreme concentration risks while maintaining some degree of institutional presence. The absence of any single address holding more than 10% of supply reduces the likelihood of unilateral price manipulation, though coordinated actions among top holders could still influence market dynamics. The substantial 76.04% held by smaller participants reflects healthy retail engagement and demonstrates reasonable decentralization characteristics. This distribution pattern generally supports stable price discovery mechanisms and reduces vulnerability to sudden liquidity shocks from whale transactions, contributing to a more resilient on-chain ecosystem structure.
Click to view current QKA Holdings Distribution
| Top |
Address |
Holding Qty |
Holding (%) |
| 1 |
DRA3dV...rx6Zry |
2000.00K |
6.31% |
| 2 |
9Ukic7...negRSi |
1600.00K |
5.05% |
| 3 |
GhZDsp...2P4ENL |
1430.00K |
4.51% |
| 4 |
AGXpE4...qEzpEf |
1315.59K |
4.15% |
| 5 |
6WFYLZ...83ym2q |
1250.04K |
3.94% |
| - |
Others |
24072.49K |
76.04% |
II. Core Factors Influencing QKA's Future Price
Based on the provided materials, there is insufficient specific information available regarding QKA's supply mechanisms, institutional dynamics, macroeconomic positioning, or technical development roadmap to conduct a comprehensive analysis of the factors that may influence its future price trajectory.
For a thorough evaluation of QKA's price prospects, key data points would be needed including: tokenomics structure, historical supply events, institutional adoption patterns, technological upgrade schedules, and ecosystem development metrics. Without access to these fundamental data points, it would be inappropriate to speculate on price-influencing factors.
Investors interested in QKA should conduct independent research and consult official project documentation for accurate information regarding the token's fundamentals and development status.
III. 2026-2031 QKA Price Prediction
2026 Outlook
- Conservative forecast: $0.37106 - $0.4819
- Neutral forecast: Around $0.4819
- Optimistic forecast: Up to $0.67948 (requires favorable market conditions and increased adoption)
2027-2029 Medium-term Outlook
- Market stage expectation: QKA is anticipated to enter a gradual growth phase, with price volatility expected to stabilize as the project matures and market recognition improves.
- Price range forecast:
- 2027: $0.31938 - $0.66779, with an average price around $0.58069
- 2028: $0.56806 - $0.6617, with an average price around $0.62424
- 2029: $0.46937 - $0.95802, with an average price around $0.64297
- Key catalysts: Potential drivers include ecosystem expansion, strategic partnerships, technological developments, and broader cryptocurrency market sentiment.
2030-2031 Long-term Outlook
- Baseline scenario: $0.56035 - $0.8005 in 2030 (assuming steady project development and moderate market growth)
- Optimistic scenario: $0.67226 - $1.06146 by 2031 (contingent on successful ecosystem growth and positive regulatory environment)
- Transformative scenario: Prices could potentially reach the upper range of $1.06146 in 2031 (under exceptionally favorable conditions including mass adoption and significant protocol upgrades)
- 2026-01-24: QKA demonstrates early-stage price discovery with projected average trading around $0.4819
| Year |
Predicted High Price |
Predicted Average Price |
Predicted Low Price |
Price Change |
| 2026 |
0.67948 |
0.4819 |
0.37106 |
0 |
| 2027 |
0.66779 |
0.58069 |
0.31938 |
20 |
| 2028 |
0.6617 |
0.62424 |
0.56806 |
29 |
| 2029 |
0.95802 |
0.64297 |
0.46937 |
33 |
| 2030 |
0.9686 |
0.8005 |
0.56035 |
66 |
| 2031 |
1.06146 |
0.88455 |
0.67226 |
83 |
IV. QKA Professional Investment Strategy and Risk Management
QKA Investment Methodology
(1) Long-term Holding Strategy
- Suitable for: Investors with high risk tolerance who believe in the potential growth of meme coins and are willing to hold through market volatility
- Operational Recommendations:
- Consider accumulating positions during market dips, as QKA has shown a 39.96% increase over the past 30 days
- Monitor community engagement and social media activity on platforms like Twitter (https://x.com/qkacoin) to gauge project momentum
- Store assets securely using Gate Web3 Wallet for convenient access and enhanced security features
(2) Active Trading Strategy
- Technical Analysis Tools:
- Moving Averages: Use 7-day and 30-day moving averages to identify trend directions; QKA's 7-day change of 2.21% suggests short-term momentum
- Volume Analysis: Monitor the 24-hour trading volume of approximately $12,342 to assess market liquidity and trading activity
- Band Trading Key Points:
- Set profit-taking levels based on the 24-hour price range between $0.4794 and $0.4923
- Implement stop-loss orders to manage downside risk, particularly given the token's historical volatility
QKA Risk Management Framework
(1) Asset Allocation Principles
- Conservative Investors: 1-2% of crypto portfolio allocation
- Aggressive Investors: 3-5% of crypto portfolio allocation
- Professional Investors: Up to 5-8% of crypto portfolio allocation with active monitoring
(2) Risk Hedging Solutions
- Diversification Strategy: Balance QKA holdings with established cryptocurrencies and stablecoins to reduce portfolio volatility
- Position Sizing: Use dollar-cost averaging to mitigate timing risk and reduce exposure to short-term price fluctuations
(3) Secure Storage Solutions
- Hot Wallet Recommendation: Gate Web3 Wallet for active trading and convenient access to liquidity
- Cold Storage Solution: Consider hardware wallet solutions for long-term holdings to minimize security risks
- Security Considerations: Enable two-factor authentication, never share private keys, and regularly verify wallet addresses before transactions
V. QKA Potential Risks and Challenges
QKA Market Risks
- High Volatility: As a meme coin, QKA is subject to significant price swings; the token experienced a 24-hour decline of 2.11%, demonstrating inherent volatility
- Limited Exchange Availability: Currently listed on only one exchange, which may restrict liquidity and price discovery mechanisms
- Small Market Capitalization: With a market cap of approximately $15.26 million and 0.00048% market dominance, QKA faces heightened susceptibility to market manipulation
QKA Regulatory Risks
- Meme Token Scrutiny: Regulatory authorities may increase oversight of meme-based cryptocurrencies, potentially affecting trading availability
- Jurisdictional Compliance: Changes in cryptocurrency regulations across different jurisdictions could impact token accessibility and legal status
- Securities Classification: Potential regulatory classification changes could affect how QKA is traded and accessed by investors
QKA Technical Risks
- Smart Contract Vulnerabilities: As a Solana-based token, QKA relies on the security of its smart contract implementation
- Network Dependency: Token functionality depends on the Solana blockchain's performance and stability
- Holder Concentration: With only 78 holders, the token distribution may be concentrated, creating potential liquidity and price stability concerns
VI. Conclusion and Action Recommendations
QKA Investment Value Assessment
QKA represents a high-risk, high-reward opportunity within the meme coin sector. The token has demonstrated notable short-term performance with a 39.96% gain over 30 days and maintains 100% circulating supply, eliminating concerns about future token unlocks. However, investors should consider the limited exchange availability, small holder base, and inherent volatility associated with meme tokens. The project's quokka theme provides a distinctive branding angle, but long-term value depends heavily on community growth and sustained market interest.
QKA Investment Recommendations
✅ Beginners: Start with minimal allocation (less than 1% of crypto portfolio), focus on learning market dynamics, and avoid investing funds needed for essential expenses
✅ Experienced Investors: Consider tactical positions based on technical analysis and community sentiment trends, while maintaining strict risk management protocols
✅ Institutional Investors: Evaluate QKA as a speculative allocation within diversified meme coin strategies, with thorough due diligence on liquidity constraints
QKA Trading Participation Methods
- Spot Trading: Access QKA through available exchange platforms with proper verification and security measures in place
- Portfolio Integration: Incorporate QKA as part of a diversified cryptocurrency portfolio with appropriate position sizing
- Community Engagement: Monitor project developments through official channels like Twitter (https://x.com/qkacoin) and the project website (https://qkacoin.org/) to stay informed about ecosystem updates
Cryptocurrency investment carries extremely high risks. This article does not constitute investment advice. Investors should make prudent decisions based on their own risk tolerance and are advised to consult professional financial advisors. Never invest more than you can afford to lose.
FAQ
What is QKA and what is its use case?
QKA is a blockchain utility token designed for decentralized applications and smart contract ecosystems. Its primary use cases include governance participation, transaction fees, staking rewards, and access to exclusive platform features within the web3 infrastructure.
What factors influence QKA price movements?
QKA price movements are influenced by market demand and supply dynamics, overall cryptocurrency market trends, project development updates, trading volume fluctuations, regulatory announcements, and macroeconomic conditions affecting the digital asset sector.
QKA has demonstrated volatile price movements typical of emerging cryptocurrencies. Historical data shows significant fluctuations with periods of growth and correction. Price performance varies based on market conditions, adoption rates, and broader crypto market trends. For detailed historical charts and performance metrics, please check dedicated crypto tracking platforms.
How can I predict QKA price trends?
Monitor QKA market indicators including trading volume, transaction value, whale movements, and on-chain metrics. Analyze technical charts, support/resistance levels, and market sentiment. Track ecosystem developments and community activity for fundamental insights into price movements.
What are the risks of investing in QKA?
QKA faces market volatility, regulatory uncertainty, and liquidity risks. Technology adoption rates and competition may impact value. Conduct thorough research before investing, as cryptocurrency markets are highly unpredictable and speculative.
Where can I check the current price of QKA?
You can check QKA's current price on major cryptocurrency tracking platforms like CoinMarketCap and CoinGecko. These platforms display real-time price data, trading volume, market cap, and 24-hour price changes for QKA across all supported markets.
* The information is not intended to be and does not constitute financial advice or any other recommendation of any sort offered or endorsed by Gate.