This comprehensive analysis examines QuarkChain (QKC), a blockchain infrastructure solution utilizing sharding technology, currently trading at $0.004071 with a market cap of $29.32 million as of January 2026. The article provides detailed price forecasts spanning 2026-2031, ranging from conservative scenarios of $0.00319 to optimistic projections of $0.00916, based on historical trends, market sentiment, and ecosystem development. Key findings reveal highly concentrated token holdings with the top five addresses controlling 93.02% of supply, presenting both centralization risks and potential market manipulation concerns. The analysis encompasses professional investment strategies suitable for different investor profiles, comprehensive risk management frameworks including portfolio allocation guidelines, and secure storage solutions via Gate Web3 Wallet. Critical risk factors include limited liquidity ($19,831 daily volume), significant price volatility, regulatory uncertainties, and competitive pressure from
Introduction: QKC's Market Position and Investment Value
QuarkChain (QKC), positioned as a blockchain infrastructure solution based on sharding technology, has been developing since its launch in 2018. As of 2026, QKC maintains a market capitalization of approximately $29.32 million, with a circulating supply of around 7.2 billion tokens, and the price stabilizes at approximately $0.004071. This asset, designed with characteristics of security, decentralization, high throughput capacity, and scalability, is playing a role in the blockchain infrastructure sector.
This article will comprehensively analyze QKC's price trends from 2026 to 2031, combining historical patterns, market supply and demand, ecosystem development, and macroeconomic environment to provide investors with professional price forecasts and practical investment strategies.
I. QKC Price History Review and Market Status
QKC Historical Price Evolution Trajectory
- 2018: QuarkChain (QKC) launched on June 5 with an initial offering price of $0.0198, and the price experienced significant growth, reaching $0.338765 during the same period
- 2020: On March 13, the price declined to its lowest point of $0.00137714, reflecting broader market challenges
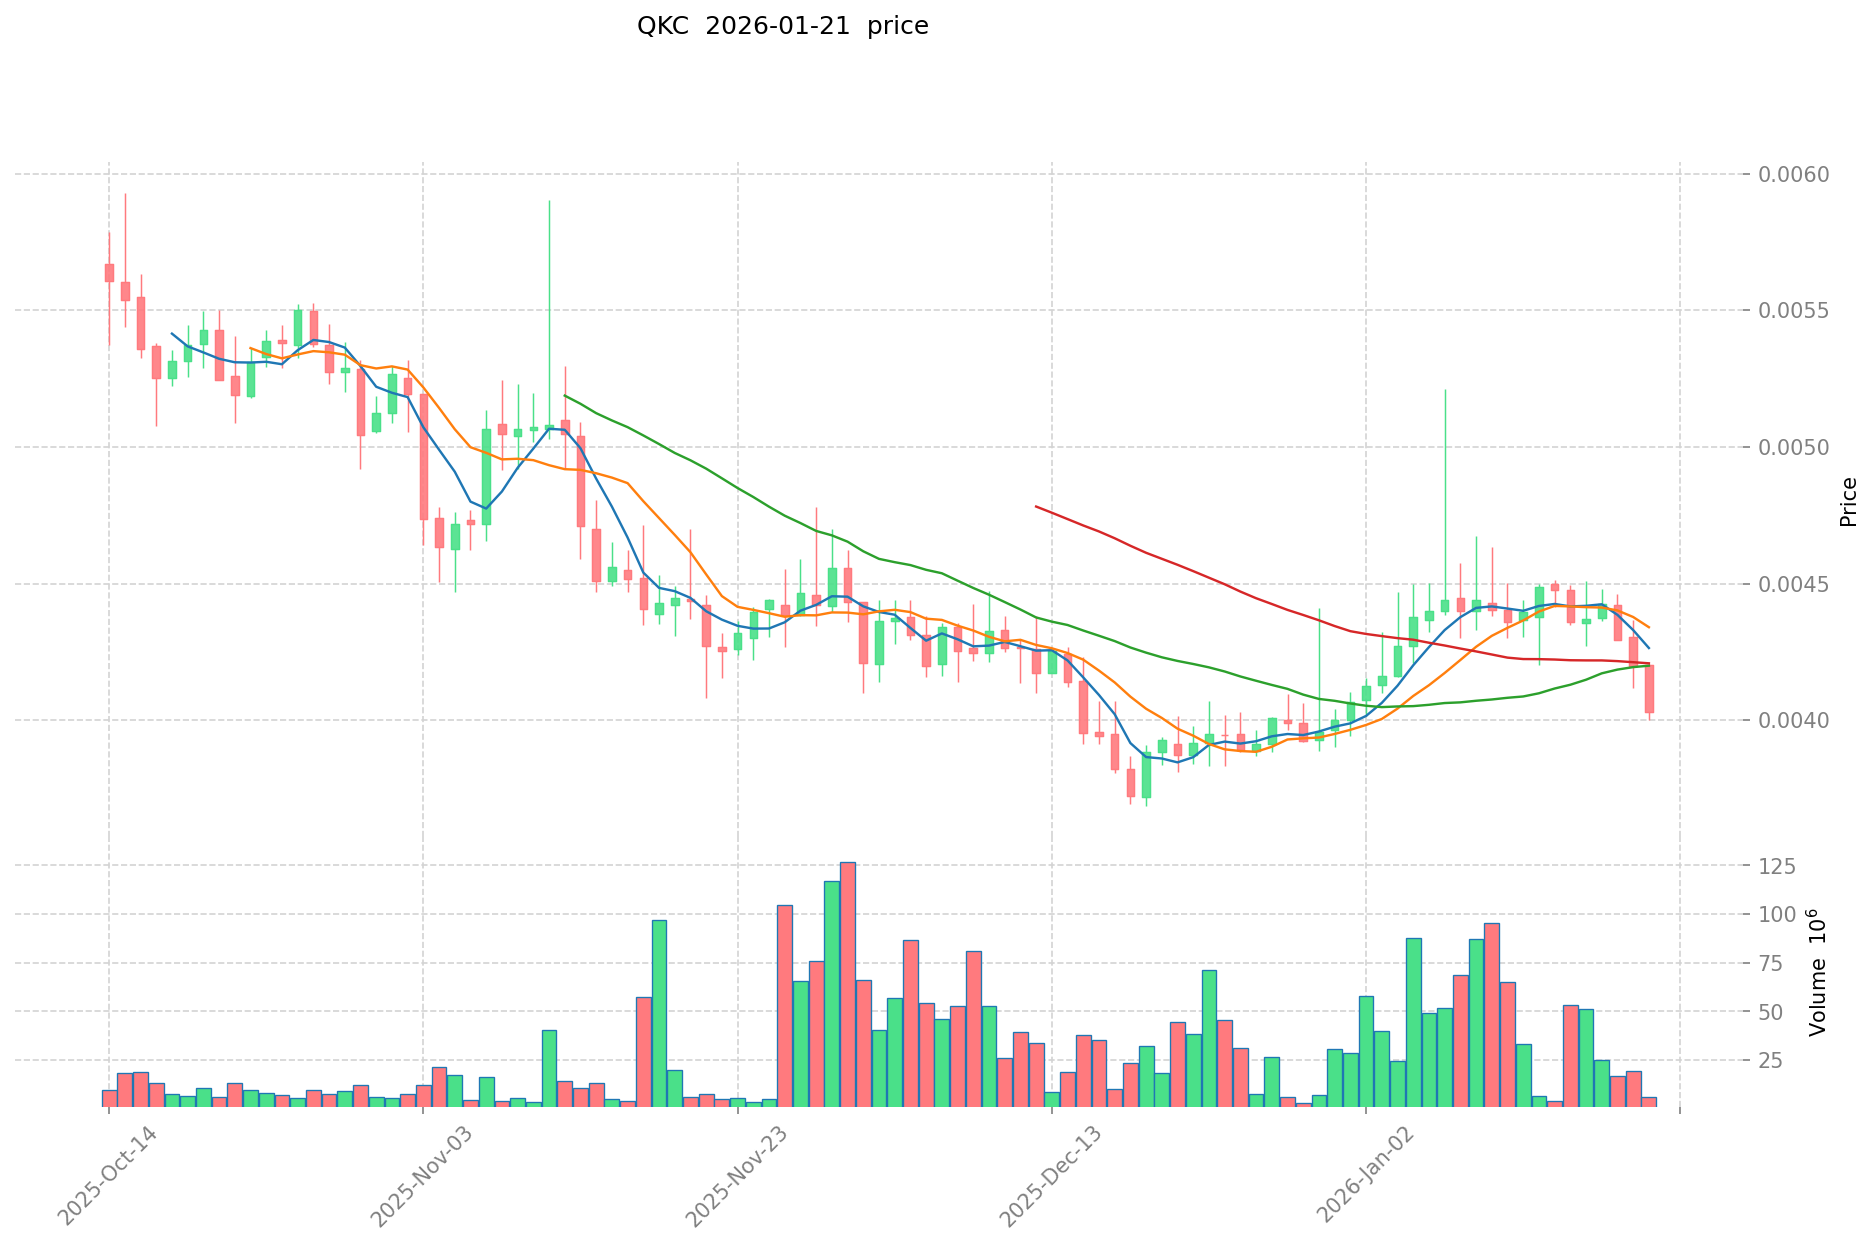
- 2025: Over the past year, the token has shown considerable volatility, with the price declining from approximately $0.00988 to the current level
QKC Current Market Situation
As of January 21, 2026, QuarkChain (QKC) is trading at $0.004071, with a 24-hour trading volume of $19,830.98. The token has experienced a price decrease of 1.06% over the past 24 hours, with the daily price range fluctuating between $0.004 and $0.004117. Over the past week, QKC has declined by 7.64%, while showing a monthly increase of 3.86%.
The current market capitalization stands at approximately $29.32 million, with a circulating supply of 7.20 billion QKC tokens out of a total supply of 10 billion, representing a circulation ratio of 72.02%. The fully diluted market cap reaches $40.71 million. The token maintains a market dominance of 0.0012% and is currently listed on 15 exchanges, with trading availability on Gate.com. The token holder count has reached 10,053 addresses.
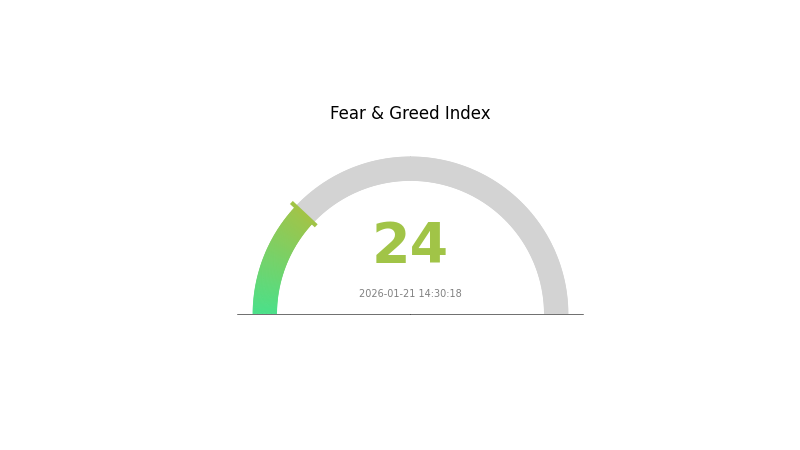
The Fear and Greed Index currently registers at 24, indicating an "Extreme Fear" sentiment in the broader cryptocurrency market, which may be contributing to the recent price pressure on QKC.
Click to view the current QKC market price
QKC Market Sentiment Indicator
2026-01-21 Fear and Greed Index: 24 (Extreme Fear)
Click to view the current Fear & Greed Index
The cryptocurrency market is currently experiencing extreme fear with an index reading of 24. This indicates heightened market anxiety and pessimism among investors. When the fear and greed index reaches extreme fear levels, it often signals potential buying opportunities for contrarian investors. However, market volatility remains elevated during such periods. Investors should exercise caution and conduct thorough research before making investment decisions. Monitor market developments closely as sentiment may shift rapidly in response to macroeconomic factors and regulatory news.
QKC Holding Distribution
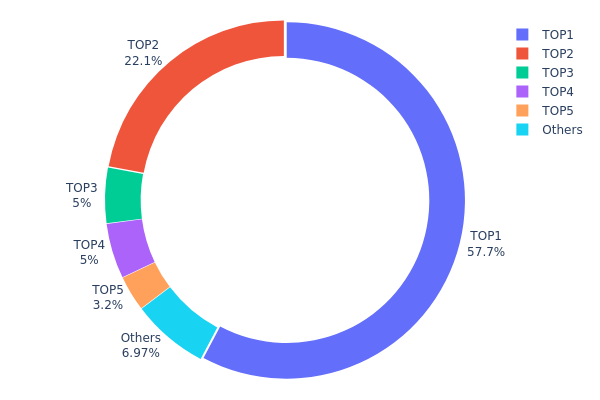
The holding distribution chart visually represents the allocation of QKC tokens across different wallet addresses, serving as a crucial metric for assessing the degree of decentralization and potential concentration risks within the token's ecosystem. According to the latest on-chain data, the top five addresses collectively control 9,302,823.51K QKC, accounting for 93.02% of the total circulating supply, revealing a highly concentrated holding structure.
The most prominent feature is the dominant position of the top address (0x0000...514b43), which alone holds 5,773,253.15K tokens, representing 57.73% of the total supply. The second-largest holder controls 22.09%, while the third and fourth addresses each maintain exactly 5.00%. This distribution pattern suggests that approximately 93% of the circulating supply is controlled by fewer than five entities, indicating an extremely centralized token structure. Such concentration significantly deviates from the decentralization principles typically associated with blockchain projects and raises concerns about potential market manipulation risks.
From a market structure perspective, this high concentration level creates notable vulnerabilities. Large holders possess substantial influence over price movements, as significant sell-offs could trigger sharp price volatility or even market crashes. Additionally, this structure limits liquidity depth, making the token susceptible to price manipulation. The relatively small portion held by other addresses (6.98%) suggests limited retail participation and insufficient distribution across the broader community, which may hinder organic market development and price discovery mechanisms.
Click to view current QKC Holding Distribution
| Top |
Address |
Holding Qty |
Holding (%) |
| 1 |
0x0000...514b43 |
5773253.15K |
57.73% |
| 2 |
0xbb3d...8fc34b |
2209496.93K |
22.09% |
| 3 |
0xb4c9...897ee1 |
500000.00K |
5.00% |
| 4 |
0x9539...2d4cd0 |
500000.00K |
5.00% |
| 5 |
0xf977...41acec |
320073.43K |
3.20% |
| - |
Others |
697176.49K |
6.98% |
II. Core Factors Influencing QKC's Future Price
Due to the absence of relevant data in the provided materials and limitations in the knowledge base, a comprehensive analysis of the core factors affecting QKC's future price cannot be generated at this time. Key aspects such as supply mechanisms, institutional dynamics, macroeconomic conditions, and technological developments require specific data points that are not currently available for accurate reporting.
For the most up-to-date information on QKC, users are encouraged to monitor official project announcements and conduct their own research through reliable cryptocurrency data sources.
III. 2026-2031 QKC Price Prediction
2026 Outlook
- Conservative forecast: $0.00319 - $0.00409
- Neutral forecast: $0.00409 (average scenario)
- Optimistic forecast: $0.00479 (requires favorable market conditions and increased adoption)
2027-2029 Outlook
- Market stage expectation: Gradual accumulation phase with moderate volatility as the project develops its ecosystem
- Price range forecast:
- 2027: $0.00284 - $0.00541
- 2028: $0.00286 - $0.00606
- 2029: $0.00533 - $0.00593
- Key catalysts: Technology upgrades, partnership expansion, and broader blockchain adoption may drive price growth during this period
2030-2031 Long-term Outlook
- Baseline scenario: $0.0052 - $0.00737 (assuming steady market development and platform maturation)
- Optimistic scenario: $0.00654 - $0.00916 (contingent on significant ecosystem expansion and increased user adoption)
- Transformational scenario: Approaching $0.00916 (requires breakthrough partnerships, major protocol upgrades, and favorable regulatory environment)
- 2026-01-21: QKC baseline average prediction stands at $0.00409 (establishing foundation for potential multi-year growth trajectory)
| Year |
Predicted High Price |
Predicted Average Price |
Predicted Low Price |
Price Change |
| 2026 |
0.00479 |
0.00409 |
0.00319 |
0 |
| 2027 |
0.00541 |
0.00444 |
0.00284 |
9 |
| 2028 |
0.00606 |
0.00493 |
0.00286 |
20 |
| 2029 |
0.00593 |
0.00549 |
0.00533 |
34 |
| 2030 |
0.00737 |
0.00571 |
0.0052 |
40 |
| 2031 |
0.00916 |
0.00654 |
0.00425 |
60 |
IV. QKC Professional Investment Strategy and Risk Management
QKC Investment Methodology
(1) Long-term Holding Strategy
- Suitable for: Investors seeking exposure to blockchain scalability solutions with a multi-year investment horizon
- Operational Recommendations:
- Consider dollar-cost averaging to mitigate entry timing risk, given QKC's historical price volatility
- Monitor project development milestones and network adoption metrics quarterly
- Storage Solution: Utilize Gate Web3 Wallet for secure custody, with private key backup stored in multiple secure locations
(2) Active Trading Strategy
- Technical Analysis Tools:
- Moving Averages: Use 50-day and 200-day moving averages to identify potential trend reversals, particularly relevant given QKC's -7.64% weekly decline
- Volume Analysis: Monitor the current 24-hour trading volume of approximately $19,831 against historical averages to gauge market interest
- Swing Trading Key Points:
- Current 24-hour range of $0.004000-$0.004117 suggests limited intraday volatility
- The -58.77% annual performance indicates consideration of risk-reward ratios before position entry
QKC Risk Management Framework
(1) Asset Allocation Principles
- Conservative Investors: 1-2% of crypto portfolio allocation
- Aggressive Investors: 3-5% of crypto portfolio allocation
- Professional Investors: Up to 5-7% with active hedging strategies
(2) Risk Hedging Solutions
- Position Sizing: Limit single position exposure based on the current market cap of approximately $29.32 million and ranking of #728
- Stop-Loss Implementation: Consider implementing stop-loss orders at key technical support levels
(3) Secure Storage Solutions
- Hot Wallet Recommendation: Gate Web3 Wallet for active trading positions and convenient access
- Cold Storage Solution: Hardware wallet storage for long-term holdings exceeding short-term trading needs
- Security Considerations: Verify contract address (0xea26c4ac16d4a5a106820bc8aee85fd0b7b2b664 on Ethereum) when transferring tokens, enable two-factor authentication, and maintain updated security protocols
V. QKC Potential Risks and Challenges
QKC Market Risks
- Liquidity Risk: With 24-hour trading volume of approximately $19,831 and listing on 15 exchanges, liquidity may be limited during volatile market conditions
- Price Volatility: Historical price range from $0.00138 (March 2020) to $0.33877 (June 2018) demonstrates significant price fluctuation potential
- Market Position Risk: Current ranking at #728 with 0.0012% market dominance indicates limited market presence compared to major blockchain projects
QKC Regulatory Risks
- Compliance Evolution: Ongoing regulatory developments in major markets may impact project operations and token utility
- Cross-border Considerations: As a blockchain infrastructure project, regulatory approaches across different jurisdictions may affect adoption
- Token Classification: Potential regulatory classification changes could impact trading availability and investor access
QKC Technical Risks
- Technology Competition: Competition from other layer-1 blockchain solutions and sharding implementations may affect market positioning
- Network Security: As with any blockchain network, potential security vulnerabilities require ongoing monitoring and updates
- Adoption Challenges: The project's ability to achieve stated throughput targets and maintain network decentralization remains subject to execution risk
VI. Conclusion and Action Recommendations
QKC Investment Value Assessment
QuarkChain represents a blockchain infrastructure project focused on sharding technology with a stated capacity of 100,000+ TPS. The current market valuation of approximately $29.32 million and recent price performance (-58.77% annually, -7.64% weekly) suggest the project faces adoption challenges in a competitive landscape. The circulating supply represents 72.02% of the 10 billion total supply (with unlimited maximum supply), which may present dilution considerations. Long-term value depends on successful technology implementation and network adoption, while short-term risks include continued price volatility and limited liquidity.
QKC Investment Recommendations
✅ Beginners: Exercise caution given high volatility and limited liquidity; if interested, allocate only a minimal portion of crypto portfolio (under 2%) and prioritize learning about blockchain sharding technology
✅ Experienced Investors: Consider as a speculative position within a diversified crypto portfolio (2-3%), monitoring development progress and network metrics for signs of adoption growth
✅ Institutional Investors: Conduct thorough due diligence on technology implementation, competitive positioning, and long-term sustainability before position consideration; evaluate liquidity constraints relative to position size
QKC Trading Participation Methods
- Spot Trading: Available on Gate.com and 14 other exchanges for direct token purchases
- Custody Solutions: Store assets using Gate Web3 Wallet or hardware wallet solutions with proper security protocols
- Portfolio Integration: Consider QKC as part of a broader blockchain infrastructure thesis alongside other layer-1 projects with appropriate risk management
Cryptocurrency investment carries extremely high risk, and this article does not constitute investment advice. Investors should make careful decisions based on their own risk tolerance and are advised to consult professional financial advisors. Never invest more than you can afford to lose.
FAQ
What is QKC (QuarkChain), its main uses and technical features?
QuarkChain is a blockchain platform designed for high-throughput transactions using sharding technology. It enables scalable smart contracts and decentralized applications with improved transaction speed and reduced fees. The network utilizes a two-layer architecture combining shards and a root chain for enhanced performance and security.
What are the main factors affecting QKC price?
QKC price is influenced by market demand, trading volume, network adoption, developer activity, overall crypto market sentiment, technological upgrades, and macroeconomic conditions. These factors collectively determine QKC's market valuation and price movements.
How to conduct QKC price prediction and what analysis methods can be referenced?
QKC price prediction can utilize technical analysis(examining charts and trading volume),fundamental analysis(assessing project development and partnerships),and market sentiment analysis. Consider historical price trends, on-chain metrics, and macroeconomic factors for comprehensive forecasting.
What are the advantages and disadvantages of QKC compared to mainstream public chain tokens like ETH and SOL?
QKC offers faster transaction speeds and lower fees through its sharding technology. However, it has smaller ecosystem scale and lower liquidity compared to ETH and SOL. QKC excels in efficiency but trails in network adoption and developer support.
What risks exist when investing in QKC and how should they be assessed and managed?
QKC investment risks include market volatility, liquidity fluctuations, and technological changes. Assess risks by monitoring trading volume, project developments, and market trends. Manage exposure through diversification, position sizing, and regular portfolio reviews aligned with your risk tolerance and investment goals.
* The information is not intended to be and does not constitute financial advice or any other recommendation of any sort offered or endorsed by Gate.