This comprehensive guide analyzes SuperRare's RARE token, currently trading at $0.02546 with a $20.87 million market cap. The article examines RARE's historical performance from its August 2021 launch through January 2026, revealing a significant decline from its $3.64 all-time high. It provides detailed price forecasts spanning 2026-2031, ranging from conservative scenarios ($0.02206) to optimistic outlooks ($0.05194+). The guide offers professional investment strategies including long-term holding and active trading approaches via Gate, comprehensive risk management frameworks, and critical risk assessments covering market volatility, liquidity constraints, and regulatory uncertainties. Designed for beginners through institutional investors, this resource equips readers with actionable insights for informed RARE investment decisions within the NFT marketplace sector.
Introduction: RARE's Market Position and Investment Value
SuperRare (RARE) serves as a pioneering NFT marketplace token focused on digital art collection and trading, having launched in August 2021. Since its inception, the project has established itself as a platform enabling artists to create, sell, and collect unique digital artworks through blockchain technology. As of January 2026, RARE maintains a market capitalization of approximately $20.87 million with a circulating supply of around 819.83 million tokens, trading at $0.02546. This asset, recognized for its role in the digital art ecosystem, continues to facilitate value exchange within the NFT creator economy.
This article will comprehensively analyze RARE's price trajectory from 2026 through 2031, combining historical patterns, market supply-demand dynamics, ecosystem development, and macroeconomic conditions to provide investors with professional price forecasts and practical investment strategies.
I. RARE Price History Review and Market Status
RARE Historical Price Evolution Trajectory
- 2021: RARE launched on August 18, 2021 with a publish price of $0.1, the token reached its all-time high of $3.64 on October 11, 2021, representing substantial growth within the initial months of trading
- 2022-2024: The token experienced a prolonged bearish trend aligned with broader crypto market cycles, gradually declining from its peak levels
- 2025: RARE continued its downward trajectory and recorded its all-time low of $0.01801027 on October 11, 2025, reflecting challenging market conditions for NFT-related tokens
RARE Current Market Status
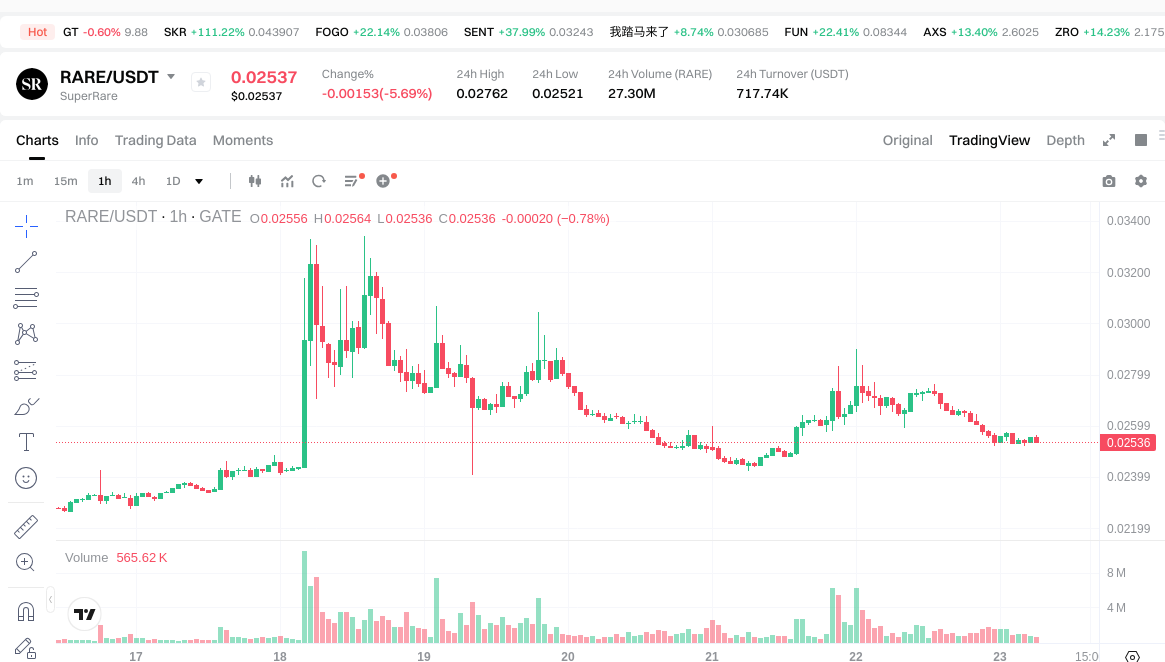
As of January 23, 2026, RARE is trading at $0.02546, with a 24-hour trading volume of $717,876.86. The token has shown mixed short-term performance, declining 0.16% in the past hour and 5.21% over the last 24 hours. However, medium-term indicators suggest some recovery momentum, with RARE gaining 12.75% over the past 7 days and 19.08% over the past 30 days. The 24-hour price range spans from $0.02521 to $0.02762.
RARE currently holds a market capitalization of $20.87 million with 819.83 million tokens in circulation, representing approximately 81.98% of the maximum supply of 1 billion tokens. The token ranks #858 by market cap and maintains a market dominance of 0.00080%. The fully diluted market cap stands at $25.46 million, indicating limited additional dilution risk. With 11,840 token holders and trading availability on 27 exchanges, RARE maintains moderate liquidity within the NFT marketplace sector.
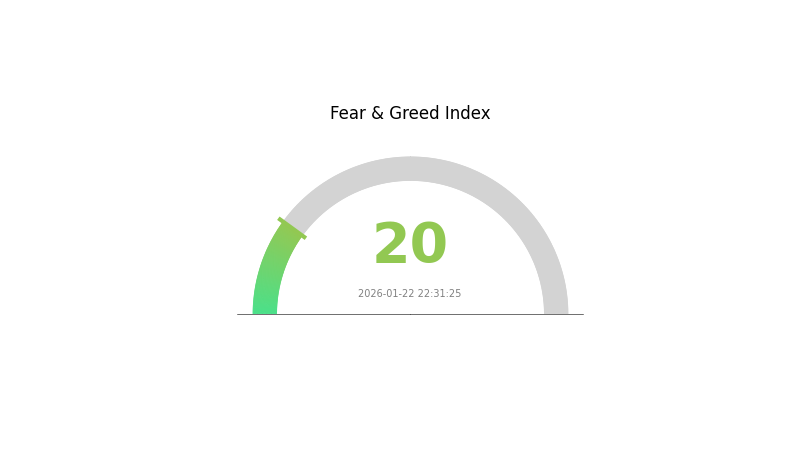
The current market sentiment index registers at 20, indicating an "Extreme Fear" environment among crypto investors, which may be influencing broader trading patterns across digital assets including RARE.
Click to view current RARE market price
RARE Market Sentiment Indicator
2026-01-22 Fear and Greed Index: 20 (Extreme Fear)
Click to view current Fear & Greed Index
The RARE cryptocurrency market is currently experiencing extreme fear conditions, with the Fear and Greed Index plummeting to 20. This reading indicates widespread market pessimism and panic selling pressure among investors. When fear reaches such extreme levels, it often presents contrarian opportunities for long-term investors. However, extreme fear can also signal potential further downside risks. Traders should exercise caution and maintain proper risk management strategies. Monitor market developments closely on Gate.com for real-time updates and trading opportunities during this volatile period.
RARE Token Holdings Distribution
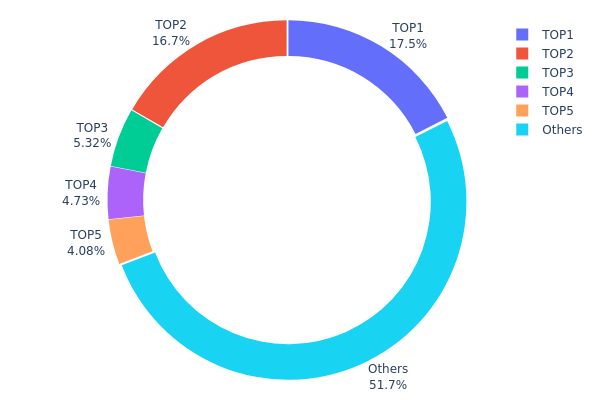
The token holdings distribution chart illustrates the concentration of RARE tokens across different wallet addresses, providing insights into the degree of decentralization and potential market control dynamics. By analyzing the percentage of total supply held by top addresses versus smaller holders, this metric helps assess whether token ownership is widely distributed or concentrated among a few major stakeholders.
Based on the current data, RARE exhibits a relatively concentrated holdings structure. The top address controls 175.20 million tokens (17.51% of total supply), while the second-largest holder possesses 166.77 million tokens (16.67%). Combined, these two addresses alone control over 34% of the circulating supply, indicating significant concentration at the top tier. The top five addresses collectively hold approximately 48.31% of all tokens, with the remaining 51.69% distributed among other holders.
This concentration level presents both opportunities and risks for the RARE market. On one hand, such distribution suggests that major stakeholders likely have strong conviction in the project's long-term value, potentially providing price stability during market downturns. On the other hand, the substantial holdings by top addresses create potential vulnerability to large-scale sell pressure if these entities decide to liquidate positions. The market could experience significant volatility if any of the top holders engage in substantial trading activity. Additionally, this concentration level may raise concerns about potential price manipulation, as coordinated actions by major holders could disproportionately influence market dynamics. For retail investors and institutional participants considering RARE exposure, understanding this distribution pattern is crucial for risk assessment and portfolio allocation decisions.
Click to view current RARE Holdings Distribution
| Top |
Address |
Holding Qty |
Holding (%) |
| 1 |
0x860a...b48da9 |
175195.32K |
17.51% |
| 2 |
0xf977...41acec |
166770.79K |
16.67% |
| 3 |
0x76ec...78fbd3 |
53231.93K |
5.32% |
| 4 |
0xb521...b36323 |
47310.37K |
4.73% |
| 5 |
0x492e...c4778d |
40840.07K |
4.08% |
| - |
Others |
516651.53K |
51.69% |
II. Core Factors Influencing RARE's Future Price
Based on the available information, there is insufficient data to provide a comprehensive analysis of the core factors that may influence RARE's future price. The provided materials do not contain specific details regarding supply mechanisms, institutional holdings, macroeconomic factors, or technical developments related to RARE.
To conduct a thorough analysis of RARE's price drivers, additional information would be needed covering supply dynamics, major stakeholder activities, broader market conditions, and ecosystem developments. Investors are encouraged to conduct their own research and consult multiple sources before making investment decisions.
III. 2026-2031 RARE Price Forecast
2026 Outlook
- Conservative prediction: $0.02206 - $0.02536
- Neutral prediction: $0.02536
- Optimistic prediction: $0.03449 (contingent on favorable market conditions)
2027-2029 Outlook
- Market stage expectation: Gradual recovery phase with moderate volatility, as the crypto market may enter a consolidation period following previous cycles
- Price range forecast:
- 2027: $0.02544 - $0.0413
- 2028: $0.02279 - $0.03703
- 2029: $0.02288 - $0.05013
- Key catalysts: Broader adoption of NFT platforms, increased trading volume on Gate.com, and potential partnerships within the digital collectibles ecosystem
2030-2031 Long-term Outlook
- Baseline scenario: $0.02421 - $0.04322 (assuming steady market growth and sustained platform development)
- Optimistic scenario: $0.03117 - $0.05194 (assuming accelerated NFT market expansion and enhanced platform utility)
- Transformative scenario: Above $0.05194 (contingent on breakthrough technological integration and mainstream NFT adoption)
- 2026-01-23: RARE maintains a trading range between $0.02206 and $0.03449, reflecting current market positioning
| Year |
Predicted High Price |
Predicted Average Price |
Predicted Low Price |
Price Change |
| 2026 |
0.03449 |
0.02536 |
0.02206 |
0 |
| 2027 |
0.0413 |
0.02992 |
0.02544 |
17 |
| 2028 |
0.03703 |
0.03561 |
0.02279 |
39 |
| 2029 |
0.05013 |
0.03632 |
0.02288 |
42 |
| 2030 |
0.04711 |
0.04322 |
0.02421 |
69 |
| 2031 |
0.05194 |
0.04517 |
0.03117 |
77 |
IV. RARE Professional Investment Strategy and Risk Management
RARE Investment Methodology
(1) Long-term Holding Strategy
- Suitable for: NFT art enthusiasts and digital collectibles believers
- Operational Recommendations:
- Consider accumulating positions during market corrections when RARE trades near support levels
- Monitor SuperRare platform activity metrics and artist engagement trends
- Utilize Gate Web3 Wallet for secure storage with multi-signature protection
(2) Active Trading Strategy
- Technical Analysis Tools:
- Volume Profile: Track the 24-hour trading volume of $717,876 to identify accumulation and distribution zones
- Support and Resistance Levels: The recent 24-hour range of $0.02521-$0.02762 provides reference points for entry and exit
- Swing Trading Key Points:
- Set stop-loss orders 5-8% below entry points to manage downside risk
- Monitor correlation with broader NFT market sentiment and Ethereum network activity
RARE Risk Management Framework
(1) Asset Allocation Principles
- Conservative Investors: 1-2% of crypto portfolio
- Aggressive Investors: 3-5% of crypto portfolio
- Professional Investors: 5-10% with active hedging strategies
(2) Risk Hedging Solutions
- Portfolio Diversification: Combine RARE with established cryptocurrencies to reduce sector-specific risk
- Position Sizing: Use dollar-cost averaging to mitigate volatility impact given RARE's 5.21% 24-hour decline
(3) Secure Storage Solutions
- Hot Wallet Recommendation: Gate Web3 Wallet for active trading with convenient access
- Cold Storage Solution: Hardware wallet integration for long-term holdings exceeding $1,000
- Security Precautions: Enable two-factor authentication, regularly update wallet software, and never share private keys or seed phrases
V. RARE Potential Risks and Challenges
RARE Market Risks
- High Volatility: RARE experienced a 74.09% decline over the past year, demonstrating significant price fluctuations
- Limited Liquidity: With a market cap of approximately $20.87 million and ranking at #858, liquidity may be constrained during market stress
- NFT Market Dependency: RARE's value is closely tied to the cyclical nature of NFT market sentiment and digital art demand
RARE Regulatory Risks
- NFT Classification Uncertainty: Evolving regulatory frameworks may impact how NFT platforms and associated tokens are treated across different jurisdictions
- Securities Law Considerations: Potential regulatory scrutiny regarding token utility and investment characteristics
- Platform Compliance Requirements: SuperRare's operations may face increasing compliance costs as regulations develop
RARE Technical Risks
- Smart Contract Vulnerabilities: Although SuperRare operates on Ethereum, smart contract bugs or exploits could affect platform functionality
- Network Dependency: RARE's infrastructure relies on Ethereum network stability and gas fee economics
- Platform Competition: Emerging NFT marketplaces may erode SuperRare's market share and reduce RARE token utility
VI. Conclusion and Action Recommendations
RARE Investment Value Assessment
RARE represents exposure to the digital art and NFT marketplace sector through SuperRare's platform. With a circulating supply of 819.83 million tokens (81.98% of max supply) and a current price of $0.02546, the token trades significantly below its all-time high of $3.64 reached in October 2021. While the 7-day performance shows a 12.75% gain and 30-day performance indicates a 19.08% increase, the substantial year-over-year decline of 74.09% suggests investors should approach with caution. The token's long-term value depends on SuperRare's ability to maintain relevance in the competitive NFT marketplace and drive meaningful utility for RARE holders.
RARE Investment Recommendations
✅ Beginners: Consider starting with small position sizes (under 2% of portfolio) and prioritize education about NFT markets before investing. Use Gate.com for straightforward access and secure storage via Gate Web3 Wallet.
✅ Experienced Investors: Evaluate RARE as a tactical allocation within NFT sector exposure, employing technical analysis for entry timing. Monitor platform metrics and artist community engagement as fundamental indicators.
✅ Institutional Investors: Conduct thorough due diligence on SuperRare's competitive positioning, token economics, and regulatory exposure. Consider RARE as part of a diversified digital assets strategy with appropriate risk controls.
RARE Trading Participation Methods
- Spot Trading: Purchase RARE directly on Gate.com with support for multiple fiat and crypto pairs
- Dollar-Cost Averaging: Establish systematic purchase plans to smooth out volatility over time
- Strategic Accumulation: Monitor market sentiment indicators and accumulate during periods of reduced NFT market enthusiasm
Cryptocurrency investment carries extremely high risk. This article does not constitute investment advice. Investors should make cautious decisions based on their own risk tolerance and are advised to consult professional financial advisors. Never invest more than you can afford to lose.
FAQ
What is RARE token? What are its uses and application scenarios?
RARE token powers the SuperRare ecosystem, enabling digital art creation, NFT trading, and creator monetization. It facilitates governance, staking rewards, and community participation in the decentralized art marketplace.
RARE has shown volatility typical of digital collectible tokens. Early listings saw significant price discovery, with major movements correlating to platform developments and NFT market cycles. Long-term trends reflect growing adoption, with periodic consolidation phases. Current market dynamics suggest continued potential for value appreciation as the ecosystem expands.
What are the main factors affecting RARE price?
RARE price is influenced by market demand, trading volume, project developments, NFT ecosystem trends, community sentiment, and overall cryptocurrency market conditions.
What is the price prediction for RARE in 2024? How do professional analysts view it?
Based on 2024 analysis, RARE showed strong fundamentals with increasing adoption. Professional analysts projected prices ranging from $0.15 to $0.35, driven by growing transaction volume and ecosystem development. However, market conditions significantly influenced actual performance throughout the year.
What are RARE's advantages or disadvantages compared to similar tokens?
RARE excels in community engagement and unique NFT integration, offering superior liquidity and lower transaction fees. However, it faces competition from established tokens with larger trading volumes and broader market adoption.
What are the main risks of investing in RARE? What issues should I pay attention to?
RARE investment risks include market volatility, liquidity fluctuations, project development uncertainty, and regulatory changes. Monitor tokenomics, team progress, and market sentiment. Start with capital you can afford to lose and diversify your portfolio accordingly.
* The information is not intended to be and does not constitute financial advice or any other recommendation of any sort offered or endorsed by Gate.