This comprehensive analysis examines Radiant (RDNT), an omnichain money market built on LayerZero infrastructure, currently trading at $0.008172 with a $10.56 million market cap. The article reviews RDNT's historical performance, including its 2022 peak of $0.585268 and recent market volatility, while assessing current sentiment amid extreme fear conditions. Using technical analysis and ecosystem development indicators, the forecast projects RDNT reaching $0.011-0.01956 by 2031, with detailed yearly predictions from 2026-2031. The guide provides tailored investment strategies for different investor types, emphasizing risk management through diversification and position sizing. Available on Gate and 22 other exchanges, RDNT carries substantial risks including volatility, smart contract vulnerabilities, and regulatory uncertainty, making it suitable only for experienced DeFi investors with strong risk tolerance.
Introduction: RDNT's Market Position and Investment Value
Radiant (RDNT), positioned as the first omnichain money market built on LayerZero infrastructure, has been developing its cross-chain lending ecosystem since its inception. As of 2026, RDNT maintains a market capitalization of approximately $10.56 million, with a circulating supply of around 1.29 billion tokens, and the price hovering at $0.008172. This asset, designed to enable users to deposit major assets on any blockchain and borrow supported assets across multiple chains, is playing an increasingly important role in the decentralized finance sector.
This article will comprehensively analyze RDNT's price trajectory from 2026 to 2031, combining historical patterns, market supply and demand dynamics, ecosystem development, and macroeconomic conditions to provide investors with professional price forecasts and practical investment strategies.
I. RDNT Price History Review and Market Status
RDNT Historical Price Evolution Trajectory
- 2022: RDNT reached a notable price level of $0.585268 on September 16, representing its peak performance during the platform's early development phase
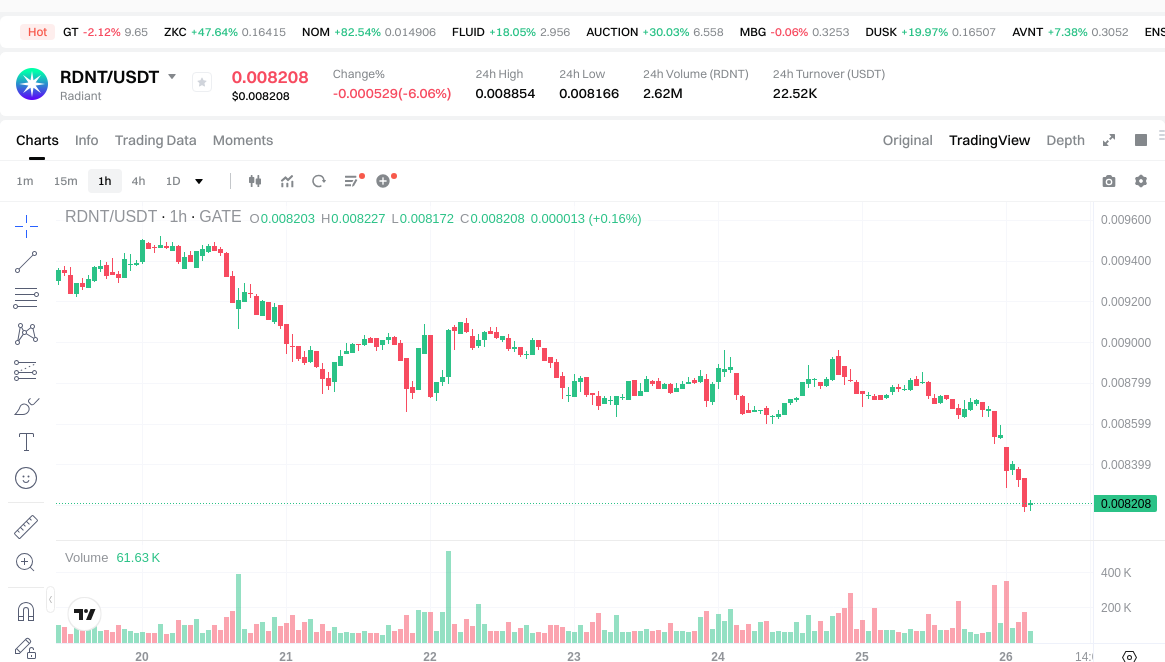
- 2026: Price experienced significant volatility, with the market recording $0.00820303 on January 26, marking a substantial correction from previous levels
RDNT Current Market Situation
As of January 26, 2026, RDNT is trading at $0.008172, with a 24-hour trading volume of $22,488.35. The token has experienced a 6.29% decline over the past 24 hours, with intraday prices ranging between $0.008166 and $0.008854.
Over different time periods, RDNT has shown varied performance: a 0.69% decrease in the past hour, an 18.86% decline over the past week, an 11.35% drop over the past month, and an 82.86% decrease over the past year.
The current circulating supply stands at 1,292,073,967 RDNT tokens, representing 86.14% of the maximum supply of 1,500,000,000 tokens. The market capitalization is $10,558,828, with a fully diluted market cap of $12,258,000. RDNT holds a market dominance of 0.00040%.
Radiant operates as an omnichain money market built on LayerZero technology. The platform enables users to deposit major assets on any supported chain and borrow various assets across multiple chains. RDNT serves as the native utility token, with emissions distributed to lenders, borrowers, and RDNT/WETH liquidity providers.
The token is deployed across multiple blockchain networks, with contract addresses on Arbitrum (0x3082cc23568ea640225c2467653db90e9250aaa0), BSC (0xf7DE7E8A6bd59ED41a4b5fe50278b3B7f31384dF), and Ethereum (0x137dDB47Ee24EaA998a535Ab00378d6BFa84F893). The project maintains an active presence through its official website and social channels.
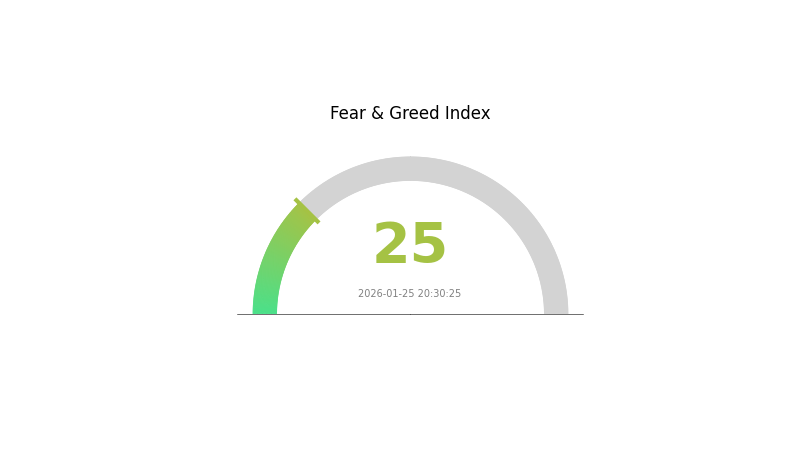
RDNT is currently listed on 23 exchanges, with 1,921 token holders participating in the ecosystem. The cryptocurrency fear and greed index stands at 25, indicating an "Extreme Fear" sentiment in the broader market.
Click to view the current RDNT market price
Market Sentiment Indicator
01-25-2026 Fear and Greed Index: 25 (Extreme Fear)
Click to view current Fear & Greed Index
The cryptocurrency market is currently experiencing extreme fear, with the Fear and Greed Index standing at 25. This indicates strong negative sentiment and widespread concern among investors. Such extreme fear levels typically present contrarian opportunities, as panic-driven selling often creates potential entry points for long-term investors. Market participants should exercise caution and conduct thorough due diligence. However, historically, extreme fear periods have often preceded significant recoveries. Monitor market developments closely and consider your risk tolerance before making investment decisions.
RDNT 持仓分布
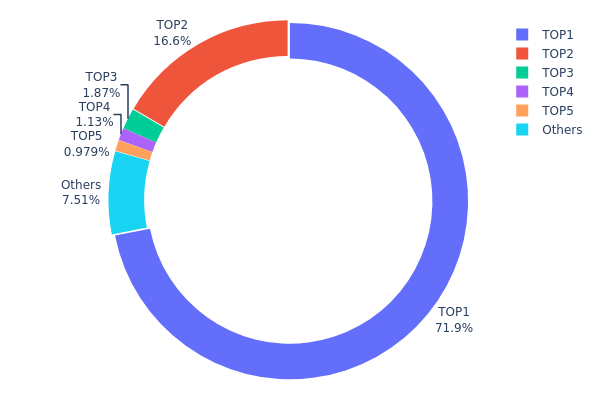
According to the latest on-chain data, RDNT's address holding distribution exhibits significant concentration characteristics. The top two addresses collectively hold 114,337.12K tokens, accounting for 88.50% of the total supply, with the largest address alone controlling 71.90% (92,883.10K tokens) and the second-largest holding 16.60% (21,454.02K tokens). The remaining top three through five addresses hold between 0.97% and 1.86% each, while all other addresses combined represent merely 7.54% of the total distribution.
This highly concentrated holding structure indicates that RDNT's token distribution is predominantly controlled by a small number of major holders, which may include project team wallets, treasury addresses, or institutional investors. Such concentration levels suggest limited decentralization in the token's distribution and could potentially expose the market to heightened volatility risks. The substantial holdings concentrated in the top addresses mean that any significant selling pressure from these entities could trigger sharp price fluctuations. Additionally, this distribution pattern may raise concerns regarding potential market manipulation, as major holders possess sufficient token quantities to significantly influence market pricing dynamics.
From a market structure perspective, while this concentration may reflect strategic token allocation for project development or ecosystem incentives, it also indicates that RDNT's on-chain governance and trading activities remain heavily dependent on decisions made by a limited number of key addresses. Investors should closely monitor any transfer activities from these major holding addresses, as such movements could serve as important signals for market sentiment shifts.
View current RDNT Holdings Distribution
| Top |
Address |
Holding Qty |
Holding (%) |
| 1 |
0xf977...41acec |
92883.10K |
71.90% |
| 2 |
0xba12...6bf2c8 |
21454.02K |
16.60% |
| 3 |
0x14b0...f30919 |
2414.51K |
1.86% |
| 4 |
0x28e3...4e3797 |
1460.93K |
1.13% |
| 5 |
0x0529...c553b7 |
1264.15K |
0.97% |
| - |
Others |
9706.22K |
7.54% |
II. Core Factors Affecting RDNT's Future Price
Due to the absence of relevant data in the provided materials and limitations in the knowledge base, this section cannot be completed at this time.
III. 2026-2031 RDNT Price Forecast
2026 Outlook
- Conservative Forecast: $0.00739 - $0.00821
- Neutral Forecast: Around $0.00821
- Optimistic Forecast: Up to $0.011 (contingent on favorable market conditions and increased adoption)
2027-2029 Mid-term Outlook
- Market Phase Expectations: The token may experience gradual accumulation and development phase, with potential for moderate growth as the ecosystem matures
- Price Range Projections:
- 2027: $0.00845 - $0.01412, with an estimated 17% increase
- 2028: $0.00842 - $0.01269, potentially showing 45% growth
- 2029: $0.01031 - $0.01387, with possible 50% appreciation
- Key Catalysts: Protocol development milestones, expanding DeFi integrations, and broader market recovery cycles
2030-2031 Long-term Outlook
- Baseline Scenario: $0.00967 - $0.01307 (assuming steady protocol growth and stable market conditions)
- Optimistic Scenario: $0.01516 - $0.01726 (with accelerated adoption and favorable regulatory environment)
- Transformative Scenario: Approaching $0.01956 (under exceptional circumstances including significant protocol upgrades and mass market adoption)
- January 26, 2026: RDNT trading within initial consolidation range as the market establishes support levels
| Year |
Predicted High Price |
Predicted Average Price |
Predicted Low Price |
Price Change |
| 2026 |
0.011 |
0.00821 |
0.00739 |
0 |
| 2027 |
0.01412 |
0.0096 |
0.00845 |
17 |
| 2028 |
0.01269 |
0.01186 |
0.00842 |
45 |
| 2029 |
0.01387 |
0.01228 |
0.01031 |
50 |
| 2030 |
0.01726 |
0.01307 |
0.00967 |
59 |
| 2031 |
0.01956 |
0.01516 |
0.0094 |
85 |
IV. RDNT Professional Investment Strategy and Risk Management
RDNT Investment Methodology
(1) Long-Term Holding Strategy
- Suitable for: Investors seeking exposure to cross-chain DeFi infrastructure with medium to high risk tolerance
- Operational Recommendations:
- Consider accumulating positions during market corrections when RDNT trades below key support levels
- Monitor the project's total value locked (TVL) and lending protocol adoption as fundamental indicators
- Store assets securely using Gate Web3 Wallet or other reputable multi-chain compatible wallets
(2) Active Trading Strategy
- Technical Analysis Tools:
- Support/Resistance Levels: Track the historical price range between $0.0082 (recent low) and previous resistance zones for potential entry/exit points
- Volume Analysis: Monitor 24-hour trading volume patterns to identify potential trend reversals or continuations
- Swing Trading Key Points:
- Set stop-loss orders 5-8% below entry points to limit downside risk
- Consider taking partial profits during short-term rallies of 15-20% to manage position risk
RDNT Risk Management Framework
(1) Asset Allocation Principles
- Conservative Investors: 1-2% of crypto portfolio
- Aggressive Investors: 3-5% of crypto portfolio
- Professional Investors: Up to 7-10% with active hedging strategies
(2) Risk Hedging Solutions
- Diversification Strategy: Combine RDNT holdings with stablecoins and major cryptocurrencies to reduce portfolio volatility
- Position Sizing: Use dollar-cost averaging to build positions gradually rather than investing lump sums
(3) Secure Storage Solutions
- Multi-Chain Wallet Recommendation: Gate Web3 Wallet supports RDNT across Arbitrum, BSC, and Ethereum networks
- Hardware Wallet Solution: For larger holdings, consider using hardware wallets compatible with EVM chains
- Security Precautions: Never share private keys, enable two-factor authentication, and regularly verify contract addresses before transactions
V. RDNT Potential Risks and Challenges
RDNT Market Risks
- High Volatility: RDNT has experienced significant price fluctuations, including a 1-year decline of approximately 82.86%, indicating substantial market volatility
- Limited Market Capitalization: With a market cap of approximately $10.56 million and 0.0004% market dominance, RDNT has relatively low liquidity compared to major cryptocurrencies
- Trading Volume Concentration: Daily trading volume of around $22,488 suggests limited market depth, which may lead to price slippage during large transactions
RDNT Regulatory Risks
- Cross-Chain Protocol Scrutiny: As a LayerZero-based cross-chain lending protocol, RDNT may face increased regulatory attention regarding cross-border financial activities
- DeFi Lending Compliance: Evolving regulations around decentralized lending platforms could impact RDNT's operational model and adoption
- Token Classification Uncertainty: Regulatory clarity regarding RDNT's classification as a utility token versus a security remains subject to jurisdictional interpretation
RDNT Technical Risks
- Smart Contract Vulnerabilities: As with all DeFi protocols, RDNT's smart contracts on multiple chains (Arbitrum, BSC, Ethereum) carry inherent security risks
- Cross-Chain Bridge Dependencies: The protocol's reliance on LayerZero infrastructure introduces additional technical complexity and potential points of failure
- Network Risk Exposure: Deployment across multiple blockchain networks means RDNT is subject to technical issues or congestion on Arbitrum, BSC, or Ethereum networks
VI. Conclusion and Action Recommendations
RDNT Investment Value Assessment
RDNT represents a specialized investment in cross-chain DeFi lending infrastructure built on LayerZero technology. The project aims to enable omnichain money market functionality, allowing users to deposit assets on one chain and borrow on another. However, the token has faced significant price pressure, with substantial declines across multiple timeframes. The relatively low market capitalization and trading volume suggest this is a high-risk, speculative investment suitable only for those with strong risk tolerance and understanding of DeFi protocols. Long-term value depends on the project's ability to gain traction in the competitive lending protocol landscape and successfully execute its cross-chain vision.
RDNT Investment Recommendations
✅ Beginners: Avoid or limit exposure to less than 1% of total crypto portfolio. Focus on understanding cross-chain DeFi mechanics before investing in specialized protocols like RDNT
✅ Experienced Investors: Consider small speculative positions (2-3% of crypto portfolio) with strict stop-loss measures. Monitor protocol TVL, borrowing activity, and LayerZero ecosystem development
✅ Institutional Investors: Conduct thorough due diligence on smart contract security, team background, and competitive positioning. Consider RDNT only as part of a diversified DeFi protocol exposure strategy with appropriate risk management protocols
RDNT Trading Participation Methods
- Spot Trading: RDNT is available for spot trading on Gate.com and 22 other exchanges, providing multiple entry and exit options
- Liquidity Provision: Users can potentially earn RDNT rewards by providing liquidity to RDNT/WETH pools, though this carries impermanent loss risks
- Protocol Participation: Engage with Radiant's lending and borrowing features directly to earn platform rewards while understanding associated smart contract risks
Cryptocurrency investment carries extremely high risks, and this article does not constitute investment advice. Investors should make prudent decisions based on their own risk tolerance and are advised to consult professional financial advisors. Never invest more than you can afford to lose.
FAQ
What is RDNT token? What are its main uses and value?
RDNT is the governance token of Radiant Capital, a decentralized lending protocol. It enables yield farming, staking rewards, and protocol governance. RDNT holders earn transaction fees and participate in key decisions, driving the platform's value through utility and community control.
RDNT has demonstrated significant volatility over the past year. The token experienced notable fluctuations driven by market dynamics and protocol developments. Price movements reflected broader crypto market sentiment and RDNT's utility within the Radiant Capital ecosystem. Overall, the asset has shown both growth periods and correction phases typical of emerging DeFi tokens.
What is the RDNT price prediction for 2024-2025? What do experts think?
RDNT showed strong momentum through 2024-2025. Experts predict continued growth driven by increasing DeFi adoption and ecosystem expansion. Most analysts expect RDNT to reach $0.50-$0.80 range by 2025, with potential for higher valuations as liquidity mining incentives attract more users. Market sentiment remains positive.
What are the main factors affecting RDNT price?
RDNT price is influenced by market demand, trading volume, ecosystem development, protocol upgrades, macroeconomic conditions, and overall crypto market sentiment. Liquidity, governance decisions, and DeFi adoption also significantly impact its valuation.
What are the advantages and disadvantages of RDNT compared to other DeFi governance tokens?
RDNT advantages: strong liquidity protocol integration, efficient capital efficiency on Arbitrum, competitive governance incentives. Disadvantages: smaller ecosystem compared to major protocols, concentrated TVL, limited cross-chain presence relative to competitors.
What are the risks of investing in RDNT? How should I evaluate this investment opportunity?
Evaluate RDNT by analyzing its liquidity, market volatility, and protocol fundamentals. Consider the project's development progress, community support, and competitive landscape. Monitor trading volume and price trends. Diversify your portfolio and only invest what you can afford to lose.
* The information is not intended to be and does not constitute financial advice or any other recommendation of any sort offered or endorsed by Gate.