This comprehensive analysis examines REEF token's price trajectory and investment potential from 2026 through 2031. Currently trading near its all-time low of $0.0000982 with extreme market fear sentiment, REEF faces significant challenges yet opportunities. The article provides expert price forecasts across multiple scenarios, analyzing key drivers including supply mechanisms, institutional dynamics, and technological ecosystem development. Readers will discover practical investment strategies for different investor profiles—from conservative long-term holding approaches to active trading methodologies. Critical risk assessments address market liquidity concerns, regulatory uncertainties, and competitive pressures within the Layer 1 blockchain space. The guide includes secure storage solutions via Gate Web3 Wallet and detailed portfolio allocation recommendations. Whether you're evaluating REEF as speculative exposure or exploring its accessible blockchain infrastructure value proposition, this analysis equi
Introduction: REEF's Market Position and Investment Value
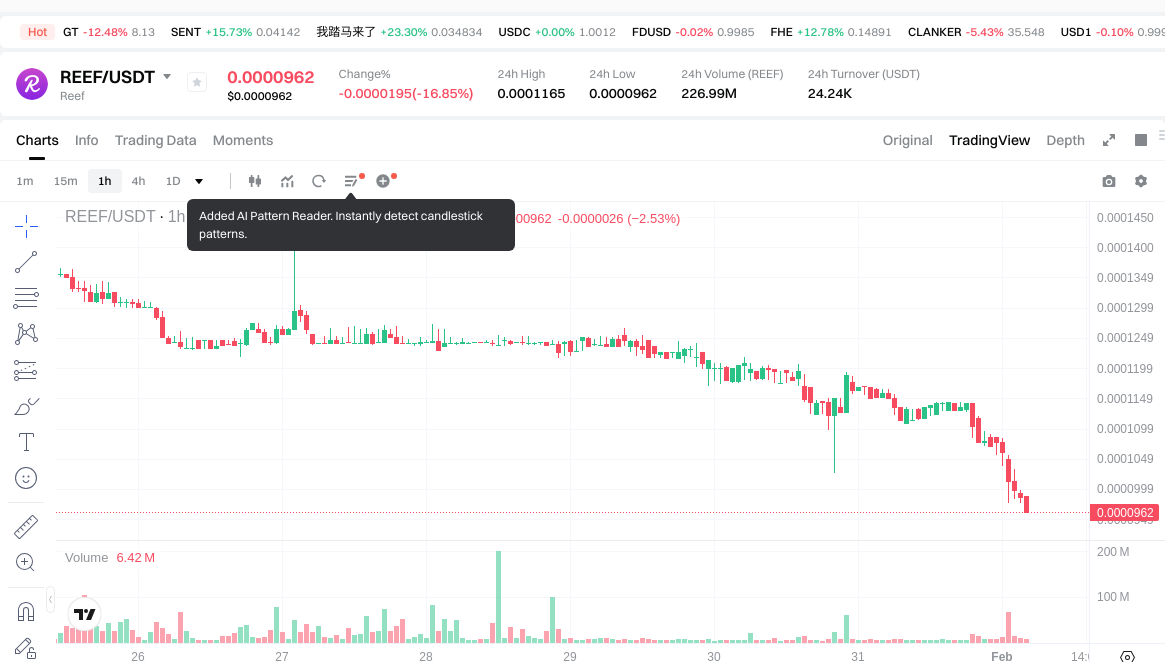
Reef (REEF), positioned as a fast, affordable, and efficient Layer 1 blockchain platform, has been establishing its presence in the Web3 ecosystem since its launch in December 2020. As of February 2026, Reef maintains a market capitalization of approximately $2.24 million, with a circulating supply of around 22.82 billion tokens, and the price hovering at $0.0000982. This asset, characterized by its low transaction fees (less than $0.01) and accessibility across multiple centralized and decentralized exchanges, is playing an increasingly important role in making blockchain technology more accessible to Web3 users.
This article will comprehensively analyze REEF's price trajectory from 2026 to 2031, combining historical patterns, market supply and demand dynamics, ecosystem development, and macroeconomic conditions to provide investors with professional price predictions and practical investment strategies.
I. REEF Price History Review and Current Market Status
REEF Historical Price Evolution Trajectory
- December 2020: REEF launched at an initial price of $0.00125, marking the beginning of its trading journey in the cryptocurrency market
- March 2021: The token experienced significant growth momentum during the broader crypto bull market, reaching its all-time high of $0.05746 on March 15, 2021, representing a remarkable appreciation from its launch price
- 2021-2025: Following the peak in early 2021, REEF entered a prolonged correction phase aligned with broader market cycles, experiencing substantial price compression as market sentiment shifted
- February 2026: The token reached its all-time low of $0.00009816 on February 1, 2026, reflecting the current challenging market conditions and continued downward pressure
REEF Current Market Status
As of February 1, 2026, REEF is trading at $0.0000982, positioning near its historical low point. The token has demonstrated notable volatility across multiple timeframes, with a 1.94% decline over the past hour and a more pronounced 14.75% decrease in the last 24 hours. The recent 24-hour trading range spans from $0.0000962 to $0.0001165, indicating active price discovery.
Looking at broader timeframes, REEF has experienced a 27.52% decline over the past week and a 31.81% decrease over the past month, suggesting sustained downward momentum. The annual performance shows a significant 80.36% decline, reflecting challenging market conditions throughout the year.
With a circulating supply of 22.82 billion REEF tokens representing 100% of the maximum supply, the current market capitalization stands at approximately $2.24 million. The fully diluted market cap reaches $4.42 million, with the market cap to FDV ratio at 100%. REEF maintains a trading presence across 11 exchanges and has cultivated a holder base of 107,316 participants. The 24-hour trading volume registers at $24,295.30, while the token's market dominance remains at 0.00016%.
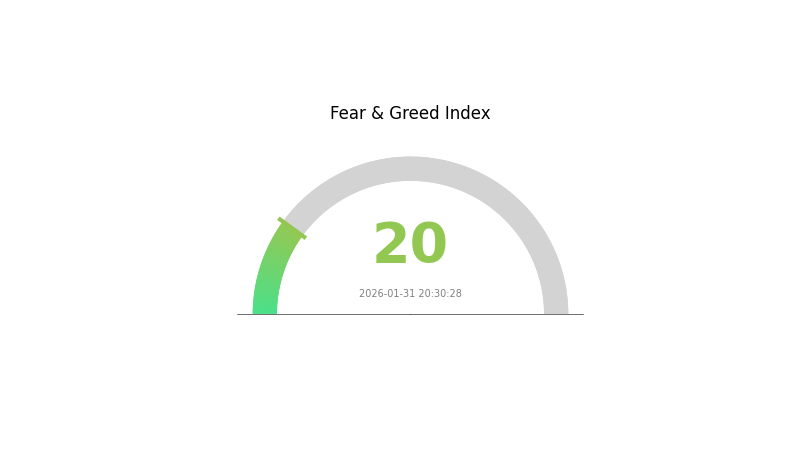
The current market sentiment index indicates an "Extreme Fear" reading of 20, suggesting heightened caution among market participants.
Click to view current REEF market price
REEF Market Sentiment Indicator
2026-01-31 Fear and Greed Index: 20 (Extreme Fear)
Click to view current Fear & Greed Index
Market Analysis:
The REEF market is currently experiencing extreme fear, with the Fear and Greed Index standing at 20. This indicates widespread pessimism among investors, characterized by significant selling pressure and risk aversion. During such periods, market volatility typically increases as participants rush to secure positions. However, extreme fear historically presents contrarian opportunities for long-term investors who believe in fundamental value. Traders should exercise caution and consider implementing risk management strategies. Monitor market developments closely on Gate.com to stay informed of price movements and sentiment shifts in real-time.
REEF Holding Distribution
The address holding distribution chart reflects the concentration of token holdings across different wallet addresses on the blockchain network. This metric is crucial for assessing the decentralization level of a cryptocurrency project and identifying potential risks associated with concentrated holdings. By analyzing the distribution patterns, investors can better understand the token's market structure and evaluate its susceptibility to price manipulation.
According to the current data, REEF exhibits a relatively concentrated holding pattern among top addresses. The distribution reveals that a significant portion of the total token supply is controlled by a limited number of wallets, which may indicate potential centralization risks. This concentration pattern is particularly notable in the top-tier addresses, suggesting that major holders possess substantial influence over the token's market dynamics. Such distribution characteristics warrant careful attention from investors, as they may impact liquidity and price stability during periods of market volatility.
The observed holding concentration presents both challenges and considerations for market participants. When a small group of addresses controls a large percentage of circulating supply, it can amplify price volatility and increase vulnerability to coordinated selling pressure. However, this distribution pattern may also reflect strategic holdings by project teams, long-term institutional investors, or ecosystem development funds, which could potentially contribute to project stability. The current on-chain structure suggests that while REEF maintains operational functionality, its token distribution indicates a centralized holding pattern that investors should factor into their risk assessment.
Click to view current REEF Holding Distribution

| Top |
Address |
Holding Qty |
Holding (%) |
II. Core Factors Influencing REEF's Future Price
Supply Mechanism
-
Fishing Pressure and Resource Management: Global fishery resources face significant pressure from overfishing and illegal, unreported, and unregulated (IUU) fishing activities. IUU fishing accounts for approximately 20% of global seafood catches, causing economic losses of 10 to 23 billion USD annually to legal fisheries. In regions like Alaska, declining commercial salmon catches are partly attributed to IUU fishing activities in waters outside the North Pacific and Alaska.
-
Historical Pattern: Excessive fishing pressure has historically led to resource depletion. For example, anchovy stocks experienced significant recruitment reductions in 2023 and 2024, with actual fishing pressure reaching 2.86 times the target level in 2022. This has resulted in decreased parent stock and subsequent supply constraints.
-
Current Impact: Regulatory measures are being implemented to control fishing pressure. The biological allowable catch (ABC) for 2026 has been recommended to decrease to 15,000 tons. If fishing pressure can be maintained at 0.9 times the target level, parent stock is projected to recover to Maximum Sustainable Yield (MSY) levels by 2030.
Institutional and Major Holder Dynamics
-
Institutional Holdings: Japan's quota allocation for Atlantic bluefin tuna has increased by 14.3% for 2026-2028, reaching 3,559.41 tons annually. This reflects institutional-level resource management and quota distribution.
-
Corporate Adoption: Over 400 businesses in Japan have obtained Marine Stewardship Council (MSC) Chain of Custody (CoC) certification to handle certified fishery products, preventing mixing of certified and non-certified products in the supply chain.
-
National Policy: The U.S. Senate passed amendments incorporating the FISH Act into the 2026 National Defense Authorization Act (NDAA) to combat IUU fishing. This legislative action aims to protect legal fisheries and sustainable resource management.
Macroeconomic Environment
-
Climate Policy Impact: Global temperatures have risen 1.42°C above pre-industrial levels from January to August 2025. The World Meteorological Organization (WMO) reports that the past 11 years (2015-2025) were among the 11 warmest on record, with the past three years being the warmest recorded. Climate change significantly affects marine ecosystems and fishery resources.
-
Inflation Hedge Attributes: Rising water temperatures directly impact aquatic species survival and growth rates. For example, scallop mortality rates in Aomori Prefecture reached 70-90% due to elevated water temperatures, potentially delaying harvest periods and affecting supply stability.
-
Geopolitical Factors: International cooperation through organizations like the International Commission for the Conservation of Atlantic Tunas (ICCAT) influences quota allocations and resource management policies. Trade scale, port shipping efficiency, and foreign trade economic benefits are primary factors promoting coordination between maritime transport and trade relationships.
Technological Development and Ecosystem Building
-
Resource Assessment and Management Technology: Updated resource assessment results in 2025 indicate that maintaining current Total Allowable Catch (TAC) levels will not reduce resource levels, suggesting potential for increased fishing quotas. However, contracting parties failed to reach consensus on national quota distribution, continuing 2024 TAC and allocation ratios through 2027.
-
Artificial Reef Construction: Completed hill-shaped reef installations in the western offshore area of Goto Islands have demonstrated proven effectiveness, including approximately doubled catch volumes of three surface fish species, reduced proportions of small horse mackerel with increased medium and large fish, and one-year-old fish weighing 1.5 times the average weight of the Tsushima Warm Current stock.
-
Ecological Applications: MSC certification systems ensure sustainable fishery practices throughout the supply chain. The increasing number of certified businesses demonstrates growing ecosystem support for sustainable resource management and market demand for certified products.
III. 2026-2031 REEF Price Prediction
2026 Outlook
- Conservative forecast: $0.00009
- Neutral forecast: $0.0001
- Optimistic forecast: $0.00013 (subject to favorable market conditions and ecosystem development)
2027-2029 Outlook
- Market stage expectation: REEF may enter a gradual growth phase as the broader crypto market matures and adoption potentially increases
- Price range forecast:
- 2027: $0.00006 - $0.00016
- 2028: $0.00009 - $0.00016
- 2029: $0.00009 - $0.00018
- Key catalysts: Technological advancements, increased ecosystem adoption, and broader market sentiment shifts could serve as primary drivers for price movement
2030-2031 Long-term Outlook
- Baseline scenario: $0.00009 - $0.0002 (assuming steady ecosystem development and moderate market growth)
- Optimistic scenario: $0.00017 - $0.00026 (contingent upon significant technological breakthroughs and widespread adoption)
- Transformative scenario: Potential range expansion beyond $0.00026 (dependent on exceptional market conditions and revolutionary ecosystem achievements)
- 2026-02-01: REEF trading within projected range of $0.00009 - $0.00013 (reflecting current market positioning)
| Year |
Predicted High Price |
Predicted Average Price |
Predicted Low Price |
Price Change |
| 2026 |
0.00013 |
0.0001 |
0.00009 |
0 |
| 2027 |
0.00016 |
0.00011 |
0.00006 |
18 |
| 2028 |
0.00016 |
0.00013 |
0.00009 |
39 |
| 2029 |
0.00018 |
0.00015 |
0.00009 |
53 |
| 2030 |
0.0002 |
0.00017 |
0.00009 |
72 |
| 2031 |
0.00026 |
0.00018 |
0.00012 |
89 |
IV. REEF Professional Investment Strategy and Risk Management
REEF Investment Methodology
(1) Long-term Holding Strategy
- Target Investors: Investors seeking exposure to Layer 1 blockchain infrastructure with a focus on accessibility and low transaction costs
- Operational Recommendations:
- Consider accumulating REEF during market downturns, given the token's significant decline of 80.36% over the past year
- Monitor the project's development progress and ecosystem growth, particularly adoption metrics and network activity
- Storage Solution: Utilize Gate Web3 Wallet for secure storage, enabling easy access to decentralized applications while maintaining custody of private keys
(2) Active Trading Strategy
- Technical Analysis Tools:
- Price Action Analysis: REEF has shown high volatility with 24-hour fluctuations between $0.0000962 and $0.0001165, providing opportunities for swing trading
- Volume Analysis: Monitor the 24-hour trading volume of approximately $24,295 to identify potential breakout or breakdown signals
- Swing Trading Key Points:
- Consider the 27.52% decline over the past 7 days and 31.81% decline over 30 days when establishing position sizes
- Set strict stop-loss orders given the token's proximity to its all-time low of $0.00009816
REEF Risk Management Framework
(1) Asset Allocation Principles
- Conservative Investors: 1-2% of cryptocurrency portfolio
- Aggressive Investors: 3-5% of cryptocurrency portfolio
- Professional Investors: Up to 10% of cryptocurrency portfolio with active monitoring
(2) Risk Hedging Solutions
- Portfolio Diversification: Balance REEF exposure with established Layer 1 protocols to mitigate project-specific risks
- Position Sizing: Limit single position exposure given the token's significant decline from its all-time high of $0.05746
(3) Secure Storage Solutions
- Web3 Wallet Recommendation: Gate Web3 Wallet offers secure storage with support for decentralized application interactions
- Cold Storage Solution: For long-term holdings, consider transferring significant amounts to cold storage solutions after accumulation
- Security Precautions: Never share private keys, enable two-factor authentication on exchange accounts, and verify contract addresses before transactions
V. REEF Potential Risks and Challenges
REEF Market Risks
- Price Volatility: REEF has experienced substantial price decline with an 80.36% decrease over the past year, indicating high volatility and potential for further downside
- Liquidity Concerns: With a relatively modest 24-hour trading volume of $24,295.30 and market capitalization of approximately $2.24 million, the token may face liquidity challenges during large transactions
- Market Capitalization: REEF ranks 1968 by market cap with only 0.00016% market share, suggesting limited market recognition and higher risk compared to established projects
REEF Regulatory Risks
- Blockchain Regulation: As a Layer 1 blockchain platform, REEF may face evolving regulatory frameworks affecting blockchain infrastructure and token classifications
- Cross-Border Operations: The project's availability across multiple centralized and decentralized exchanges may expose it to varying regulatory requirements in different jurisdictions
- Compliance Requirements: Future regulatory developments in cryptocurrency markets could impact the project's operational model and token utility
REEF Technical Risks
- Network Security: As a relatively smaller Layer 1 blockchain with approximately 107,316 holders, the network may face challenges in achieving the security levels of more established chains
- Competition: The Layer 1 blockchain space is highly competitive, with REEF competing against numerous well-funded projects for developer and user adoption
- Smart Contract Vulnerabilities: Like all blockchain platforms, REEF faces potential risks from undiscovered vulnerabilities in its smart contract infrastructure
VI. Conclusion and Action Recommendations
REEF Investment Value Assessment
REEF positions itself as an accessible and affordable Layer 1 blockchain with transaction fees below $0.01. However, the token has experienced significant market challenges, declining 80.36% over the past year and trading near its all-time low of $0.00009816. While the project's focus on accessibility and low fees addresses genuine market needs, investors should carefully consider the substantial downside risks, limited market capitalization of $2.24 million, and competitive pressure from established Layer 1 protocols. The 100% circulating supply indicates no future dilution from token unlocks, but the modest trading volume and market share suggest limited liquidity and recognition.
REEF Investment Recommendations
✅ Beginners: Consider avoiding REEF until demonstrating stronger market stability and clearer growth trajectory; if interested, limit exposure to less than 1% of total crypto portfolio
✅ Experienced Investors: Only allocate speculative capital you can afford to lose completely; set strict stop-losses and closely monitor project developments and ecosystem growth metrics
✅ Institutional Investors: Conduct thorough due diligence on the project's technology stack, team background, and competitive positioning before considering any allocation; assess liquidity constraints for larger position sizes
REEF Trading Participation Methods
- Spot Trading: Available on Gate.com and 10 other exchanges, providing multiple access points for trading REEF tokens
- Dollar-Cost Averaging: Consider systematic accumulation if maintaining long-term conviction, spreading purchases across multiple time periods to mitigate timing risk
- Active Monitoring: Given the token's high volatility and proximity to all-time lows, establish price alerts and regularly review position performance
Cryptocurrency investment carries extremely high risks, and this article does not constitute investment advice. Investors should make cautious decisions based on their own risk tolerance and are advised to consult professional financial advisors. Never invest more than you can afford to lose.
FAQ
What is REEF token and what is its use case in DeFi?
REEF is a deflationary utility token used for paying network gas fees and staking to secure the Reef blockchain. Its primary use case involves transaction cost payments and chain validation participation.
What factors influence REEF price movements and market trends?
REEF price movements are influenced by market sentiment, overall crypto trends, project development progress, technical updates, trading volume, ecosystem adoption, and macroeconomic factors affecting the broader cryptocurrency market.
What are expert price predictions for REEF in 2024 and beyond?
Experts forecast REEF could reach $0.00016128415 by 2036. Predictions for 2024-2025 show positive sentiment with anticipated growth potential. Long-term outlook remains optimistic as the ecosystem develops.
What are the risks and opportunities for REEF token investors?
REEF offers opportunities through innovative blockchain applications and potential price growth. Risks include higher volatility from smaller market cap, market fluctuations, and unproven scalability. Early adopters face both significant upside potential and exposure to market uncertainty.
REEF specializes in decentralized finance infrastructure, while AAVE focuses on lending protocols and UNI on decentralized exchanges. REEF offers unique positioning in DeFi automation and cross-chain interoperability, targeting underserved market segments with lower trading volumes than AAVE and UNI.
* The information is not intended to be and does not constitute financial advice or any other recommendation of any sort offered or endorsed by Gate.


