This comprehensive RLS price prediction article analyzes Rayls (RLS), a blockchain token bridging Traditional Finance and DeFi, currently trading at $0.007781 with a $11.67 million market cap as of January 2026. The analysis combines historical price trends, market supply-demand dynamics, and macroeconomic factors to provide professional forecasts through 2031, projecting potential price ranges from $0.00722 to $0.02035 depending on market conditions. The article examines RLS's 40.78% monthly decline, concentrated ownership structure with top five holders controlling 40% of supply, and extreme market fear sentiment. It presents three investment strategies—long-term holding, active trading, and technical analysis—alongside comprehensive risk management frameworks suitable for beginners, experienced investors, and institutions. RLS is available for spot trading on Gate and 15 other exchanges, with detailed guidance on position sizing, secure storage solutions via Gate Web3 Wallet, and critical risk assessments
Introduction: RLS Market Position and Investment Value
Rayls (RLS), positioned as a blockchain ecosystem bridging Traditional Finance and DeFi in a compliant and privacy-preserving manner, has established its presence since its public launch in 2025. As of January 2026, RLS maintains a market capitalization of approximately $11.67 million, with a circulating supply of 1.5 billion tokens and a current price around $0.007781. This asset, designed to facilitate institutional-grade liquidity and regulatory compliance, is playing an increasingly important role in the tokenization of global assets and the convergence of traditional financial systems with decentralized finance.
This article will comprehensively analyze RLS price trends from 2026 to 2031, combining historical patterns, market supply and demand dynamics, ecosystem development, and macroeconomic conditions to provide investors with professional price forecasts and practical investment strategies.
I. RLS Price History Review and Market Status
RLS Historical Price Evolution
- December 2025: RLS reached a peak price of $0.0601 on December 1, 2025, marking a significant milestone in its early trading history
- January 2026: The token experienced considerable downward pressure, dropping to its lowest recorded price of $0.007353 on January 19, 2026, representing a decline from its previous high
RLS Current Market Situation
As of January 25, 2026, RLS is trading at $0.007781, showing mixed short-term performance across different timeframes. Over the past hour, the token decreased by 0.66%, while the 24-hour period reflects a 3.18% decline. The 7-day performance indicates a more substantial correction of 16.39%, and the 30-day trend shows a 40.78% decrease from previous levels.
The 24-hour trading range spans from a low of $0.007774 to a high of $0.008389, with total trading volume reaching $153,248.51. The token maintains a market capitalization of approximately $11.67 million, with 1.5 billion tokens in circulation out of a maximum supply of 10 billion tokens, representing a 15% circulation ratio. The fully diluted market cap stands at $77.81 million.
RLS currently holds the #1126 position in market rankings and accounts for 0.0024% of the overall crypto market. The token is listed on 16 exchanges and has attracted 46,502 holders. Market sentiment indicators suggest a cautious trading environment, with the fear and greed index at 25, reflecting extreme fear conditions in the broader market.
Click to view current RLS market price

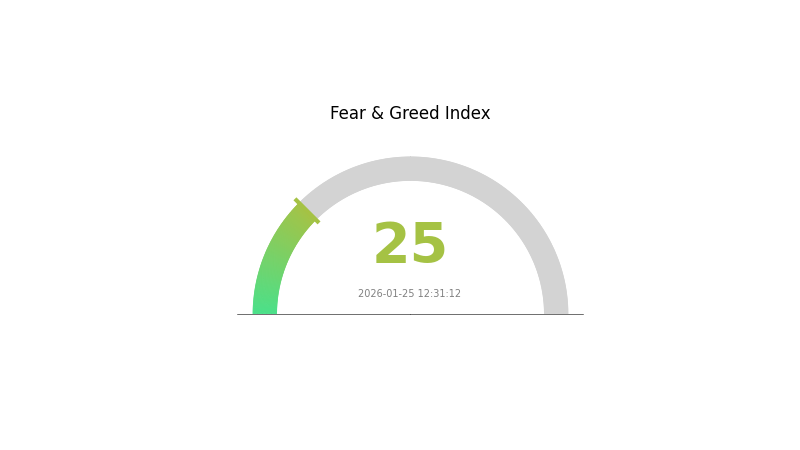
RLS Market Sentiment Index
2026-01-25 Fear and Greed Index: 25 (Extreme Fear)
Click to view the current Fear & Greed Index
Market sentiment has reached extreme fear levels, with the index standing at 25. This indicates heightened anxiety among investors and potential capitulation in the market. During periods of extreme fear, risk assets typically face selling pressure as participants reassess their positions. However, historically, such extreme readings can present contrarian opportunities for long-term investors. Market participants should exercise caution, manage risk appropriately, and avoid emotional decision-making during this volatile period.
RLS Holdings Distribution
The holdings distribution chart illustrates the concentration of token ownership across different wallet addresses, providing insights into the decentralization level and potential market manipulation risks. For RLS, the current data reveals a highly concentrated ownership structure that warrants careful attention from market participants.
According to the latest on-chain data, the top three addresses collectively hold 3,000,000K RLS tokens, representing 30% of the total supply, with each address holding exactly 10% (1,000,000K tokens). When combined with the fourth and fifth largest holders—each controlling 5% (500,000K tokens)—the top five addresses account for 40% of the circulating supply. The remaining 60% is distributed among other addresses, indicating a significant concentration risk in the hands of relatively few major holders.
This concentration pattern suggests that RLS exhibits a relatively centralized ownership structure, which could amplify price volatility and increase susceptibility to market manipulation. Large holders possess substantial influence over trading dynamics, as coordinated selling pressure from these top addresses could trigger significant price corrections. Additionally, such concentration may indicate that a considerable portion of tokens remains with early investors, project teams, or strategic partners who have not yet distributed their holdings broadly to the market. From a market structure perspective, this distribution pattern reflects limited decentralization progress and suggests that RLS's on-chain ecosystem stability remains vulnerable to the actions of major stakeholders.
Click to view current RLS Holdings Distribution

| Top |
Address |
Holding Qty |
Holding (%) |
| 1 |
0xe2ff...292f5a |
1000000.00K |
10.00% |
| 2 |
0x3077...8cfb27 |
1000000.00K |
10.00% |
| 3 |
0x9873...ee5495 |
1000000.00K |
10.00% |
| 4 |
0xd562...ecdd2f |
500000.00K |
5.00% |
| 5 |
0x0142...6b716f |
500000.00K |
5.00% |
| - |
Others |
6000000.00K |
60% |
II. Core Factors Affecting RLS Future Price
Based on the currently available information, there is insufficient data to provide a comprehensive analysis of the core factors affecting RLS's future price. The reference materials do not contain specific information regarding supply mechanisms, institutional dynamics, macroeconomic environment impacts, or technological developments related to RLS.
A thorough price analysis requires detailed information about the token's economic model, market participants, adoption metrics, and technical roadmap, which are not present in the provided materials.
III. 2026-2031 RLS Price Forecast
2026 Outlook
- Conservative prediction: $0.00722
- Neutral prediction: $0.00776
- Optimistic prediction: $0.01125 (contingent on favorable market conditions and increased adoption)
2027-2029 Outlook
- Market stage expectation: The token may enter a gradual growth phase, with potential price appreciation driven by ecosystem development and broader market recovery
- Price range predictions:
- 2027: $0.00922 - $0.01388
- 2028: $0.00865 - $0.01322
- 2029: $0.00934 - $0.01345
- Key catalysts: Market sentiment improvements, potential protocol upgrades, and expanding use cases could serve as primary drivers for price movement during this period
2030-2031 Long-term Outlook
- Baseline scenario: $0.00712 - $0.01632 (assuming moderate market growth and steady adoption rates)
- Optimistic scenario: $0.01215 - $0.02035 (conditional on significant ecosystem expansion and favorable regulatory developments)
- Transformative scenario: Prices exceeding $0.02035 (requiring exceptional market conditions, widespread adoption, and major technological breakthroughs)
- 2026-01-25: RLS trading activity continues with price dynamics influenced by ongoing market conditions and investor sentiment
| Year |
Predicted High Price |
Predicted Average Price |
Predicted Low Price |
Price Change |
| 2026 |
0.01125 |
0.00776 |
0.00722 |
0 |
| 2027 |
0.01388 |
0.00951 |
0.00922 |
21 |
| 2028 |
0.01322 |
0.0117 |
0.00865 |
49 |
| 2029 |
0.01345 |
0.01246 |
0.00934 |
59 |
| 2030 |
0.01632 |
0.01295 |
0.00712 |
65 |
| 2031 |
0.02035 |
0.01464 |
0.01215 |
87 |
IV. RLS Professional Investment Strategies and Risk Management
RLS Investment Methodology
(1) Long-term Holding Strategy
- Suitable for: Institutional investors seeking compliant blockchain infrastructure and retail investors believing in the TradFi-DeFi convergence narrative
- Operational Recommendations:
- Establish positions during market consolidation phases when volatility decreases
- Monitor Rayls ecosystem development milestones, particularly institutional adoption metrics and private chain deployment announcements
- Storage Solution: Utilize Gate Web3 Wallet for secure custody with multi-signature support, ensuring private key management best practices
(2) Active Trading Strategy
- Technical Analysis Tools:
- Volume-Weighted Average Price (VWAP): Track institutional accumulation patterns during periods when 24-hour trading volume exceeds historical averages
- Relative Strength Index (RSI): Identify oversold conditions below 30 and overbought conditions above 70 for entry and exit timing
- Swing Trading Key Points:
- Given RLS's 40.78% decline over 30 days, consider accumulating during price stabilization near recent lows
- Set stop-loss orders 8-12% below entry points to manage downside risk during volatile market conditions
RLS Risk Management Framework
(1) Asset Allocation Principles
- Conservative Investors: 1-3% of crypto portfolio
- Aggressive Investors: 5-8% of crypto portfolio
- Professional Investors: 10-15% of crypto portfolio with hedging strategies
(2) Risk Hedging Solutions
- Portfolio Diversification: Combine RLS with established Layer-1 tokens and stablecoins to balance growth potential with stability
- Position Sizing: Scale into positions gradually rather than single large purchases, averaging entry prices across multiple timeframes
(3) Secure Storage Solutions
- Hot Wallet Recommendation: Gate Web3 Wallet for active trading and ecosystem interaction with built-in security features
- Cold Storage Solution: Hardware wallet storage for long-term holdings exceeding $10,000 equivalent, maintaining offline private key security
- Security Precautions: Never share private keys or seed phrases, enable two-factor authentication, verify contract addresses (0xb5f7b021a78f470d31d762c1dda05ea549904fbd on Ethereum) before transactions, and regularly update wallet software
V. RLS Potential Risks and Challenges
RLS Market Risks
- Price Volatility: RLS experienced significant drawdowns with a 40.78% decline in 30 days and currently trades near its historical low of $0.007353, indicating sustained bearish pressure
- Limited Trading History: With circulation beginning in December 2025, RLS lacks long-term price discovery data, making historical analysis less reliable
- Low Circulating Supply Ratio: Only 15% of total supply (1.5 billion of 10 billion tokens) currently circulates, creating potential dilution risk as more tokens enter circulation
RLS Regulatory Risks
- Institutional Compliance Framework: While Rayls targets regulated institutions, evolving global cryptocurrency regulations may impact its dual-chain model and institutional adoption timeline
- Cross-Border Operations: The project's aim to connect traditional finance with DeFi may face jurisdiction-specific regulatory challenges as different regions implement varying digital asset frameworks
- Privacy Feature Scrutiny: Quantum-secure privacy protections, while technologically advanced, may attract regulatory attention in jurisdictions with strict anti-money laundering requirements
RLS Technical Risks
- Dual-Chain Complexity: The combination of public EVM Layer-1 and private chains introduces technical coordination challenges that could impact system stability
- Smart Contract Vulnerabilities: As an ERC-20 token on Ethereum, RLS inherits both the security and potential vulnerabilities of the underlying blockchain infrastructure
- Interoperability Dependencies: The project's success relies on seamless integration between traditional financial systems and DeFi protocols, a technically complex undertaking that may face implementation delays
VI. Conclusion and Action Recommendations
RLS Investment Value Assessment
RLS presents a high-risk, high-potential investment opportunity positioned at the intersection of institutional finance and decentralized technology. The project's value proposition centers on bridging traditional financial institutions with DeFi markets through a compliant, privacy-preserving infrastructure. Long-term value depends on successful institutional adoption and the broader trend toward asset tokenization. However, current market conditions show significant headwinds, with the token down 40.78% in 30 days and trading near historical lows. The 15% circulating supply ratio suggests potential future dilution, while the relatively small market capitalization of approximately $11.67 million indicates early-stage project status with corresponding volatility risks.
RLS Investment Recommendations
✅ Beginners: Limit exposure to 1-2% of cryptocurrency portfolio. Focus on understanding the project's dual-chain architecture and institutional value proposition before increasing positions. Consider dollar-cost averaging over 3-6 months to mitigate entry timing risk.
✅ Experienced Investors: Allocate 3-5% of cryptocurrency portfolio with active monitoring of ecosystem development milestones. Utilize technical analysis to identify optimal entry points during price consolidation, and consider swing trading strategies during volatility spikes.
✅ Institutional Investors: Conduct thorough due diligence on Rayls' compliance framework and private chain capabilities. Allocate 5-10% of digital asset portfolios with hedging strategies. Engage directly with the project team to assess institutional adoption roadmap and regulatory positioning.
RLS Trading Participation Methods
- Spot Trading: Purchase RLS directly on Gate.com and other exchanges (currently listed on 16 platforms), suitable for long-term holding strategies and medium-term swing trading
- Portfolio Integration: Include RLS as part of a diversified cryptocurrency portfolio alongside established Layer-1 protocols and stablecoins to balance risk and growth potential
- Ecosystem Participation: Store tokens in Gate Web3 Wallet to prepare for potential future governance rights, staking opportunities, or ecosystem rewards as the Rayls platform develops
Cryptocurrency investment carries extreme risk, and this article does not constitute investment advice. Investors should make cautious decisions based on their own risk tolerance and are advised to consult professional financial advisors. Never invest more than you can afford to lose.
FAQ
What is the historical price trend of RLS?
RLS has demonstrated significant volatility since its launch, with notable fluctuations reflecting market dynamics and adoption phases. Early trading showed price discovery patterns, followed by periods of consolidation and growth. The token has experienced both bull and bear cycles typical of emerging crypto assets, with trading volumes increasing during major market movements and protocol updates.
What are the main factors affecting RLS price?
RLS price is primarily influenced by market demand and trading volume, blockchain network adoption, macroeconomic conditions, regulatory developments, and overall cryptocurrency market sentiment. Token utility and ecosystem growth also play significant roles in price movements.
How to conduct RLS price prediction? What analysis methods are available?
Analyze RLS price through technical analysis(support/resistance levels),fundamental analysis(market capitalization,trading volume),on-chain metrics(holder distribution,transaction activity),and sentiment analysis. Combine multiple methods for comprehensive prediction assessment.
What are the risks and limitations of RLS price prediction?
RLS price predictions face limitations including market volatility, limited historical data, external regulatory changes, and unpredictable macroeconomic factors. Predictions rely on past patterns which may not guarantee future results due to crypto market dynamics.
RLS demonstrates strong competitive positioning with higher trading volume and market stability compared to similar tokens. Its consistent price trajectory and growing adoption reflect solid fundamentals and stronger community support in the web3 ecosystem.
* The information is not intended to be and does not constitute financial advice or any other recommendation of any sort offered or endorsed by Gate.