ResearchCoin (RSC), a decentralized science incentive token launched in 2022, currently trades at $0.1235 with a $16.57 million market cap. This comprehensive analysis examines RSC's price trajectory from 2026-2031, combining historical patterns, market dynamics, and ecosystem developments. The article projects conservative to optimistic forecasts ranging from $0.079 to $0.255 by 2031, supported by technological upgrades and institutional adoption. It provides professional investment strategies including long-term holding and active trading approaches, alongside robust risk management frameworks for different investor profiles. Additionally, the guide addresses critical considerations such as market volatility, liquidity constraints, regulatory uncertainties, and technical vulnerabilities. Designed for beginners through institutional investors, this analysis equips stakeholders with data-driven insights for making informed RSC investment decisions on Gate exchange platforms.
Introduction: RSC's Market Position and Investment Value
ResearchCoin (RSC), positioned as an innovative incentive token for decentralized scientific collaboration, has been fostering open research and academic transparency since its launch in 2022. As of January 24, 2026, RSC holds a market capitalization of approximately $16.57 million, with a circulating supply of around 134.16 million tokens and a current price hovering near $0.1235. This asset, often described as a "bridge between blockchain and academic research", is playing an increasingly vital role in democratizing scientific knowledge sharing and rewarding scholarly contributions across disciplines.
This article will comprehensively analyze RSC's price trajectory from 2026 to 2031, combining historical patterns, market supply-demand dynamics, ecosystem development, and macroeconomic environment factors to provide investors with professional price forecasts and practical investment strategies.
I. RSC Price History Review and Market Status
RSC Historical Price Evolution Trajectory
- 2022: ResearchCoin was launched in November, marking the beginning of its trading history with an initial focus on incentivizing scientific collaboration through blockchain technology.
- 2025: The token experienced significant volatility throughout the year, reaching a notable price level of $1.6 on January 3, 2025, reflecting increased interest in decentralized academic platforms.
- 2025: Later in the year, market conditions shifted, with RSC experiencing a substantial decline, touching $0.112 on December 31, 2025, representing a major correction from earlier peaks.
RSC Current Market Status
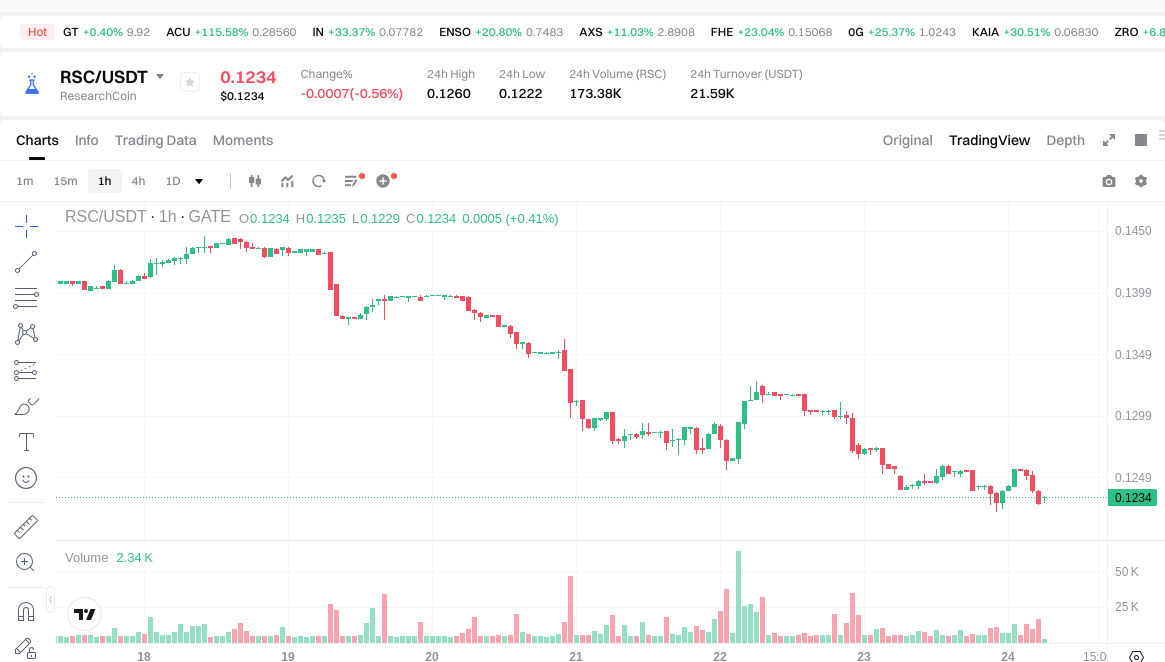
As of January 24, 2026, ResearchCoin (RSC) is trading at $0.1235, showing a modest decline of 0.48% over the past 24 hours. The token has experienced a price range between $0.1222 and $0.126 during this period, indicating relatively stable short-term trading activity.
The broader trend reveals more pronounced movements, with RSC declining 12.049% over the past seven days and 12.73% over the past 30 days. The one-year performance shows a significant decrease of 85.7%, reflecting the challenging market conditions and broader adjustments in the cryptocurrency sector.
RSC currently holds a market capitalization of approximately $16.57 million, ranking #953 among cryptocurrencies. The circulating supply stands at 134,157,343.59 tokens, representing 13.42% of the maximum supply of 1 billion tokens. The fully diluted market capitalization is calculated at $123.5 million, suggesting substantial token allocation remains to be released into circulation.
The 24-hour trading volume registers at $21,624.41, indicating moderate trading activity for the token. With 75,259 holders, ResearchCoin maintains a community of users engaged with the ResearchHub platform. The token operates on the BASE blockchain, with its smart contract address verified on BaseScan.
Current market sentiment indicators show extreme fear conditions, with a volatility index of 24, reflecting broader uncertainty in the cryptocurrency markets. RSC maintains a market dominance of 0.0039%, positioning it as a specialized token within the decentralized science (DeSci) sector rather than a major market player.
Click to view current RSC market price
RSC Market Sentiment Index
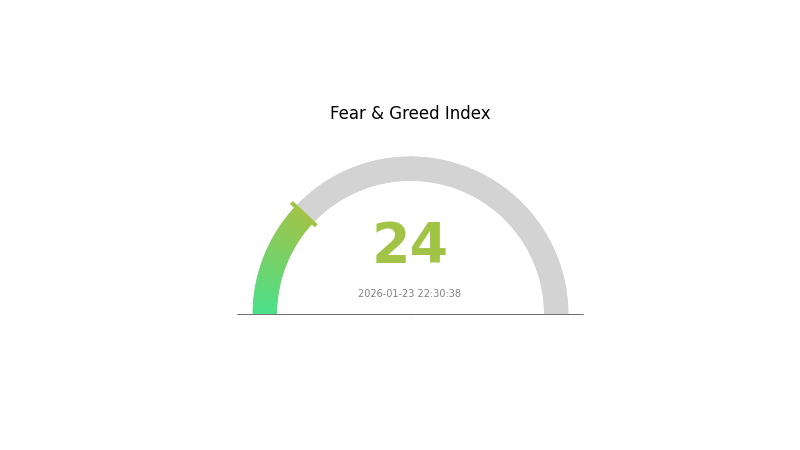
2026-01-23 Fear and Greed Index: 24 (Extreme Fear)
Click to view current Fear & Greed Index
The cryptocurrency market is currently gripped by extreme fear, with the Fear and Greed Index plummeting to 24. This exceptionally low reading signals significant market pessimism and risk aversion among investors. When fear reaches such extreme levels, it often presents contrarian opportunities for long-term investors, as panic selling may have pushed prices below intrinsic value. However, traders should exercise caution and conduct thorough due diligence before entering positions. Monitor market developments closely, as extreme fear can persist or intensify depending on broader economic conditions and regulatory announcements.
RSC Token Holding Distribution
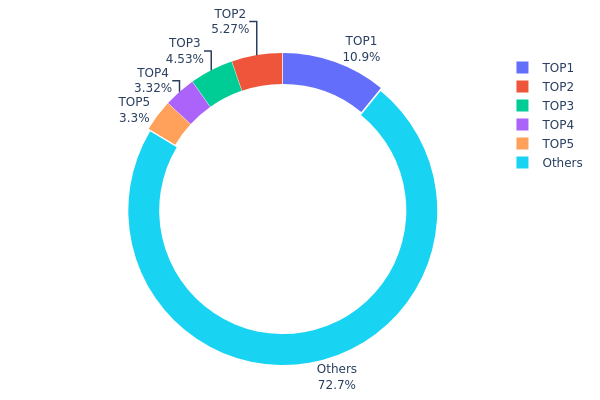
The token holding distribution chart reveals the concentration of RSC tokens across different wallet addresses, serving as a critical indicator of decentralization and market structure health. By analyzing the proportion of tokens held by top addresses versus the broader community, we can assess potential risks related to market manipulation, selling pressure, and the overall stability of the token's ecosystem.
According to the current on-chain data, the top 5 addresses collectively hold approximately 27.33% of the total RSC supply, while the remaining 72.67% is distributed among other addresses. The largest holder controls 10.92% (6.13 million tokens), followed by the second-largest at 5.27% (2.96 million tokens). This distribution pattern indicates a moderate level of concentration, where no single entity possesses overwhelming control, yet the top addresses still maintain significant influence.
From a market structure perspective, this holding distribution demonstrates a relatively balanced ecosystem. The concentration level falls within a reasonable range - neither excessively centralized to pose immediate manipulation risks, nor so dispersed as to lack institutional support. The 72.67% held by smaller addresses suggests healthy retail participation and community engagement. However, investors should remain aware that any coordinated actions by the top 5 holders could still generate noticeable market volatility. This distribution pattern reflects a maturing token economy with improving decentralization characteristics, though continued monitoring of large address movements remains prudent for risk management purposes.
Click to view the current RSC Token Holding Distribution
| Top |
Address |
Holding Qty |
Holding (%) |
| 1 |
0xe92e...c5a03f |
6129.65K |
10.92% |
| 2 |
0x0d07...b492fe |
2960.65K |
5.27% |
| 3 |
0x9e77...0c404d |
2543.65K |
4.53% |
| 4 |
0x7851...4d986d |
1865.26K |
3.32% |
| 5 |
0x1985...b25c87 |
1851.76K |
3.29% |
| - |
Others |
40780.88K |
72.67% |
II. Core Factors Influencing RSC's Future Price
Based on the available information, there is insufficient data to analyze the core factors that may influence RSC's future price. Key areas such as supply mechanisms, institutional dynamics, macroeconomic environment, and technical development require specific data points that are not currently available in the provided materials.
For a comprehensive price analysis, information regarding tokenomics, institutional adoption, regulatory developments, and technological roadmap would be essential. Investors should conduct thorough research and monitor official announcements from the project team for updates on these critical factors.
III. 2026-2031 RSC Price Forecast
2026 Outlook
- Conservative Forecast: $0.07898 - $0.1234
- Neutral Forecast: Around $0.1234
- Optimistic Forecast: Up to $0.13821 (contingent on favorable market conditions and enhanced adoption)
2027-2029 Outlook
- Market Phase Expectations: The cryptocurrency market may enter a consolidation and gradual recovery phase during this period, with RSC potentially benefiting from increased ecosystem development and broader Web3 integration.
- Price Range Forecasts:
- 2027: $0.1138 - $0.16351 (approximately 5% growth compared to 2026)
- 2028: $0.08682 - $0.16481 (approximately 19% cumulative growth)
- 2029: $0.10919 - $0.21526 (approximately 26% cumulative growth)
- Key Catalysts: Technological upgrades within the RSC ecosystem, strategic partnerships, and potential expansion into new market segments could serve as primary drivers for price appreciation.
2030-2031 Long-term Outlook
- Baseline Scenario: $0.15407 - $0.22274 by 2030 (assuming steady ecosystem development and moderate market adoption, representing approximately 50% growth)
- Optimistic Scenario: $0.17356 - $0.25523 by 2031 (predicated on accelerated adoption and favorable regulatory environment, representing approximately 65% growth)
- Transformative Scenario: Prices could potentially exceed current projections if RSC achieves breakthrough partnerships or becomes integrated into major Web3 platforms
- January 24, 2026: RSC is positioned at the beginning of its medium-term growth trajectory, with market participants closely monitoring ecosystem developments
| Year |
Predicted High Price |
Predicted Average Price |
Predicted Low Price |
Price Change |
| 2026 |
0.13821 |
0.1234 |
0.07898 |
0 |
| 2027 |
0.16351 |
0.1308 |
0.1138 |
5 |
| 2028 |
0.16481 |
0.14715 |
0.08682 |
19 |
| 2029 |
0.21526 |
0.15598 |
0.10919 |
26 |
| 2030 |
0.22274 |
0.18562 |
0.15407 |
50 |
| 2031 |
0.25523 |
0.20418 |
0.17356 |
65 |
IV. RSC Professional Investment Strategy and Risk Management
RSC Investment Methodology
(1) Long-term Holding Strategy
- Target Audience: Investors focused on supporting decentralized scientific research platforms with a 2-3 year investment horizon
- Operational Recommendations:
- Consider accumulating positions during market downturns, particularly when RSC trades near support levels around $0.12-0.13
- Monitor platform adoption metrics including active researchers, published papers, and community engagement on ResearchHub
- Implement a secure storage solution using Gate Web3 Wallet for convenient access while maintaining security protocols
(2) Active Trading Strategy
- Technical Analysis Tools:
- Volume Analysis: Monitor the current 24-hour trading volume of approximately $21,600 to identify liquidity patterns and potential breakout opportunities
- Support and Resistance Levels: Track key price levels, with recent data showing support around $0.122 and resistance near $0.126
- Swing Trading Considerations:
- Given the -12.049% weekly decline, identify potential reversal patterns before entering positions
- Set stop-loss orders 5-8% below entry points to manage downside risk in volatile market conditions
RSC Risk Management Framework
(1) Asset Allocation Principles
- Conservative Investors: 1-2% of crypto portfolio allocation
- Moderate Investors: 3-5% of crypto portfolio allocation
- Aggressive Investors: 5-10% of crypto portfolio allocation
(2) Risk Hedging Solutions
- Portfolio Diversification: Combine RSC holdings with established cryptocurrencies to balance risk exposure
- Position Sizing: Avoid concentrating more than 10% of total crypto holdings in a single asset like RSC
(3) Secure Storage Solutions
- Hot Wallet Recommendation: Gate Web3 Wallet for active traders requiring frequent access and transaction capability
- Cold Storage Option: Hardware wallet solutions for long-term holders storing significant RSC amounts
- Security Precautions: Enable two-factor authentication, regularly update security settings, and never share private keys or seed phrases
V. RSC Potential Risks and Challenges
RSC Market Risks
- Price Volatility: RSC has experienced an -85.7% decline over the past year, demonstrating significant price volatility that may continue
- Liquidity Concerns: With a 24-hour trading volume of approximately $21,600, limited liquidity may impact execution of larger trades
- Market Capitalization: At approximately $16.57 million market cap, RSC represents a relatively small-cap asset with higher volatility potential
RSC Regulatory Risks
- Academic Platform Regulations: Potential regulatory scrutiny regarding token-based incentive systems in academic research platforms
- Token Classification Uncertainty: Evolving regulatory frameworks may impact how RSC is classified and traded across different jurisdictions
- Compliance Requirements: Future regulatory developments may impose additional compliance obligations on ResearchHub and RSC holders
RSC Technical Risks
- Smart Contract Vulnerabilities: The BASE blockchain contract at 0xfbb75a59193a3525a8825bebe7d4b56899e2f7e1 requires ongoing security audits and monitoring
- Platform Dependency: RSC value is closely tied to ResearchHub platform adoption and continued development
- Competition Risk: Emerging decentralized science platforms may compete for researchers and academic community engagement
VI. Conclusion and Action Recommendations
RSC Investment Value Assessment
RSC represents an innovative approach to incentivizing scientific collaboration through blockchain technology. While the platform addresses genuine needs in academic research dissemination, the token has experienced substantial price decline (-85.7% annually) and maintains relatively low liquidity. Long-term value depends on ResearchHub's ability to expand its user base beyond the current 75,259 holders and demonstrate meaningful academic community adoption. Short-term risks include continued price volatility, limited trading volume, and broader crypto market conditions.
RSC Investment Recommendations
✅ Beginners: Start with minimal allocation (under 2% of crypto portfolio) and focus on understanding the ResearchHub platform's value proposition before increasing exposure
✅ Experienced Investors: Consider RSC as a small-cap speculative position within a diversified DeSci (Decentralized Science) portfolio, limiting exposure to 3-5% while monitoring platform adoption metrics
✅ Institutional Investors: Conduct thorough due diligence on ResearchHub's business model, token economics, and academic partnerships before considering strategic positions
RSC Trading Participation Methods
- Spot Trading: Purchase RSC directly on Gate.com and other supporting exchanges with available trading pairs
- Dollar-Cost Averaging: Implement systematic purchases over time to mitigate timing risk in volatile market conditions
- Platform Participation: Engage with the ResearchHub platform to understand the token's utility within the ecosystem before investing
Cryptocurrency investment carries extremely high risks, and this article does not constitute investment advice. Investors should make prudent decisions based on their own risk tolerance and are advised to consult professional financial advisors. Never invest more than you can afford to lose.
FAQ
What is RSC's historical price trend and what is the current price level?
RSC has demonstrated strong growth trajectory since launch. Historically, RSC experienced significant appreciation phases with occasional corrections. Currently in January 2026, RSC is trading at robust levels, reflecting increased market adoption and positive fundamentals. The token has established itself as a key player in the Web3 ecosystem with sustained trading volume.
What factors affect RSC price movement?
RSC price is influenced by market demand and trading volume, project development progress, overall crypto market sentiment, regulatory changes, and community adoption rates. These factors collectively determine price fluctuations in the market.
How to conduct technical and fundamental analysis on RSC to predict prices?
Analyze RSC's chart patterns, support/resistance levels, and moving averages for technical signals. For fundamentals, evaluate project development, adoption metrics, transaction volume, and ecosystem growth. Monitor on-chain metrics and community sentiment to identify price trends and potential movements.
What are the risks and uncertainties in RSC price prediction?
RSC price prediction faces market volatility, regulatory changes, and sentiment shifts. Trading volume fluctuations, macroeconomic factors, and technology developments impact accuracy. Predictive models cannot guarantee outcomes due to unpredictable market dynamics and external events affecting crypto asset valuations.
Compared to similar projects, what is RSC's price potential?
RSC demonstrates strong price potential through its innovative tokenomics, growing transaction volume, and expanding ecosystem adoption. With limited supply and increasing utility, RSC is positioned to outperform comparable projects in the long term.
What are professional analysts' predictions for RSC's future price?
Professional analysts project RSC could reach $0.50-$1.20 by end of 2026, driven by increasing adoption, ecosystem development, and strengthening market fundamentals. Long-term growth potential remains strong as the project expands its utility and community engagement.
* The information is not intended to be and does not constitute financial advice or any other recommendation of any sort offered or endorsed by Gate.