This comprehensive SAROS price prediction guide analyzes the Solana-based Web3 application platform's trajectory from 2026 to 2031. Currently trading at $0.001852 with a $4.86 million market cap, SAROS integrates DEX, identity, DePIN, and payment functionalities. The article examines historical price evolution, market sentiment (currently at fear level 26), and token holdings distribution showing moderate whale concentration. Expert forecasts project conservative to optimistic scenarios, ranging from $0.00104 to $0.00298 by 2031, driven by ecosystem adoption, technology development, and macroeconomic factors. Investors receive detailed strategies including long-term holding and active trading approaches with risk management frameworks. The analysis addresses critical risks including high volatility (-78.42% annual decline), limited market cap, and regulatory uncertainties. Professional recommendations guide different investor profiles from beginners to institutions. Available on Gate and 17 other exchanges, S
Introduction: SAROS Market Position and Investment Value
Saros (SAROS), as a comprehensive Web3 application platform on the Solana ecosystem, has been strategically evolving since its launch in January 2024. Initially introduced as a decentralized exchange (DEX), it has expanded into an integrated mobile consumer application encompassing ID, DePIN, and payment functionalities. As of January 2026, SAROS has a market capitalization of approximately $4.86 million, with a circulating supply of around 2.62 billion tokens, and its price stabilizes at approximately $0.001852. This asset, characterized as "the ultimate app for Solana Web3 experience," is playing an increasingly vital role in the decentralized finance and Web3 infrastructure space.
This article will comprehensively analyze SAROS's price trends from 2026 to 2031, combining historical patterns, market supply and demand dynamics, ecosystem development, and macroeconomic environment factors to provide investors with professional price forecasts and practical investment strategies.
I. SAROS Price History Review and Current Market Status
SAROS Historical Price Evolution Trajectory
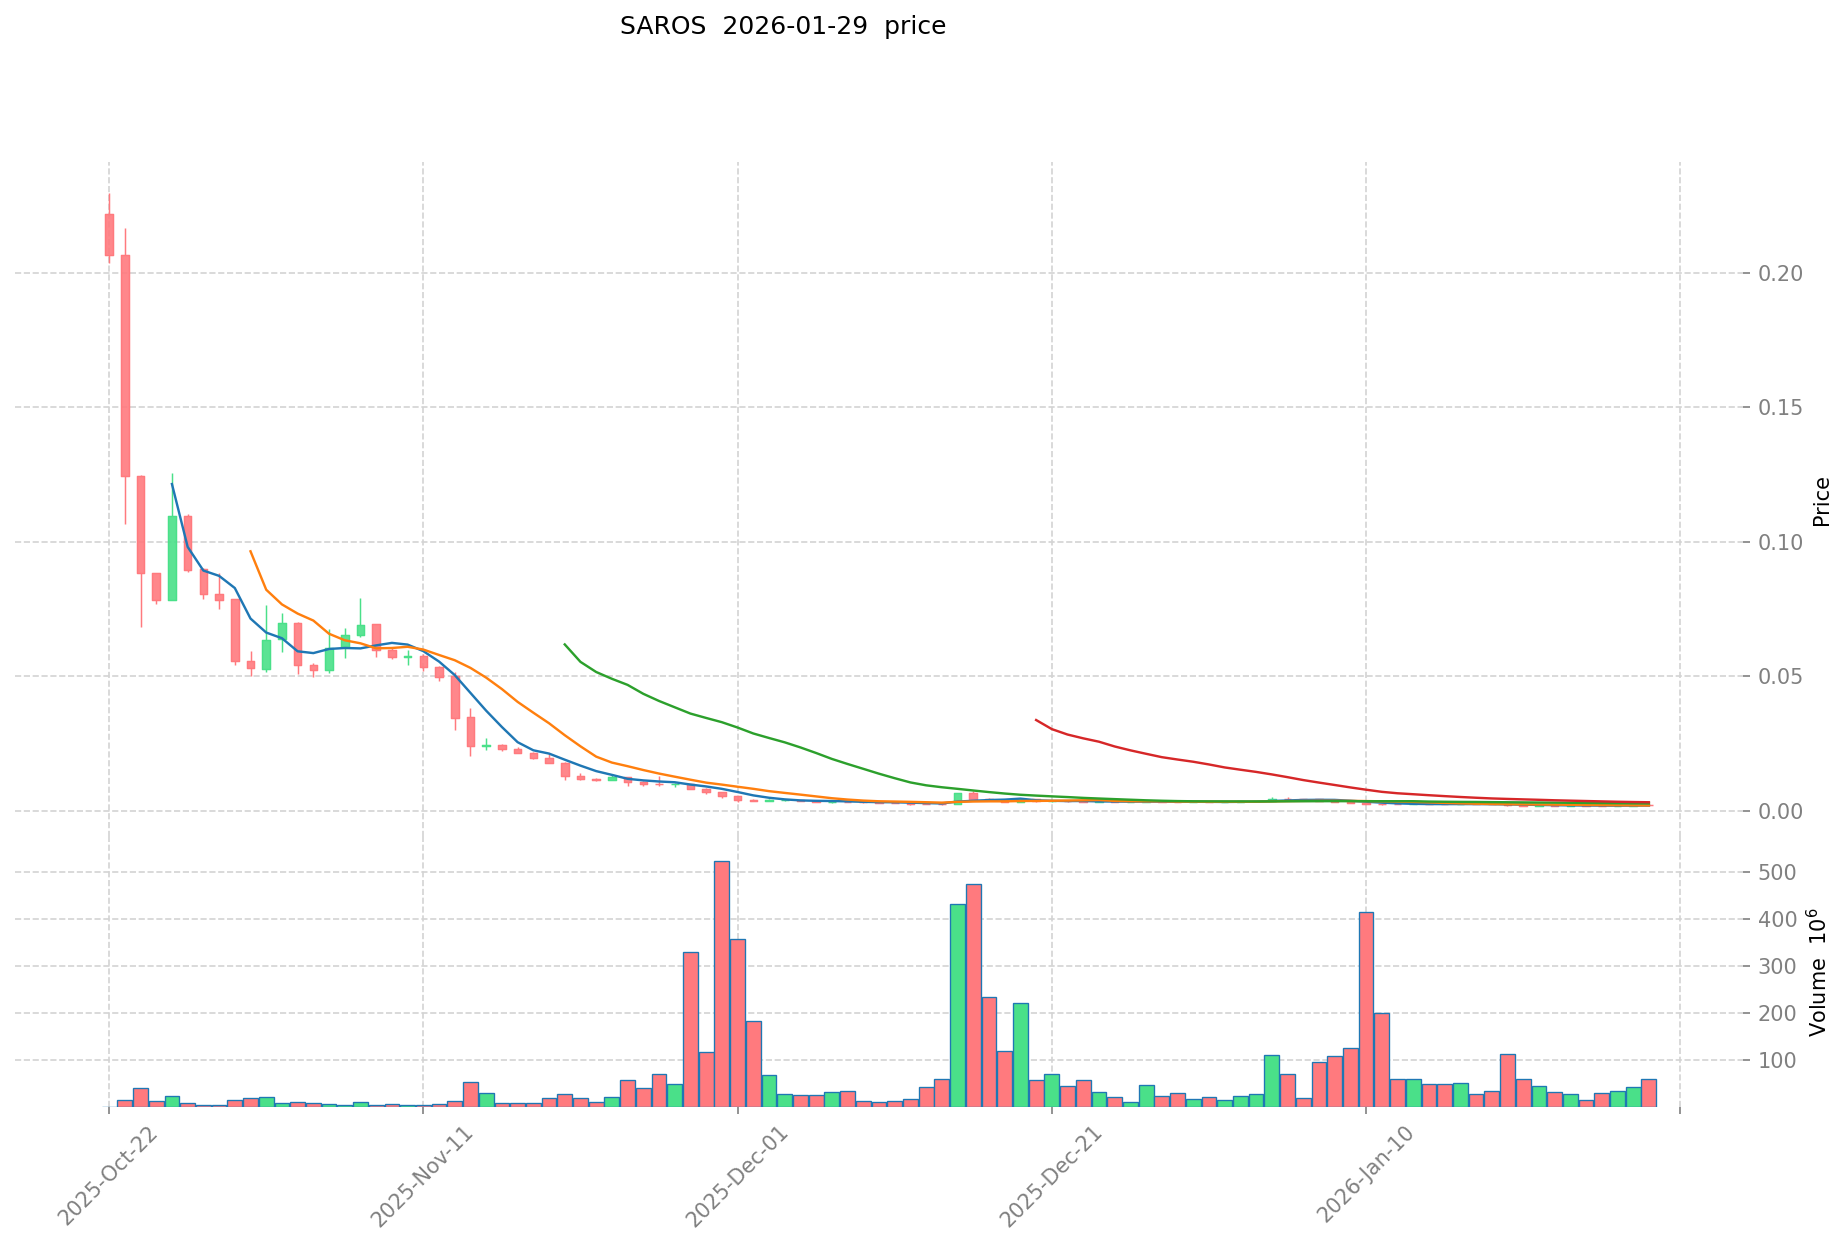
- 2025: The token experienced significant volatility, reaching a peak of $0.429 on September 14, 2025.
- 2024-2025: Following its launch in January 2024 at a price of $0.01, the price underwent substantial fluctuations, with the token reaching its historical low of $0.001029 on August 5, 2024.
- 2025-2026: The price showed a downward trend, declining from the September 2025 peak, with the current price reflecting a year-over-year decrease.
SAROS Current Market Status
As of January 29, 2026, SAROS is trading at $0.001852, showing short-term price pressure with a 1-hour decline of 1.9% and a 24-hour decrease of 16.72%. The 24-hour trading range spans from $0.001845 to $0.002284, with a total trading volume of $93,019.34.
From a longer-term perspective, SAROS has experienced notable price adjustments across multiple timeframes. The 7-day period shows a decline of 5.12%, while the 30-day period reflects a more substantial decrease of 42.27%. The annual performance indicates a decline of 78.42% from the previous year.
The token's market capitalization stands at approximately $4.86 million, with a circulating supply of 2.625 billion tokens, representing 26.25% of the total supply of 10 billion tokens. The fully diluted market cap is calculated at $18.52 million. SAROS maintains a market share of 0.00059% and is currently listed on 18 exchanges, with 11,602 token holders. The current market sentiment index registers at 26, indicating a fear sentiment in the broader market environment.
Click to view the current SAROS market price
SAROS Market Sentiment Index
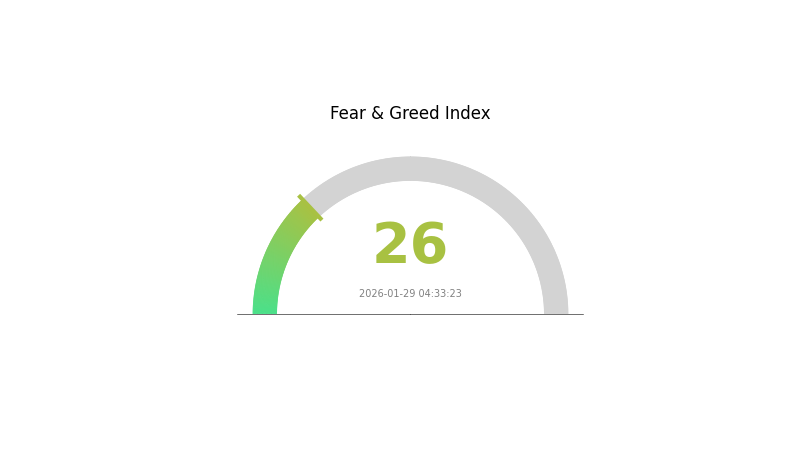
2026-01-29 Fear and Greed Index: 26 (Fear)
Click to view the current Fear & Greed Index
The cryptocurrency market is currently experiencing a fear sentiment with an index reading of 26. This indicates heightened market anxiety and pessimism among investors. During such periods, risk aversion typically increases as market participants become cautious about potential downside risks. Historical data suggests that extreme fear levels often present contrarian opportunities for long-term investors. However, traders should remain vigilant and employ proper risk management strategies. Monitor key support levels and market developments closely to identify potential entry or exit points aligned with your investment strategy and risk tolerance.
SAROS Holdings Distribution
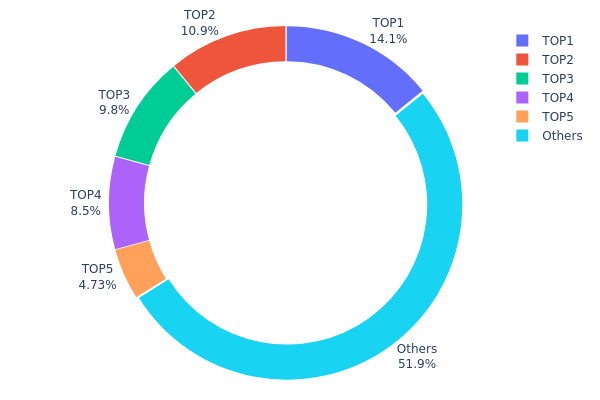
According to the latest on-chain data, SAROS demonstrates a notably concentrated holdings structure. The top five addresses collectively control approximately 48.07% of the total token supply, while the remaining 51.93% is distributed among other addresses. Among these, the largest holder possesses 348,563.42K tokens (14.11%), followed by the second and third largest holders with 10.94% and 9.80% respectively. This distribution pattern indicates that SAROS exhibits moderate to high concentration characteristics at the whale address level.
From a market structure perspective, this concentration level presents a double-edged sword. On one hand, when major holders maintain stable positions, it can reduce circulating supply and provide price support. On the other hand, excessive concentration of holdings creates potential risks of price manipulation and sharp volatility. Should any top-tier addresses execute large-scale sell-offs, it could trigger significant market turbulence. Additionally, approximately 52% of tokens held by "Others" suggests that SAROS maintains a certain degree of decentralization at the retail and mid-tier holder level, which helps absorb some of the selling pressure from whale movements.
Overall, SAROS's current holdings distribution reflects a typical emerging project token structure, where major holders still occupy dominant positions while gradually establishing a broader holder base. This structure demands that investors closely monitor the on-chain behavior of top addresses, as their trading activities could serve as leading indicators of short-term price movements.
Click to view current SAROS Holdings Distribution
| Top |
Address |
Holding Qty |
Holding (%) |
| 1 |
GMHPeJ...k7fPGc |
348563.42K |
14.11% |
| 2 |
9Zifro...bPoL2x |
270392.35K |
10.94% |
| 3 |
8TWNcX...YxCJEA |
242059.86K |
9.80% |
| 4 |
FQEmsV...uW1M9f |
210000.01K |
8.50% |
| 5 |
2Ejnns...z2Ps3e |
116711.15K |
4.72% |
| - |
Others |
1282269.53K |
51.93% |
II. Core Factors Influencing SAROS Future Price
Supply Mechanism
- Transaction Volume and Adoption Rates: High transaction volumes combined with increasing adoption rates serve as fundamental drivers for SAROS price movement. As more users and platforms integrate SAROS into their operations, demand typically increases, creating upward pressure on price.
- Market Demand Dynamics: The cryptocurrency market's overall appetite for DeFi solutions directly impacts SAROS valuation. Growing interest in decentralized finance applications tends to correlate with increased SAROS usage and trading activity.
- Current Influence: Market participants continue monitoring transaction metrics as indicators of organic growth versus speculative trading patterns.
Institutional and Major Holder Dynamics
- Ecosystem Development: SAROS has established itself within various DeFi protocols and platforms, though specific institutional holding data remains limited in available materials.
- Platform Integration: The token has demonstrated presence across multiple blockchain applications, indicating gradual ecosystem expansion.
Macroeconomic Environment
- Regulatory Landscape: Changes in cryptocurrency regulations across different jurisdictions represent significant external factors that could influence SAROS price trajectories. Regulatory clarity or restrictions in major markets typically generate market-wide reactions.
- Market Sentiment: Broader investor sentiment toward cryptocurrencies and DeFi projects affects SAROS positioning. Risk appetite in digital asset markets correlates with price movements across similar tokens.
- Economic Uncertainty: During periods of economic volatility, cryptocurrency assets including SAROS may experience heightened price fluctuations as investors reassess risk allocations.
Technology Development and Ecosystem Building
- Blockchain Innovation Integration: SAROS incorporates frontier blockchain innovations as part of its technical foundation. The platform's ability to adapt and integrate emerging technologies influences long-term competitiveness.
- DeFi Solution Comprehensiveness: As a comprehensive decentralized finance solution, SAROS's technical capabilities in providing various financial services contribute to its utility value and adoption potential.
- Ecosystem Applications: The development and expansion of applications built on or integrated with SAROS infrastructure serve as indicators of platform maturity and user base growth, factors that typically influence token value over time.
III. 2026-2031 SAROS Price Forecast
2026 Outlook
- Conservative estimate: $0.00104 - $0.00186
- Neutral estimate: $0.00186 (average scenario)
- Optimistic estimate: $0.00195 (requires favorable market conditions)
2027-2029 Outlook
- Market phase expectation: The asset may enter a gradual appreciation phase, with potential fluctuations reflecting broader cryptocurrency market dynamics and project development milestones.
- Price range forecast:
- 2027: $0.00179 - $0.00215, representing approximately 2% growth
- 2028: $0.00108 - $0.00211, with an estimated 9% variation
- 2029: $0.00133 - $0.00263, projecting around 11% potential movement
- Key catalysts: Market adoption trends, technological developments within the ecosystem, and overall crypto market sentiment could serve as primary price drivers during this period.
2030-2031 Long-term Outlook
- Baseline scenario: $0.00205 - $0.00235 (assuming steady project progression and maintained market interest)
- Optimistic scenario: $0.00235 - $0.00270 in 2030 (contingent on enhanced adoption and positive market conditions), with potential reach toward $0.00217 - $0.00298 by 2031 (approximately 36% growth trajectory)
- Transformative scenario: Approaching $0.00298 (requires substantial ecosystem expansion, strategic partnerships, and favorable regulatory environment)
Investors should note that cryptocurrency price forecasts remain inherently speculative and subject to significant volatility. The projected ranges reflect potential scenarios based on current market analysis, though actual performance may vary considerably due to unpredictable market forces, technological developments, and macroeconomic factors.
| Year |
Predicted High Price |
Predicted Average Price |
Predicted Low Price |
Price Change |
| 2026 |
0.00195 |
0.00186 |
0.00104 |
0 |
| 2027 |
0.00215 |
0.00191 |
0.00179 |
2 |
| 2028 |
0.00211 |
0.00203 |
0.00108 |
9 |
| 2029 |
0.00263 |
0.00207 |
0.00133 |
11 |
| 2030 |
0.0027 |
0.00235 |
0.00205 |
26 |
| 2031 |
0.00298 |
0.00253 |
0.00217 |
36 |
IV. SAROS Professional Investment Strategy and Risk Management
SAROS Investment Methodology
(1) Long-term Holding Strategy
- Suitable for: Investors who believe in the Solana ecosystem's long-term growth and Saros's comprehensive Web3 application vision
- Operational Recommendations:
- Consider accumulating positions during market corrections when price approaches historical support levels
- Monitor the development progress of Saros's integrated mobile consumer application and its expansion into ID, DePIN, and Payment functionalities
- Storage Solution: Use Gate Web3 Wallet for secure storage with multi-signature protection
(2) Active Trading Strategy
- Technical Analysis Tools:
- Price Action Analysis: Monitor key support at $0.001029 (historical low) and resistance levels near recent highs
- Volume Analysis: Track the 24-hour trading volume trends to identify potential breakout or breakdown scenarios
- Swing Trading Points:
- Consider the high volatility reflected in the -16.72% 24-hour price change when setting stop-loss levels
- Pay attention to the relatively low circulating supply ratio of 26.25% which may impact price volatility
SAROS Risk Management Framework
(1) Asset Allocation Principles
- Conservative Investors: 1-2% of crypto portfolio
- Aggressive Investors: 3-5% of crypto portfolio
- Professional Investors: Up to 10% of crypto portfolio with active management
(2) Risk Hedging Solutions
- Portfolio Diversification: Combine SAROS with other Solana ecosystem tokens to reduce single-asset risk
- Position Sizing: Given the -42.27% monthly decline, implement gradual position building rather than lump-sum investment
(3) Secure Storage Solutions
- Software Wallet Recommendation: Gate Web3 Wallet offers integrated support for Solana-based tokens with user-friendly interface
- Multi-layer Security: Enable two-factor authentication and regularly backup recovery phrases
- Security Precautions: Never share private keys or recovery phrases; be cautious of phishing attempts; verify contract addresses before transactions
V. SAROS Potential Risks and Challenges
SAROS Market Risks
- High Volatility: The token has experienced significant price fluctuations, with a -78.42% decline over one year from its peak
- Limited Market Capitalization: With a market cap of approximately $4.86 million, the token may face liquidity challenges during large trades
- Low Market Share: At 0.00059% market dominance, SAROS remains a relatively small player in the crypto market
SAROS Regulatory Risks
- DeFi Compliance Uncertainty: As DEX and payment functionalities develop, evolving regulatory frameworks may impact operations
- Cross-border Payment Regulations: The planned payment features may face regulatory scrutiny in different jurisdictions
- Token Classification: Regulatory clarity regarding the token's status may affect its trading and utility
SAROS Technical Risks
- Platform Development Risk: The project is still evolving from a DEX into a comprehensive application, with execution risks inherent in such transitions
- Solana Network Dependency: As a Solana-based project, any network issues or congestion on Solana may affect Saros's performance
- Smart Contract Vulnerabilities: Despite being on Solana, smart contract risks cannot be entirely eliminated
VI. Conclusion and Action Recommendations
SAROS Investment Value Assessment
Saros presents an ambitious vision to create a comprehensive Web3 application ecosystem on Solana, integrating DEX, identity, DePIN, and payment functionalities. While the project's strategic evolution demonstrates innovation, investors should carefully consider the significant price decline of -78.42% year-over-year and the token's early-stage development status. The low circulating supply ratio of 26.25% suggests potential future token unlocks that may impact price dynamics. Long-term value depends heavily on successful execution of the roadmap and adoption within the Solana ecosystem.
SAROS Investment Recommendations
✅ Beginners: Start with a minimal allocation (under 1% of portfolio) and focus on understanding the project's development progress before increasing exposure
✅ Experienced Investors: Consider strategic accumulation during market dips while maintaining strict position sizing and stop-loss discipline given the high volatility
✅ Institutional Investors: Conduct thorough due diligence on the development team, roadmap execution, and partnership ecosystem before committing significant capital
SAROS Trading Participation Methods
- Spot Trading: Available on Gate.com and 17 other exchanges, offering direct token ownership
- Dollar-Cost Averaging: Implement systematic purchases to smooth out entry prices during volatile periods
- Active Monitoring: Track project updates via official channels (Twitter: @saros_xyz) and adjust positions based on development milestones
Cryptocurrency investment carries extremely high risks, and this article does not constitute investment advice. Investors should make cautious decisions based on their own risk tolerance and are advised to consult professional financial advisors. Never invest more than you can afford to lose.
FAQ
What is SAROS and what are its main use cases in the cryptocurrency market?
SAROS is a Solana-based super app integrating decentralized trading, payments, NFT management, and digital identity verification. Main use cases include decentralized exchange, secure wallet services, NFT creation, governance participation, and transaction facilitation.
How can I analyze SAROS price trends and what technical indicators are most reliable for price prediction?
Use 200-day and 50-day SMAs for reliable analysis. Monitor trading volume and recent price movements. The 200-day SMA is projected to increase, suggesting positive momentum for SAROS price trends.
What are the key factors that influence SAROS token price movements?
SAROS token price movements are driven by technical factors including oversold bounces and MACD reversals, market sentiment, trading volume, and regulatory developments. Reduced sell pressure from major exchanges also significantly impacts price dynamics.
What are the risks and volatility considerations when predicting SAROS price?
SAROS price prediction faces short-term volatility and regulatory uncertainties. Market sentiment, trading volume fluctuations, and external macroeconomic factors significantly impact price movements. Consider these dynamics when evaluating SAROS price trends.
SAROS stands out as a high-growth Solana-based DEX token with strong institutional backing and robust DeFi utility. It demonstrates superior market performance compared to similar projects, with significant growth potential driven by its innovative features and expanding ecosystem on Solana.
SAROS reached an unprecedented peak of $0.4400 USD on January 26, 2026. Historical analysis reveals strong upward momentum with significant price appreciation. Key patterns include volatility cycles and periodic rallies driven by market sentiment and trading volume fluctuations.
You can access reliable SAROS price prediction tools through PricePredictions.com, which offers advanced technical analysis and accurate forecasts. Their platform provides detailed market analysis and price predictions for 2030 and beyond using comprehensive analytical methods.
* The information is not intended to be and does not constitute financial advice or any other recommendation of any sort offered or endorsed by Gate.