This comprehensive analysis examines SATS, a BRC-20 token trading at $0.00000001597 as of January 2026, providing expert price forecasts and market insights for Bitcoin ecosystem investors. The article reviews SATS market position with a $33.54 million market cap and highly concentrated holdings, establishing a foundation for understanding the token's volatility and liquidity dynamics. Price projections span 2026-2031, anticipating incremental growth phases with estimated price changes ranging from 2% in 2027 to 93% by 2031 under favorable conditions. The analysis addresses investment strategies suitable for different risk profiles, from conservative long-term holding approaches to active trading methodologies on Gate. Risk management frameworks and regulatory considerations are thoroughly examined, emphasizing portfolio allocation principles and secure storage solutions through Web3 wallets. Investors receive actionable recommendations based on experience levels, coupled with candid risk assessments acknowle
Introduction: SATS Market Position and Investment Value
SATS, a BRC-20 token, has emerged as a distinctive digital asset within the Bitcoin ecosystem since its launch in 2023. As of January 2026, SATS maintains a market capitalization of approximately $33.54 million, with a fully circulating supply of 2,100 trillion tokens and a current price hovering around $0.00000001597. This asset, recognized for its role in the Bitcoin Ordinals and BRC-20 token standard movement, is gaining attention among investors exploring Bitcoin-native tokenization opportunities.
This article provides a comprehensive analysis of SATS price trends from 2026 through 2031, incorporating historical patterns, market supply-demand dynamics, ecosystem developments, and macroeconomic conditions to deliver professional price forecasts and practical investment strategies for market participants.
I. SATS Price History Review and Market Status
SATS Historical Price Evolution Trajectory
- 2023: Token launched in June with an initial deployment as a BRC-20 token, price experienced substantial growth during the year, reaching notable levels by December
- 2023: Achieved a significant milestone in December, with price movements reflecting increased market attention to BRC-20 tokens
- 2025: Market cycle adjustment occurred, with price declining from previous levels to establish a lower range during the second half of the year
SATS Current Market Status
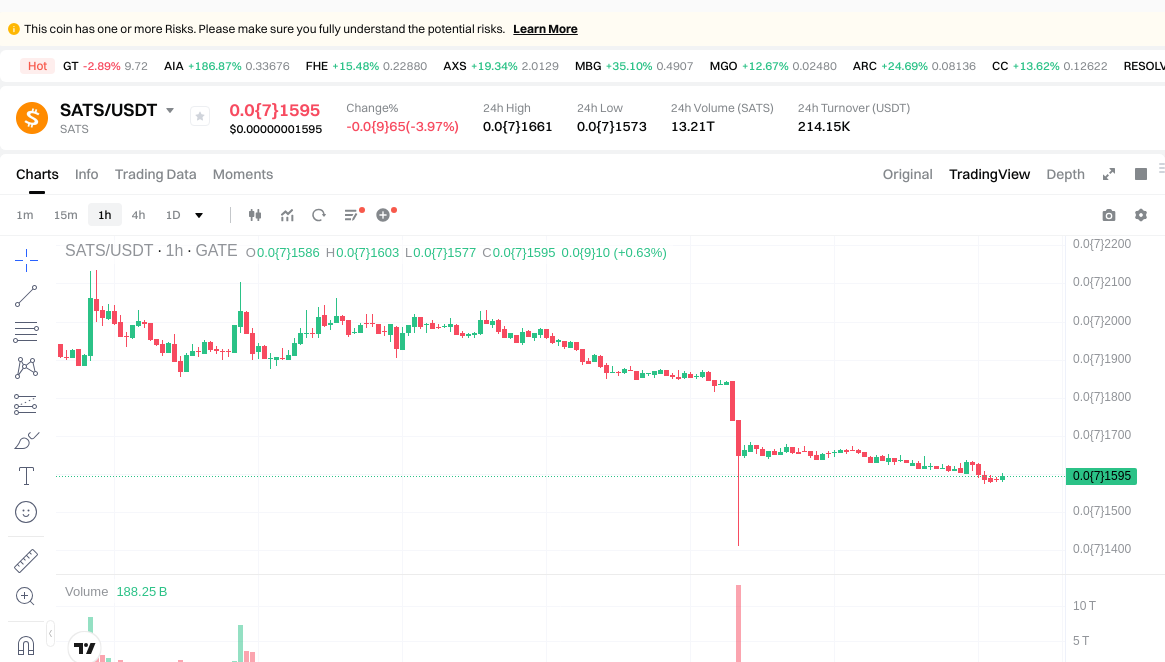
As of January 21, 2026, SATS is trading at $0.00000001597, representing a 24-hour decrease of 4.51%. The token has shown mixed performance across different timeframes, with a 1-hour gain of 0.82% contrasting with a 7-day decline of 20.16%. Over the past 30 days, SATS has demonstrated a recovery with a 5.66% increase.
The token's market capitalization stands at approximately $33.54 million, with a market dominance of 0.0010%. The 24-hour trading volume is recorded at $212,163.93. SATS maintains a fully diluted market cap equal to its current market capitalization, indicating complete circulation of its total supply of 2.1 quadrillion tokens.
The token's 24-hour trading range spans from $0.00000001573 to $0.00000001663. SATS is currently available on 20 exchanges and has attracted approximately 53,800 holders. The cryptocurrency market sentiment indicator shows a fear reading of 32, reflecting cautious market conditions.
Click to view current SATS market price
SATS Market Sentiment Indicator
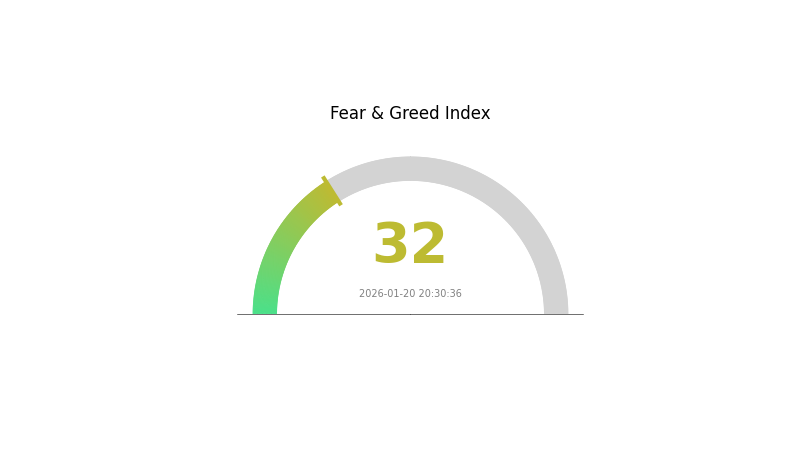
2026-01-20 Fear and Greed Index: 32 (Fear)
Click to view current Fear & Greed Index
The cryptocurrency market is currently experiencing a fear sentiment with an index reading of 32. This indicates heightened market anxiety and increased risk aversion among investors. During periods of fear, market volatility typically increases as participants adopt more conservative positions. Such conditions often present contrarian opportunities for long-term investors, as excessive pessimism can create attractive entry points. However, traders should exercise caution and implement proper risk management strategies. Monitor market developments closely and consider diversifying your portfolio positioning based on your individual risk tolerance and investment horizon.
SATS Holding Distribution
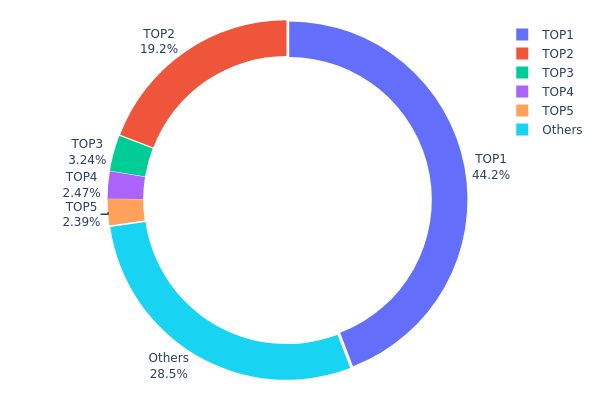
The holding distribution chart reveals the concentration of token holdings across different wallet addresses, providing insights into the decentralization level and potential market manipulation risks. For SATS, the current data demonstrates a notably concentrated ownership structure that warrants careful examination.
According to the latest on-chain data, the top address holds approximately 927.92 trillion SATS tokens, representing 44.18% of the total circulating supply. The second-largest holder controls 19.18% with 402.84 trillion tokens, while the third through fifth addresses collectively account for an additional 8.08% of the supply. Combined, the top five addresses control approximately 71.44% of all SATS tokens, indicating a highly concentrated distribution pattern that deviates significantly from the decentralized ideal typically associated with cryptocurrency projects.
This level of concentration presents several implications for market dynamics. The dominance of a few large holders creates potential vulnerabilities to price manipulation, as coordinated selling from these addresses could trigger significant market volatility. Additionally, this structure limits the token's liquidity depth and may amplify price swings during periods of increased trading activity. From an investment perspective, such concentrated ownership raises concerns about centralization risks and the ability of major holders to influence market sentiment and price discovery mechanisms. The relatively small portion held by other addresses (28.56%) suggests limited retail participation and a market structure that may be susceptible to whale-driven price movements.
Click to view current SATS Holding Distribution
| Top |
Address |
Holding Qty |
Holding (%) |
| 1 |
bc1p8w...a8p0k6 |
927921423976.33K |
44.18% |
| 2 |
bc1qgg...l9t85q |
402841653528.67K |
19.18% |
| 3 |
bc1qn2...fmmrq2 |
68084860391.69K |
3.24% |
| 4 |
bc1qm6...nmyzcx |
51815857716.34K |
2.46% |
| 5 |
bc1qve...r70fu3 |
50154570698.03K |
2.38% |
| - |
Others |
599181633688.94K |
28.56% |
II. Core Factors Affecting SATS Future Price
Based on the available materials, there is insufficient specific information regarding SATS's supply mechanisms, institutional dynamics, macroeconomic positioning, or technical developments to provide a comprehensive analysis at this time.
As market conditions evolve and more data becomes available, these factors will be crucial in assessing SATS's price trajectory. Investors should monitor official announcements and credible sources for updates on supply changes, institutional adoption, macroeconomic trends, and technical upgrades that may influence SATS's valuation.
III. 2026-2031 SATS Price Prediction
2026 Outlook
Based on the current market data and analysis framework, specific price predictions for SATS in 2026 remain challenging to establish with precision. The token is experiencing a foundational development phase where traditional valuation metrics may not fully capture its potential trajectory. Market participants should approach 2026 with careful consideration of the broader cryptocurrency market dynamics and SATS-specific ecosystem developments.
2027-2029 Mid-term Outlook
- Market Stage Expectation: SATS is anticipated to enter a gradual growth phase during this period, with incremental adoption and ecosystem expansion potentially driving value appreciation.
- Price Range Predictions:
- 2027: Early-stage growth potential with a projected price change of approximately 2%
- 2028: Accelerating momentum with an estimated price change around 15%
- 2029: Maturation phase showing potential price change of approximately 35%
- Key Catalysts: The primary drivers during this mid-term horizon may include technological infrastructure improvements, increased market awareness, strategic partnerships within the crypto ecosystem, and broader adoption of Bitcoin-related tokenization standards. Regulatory clarity in major markets could also serve as a significant catalyst for price appreciation.
2030-2031 Long-term Outlook
- Baseline Scenario: SATS could experience substantial price evolution with a projected change of approximately 65% by 2030 (assuming sustained ecosystem growth and favorable market conditions)
- Optimistic Scenario: By 2031, under favorable circumstances including widespread adoption and enhanced utility integration, price change could potentially reach approximately 93% (contingent on successful implementation of key technological upgrades and mainstream market acceptance)
- Transformational Scenario: In an exceptionally favorable environment characterized by breakthrough innovations in Bitcoin Layer-2 solutions, institutional adoption, and regulatory support, SATS could experience exponential growth beyond current projections
Investors should note that these projections are based on current market analysis and carry inherent uncertainties. The cryptocurrency market remains highly volatile, and actual performance may vary significantly from these estimates. Conducting thorough due diligence and consulting with financial advisors is recommended before making investment decisions.
| Year |
Predicted High Price |
Predicted Average Price |
Predicted Low Price |
Price Change |
| 2026 |
0 |
0 |
0 |
0 |
| 2027 |
0 |
0 |
0 |
2 |
| 2028 |
0 |
0 |
0 |
15 |
| 2029 |
0 |
0 |
0 |
35 |
| 2030 |
0 |
0 |
0 |
65 |
| 2031 |
0 |
0 |
0 |
93 |
IV. SATS Professional Investment Strategy and Risk Management
SATS Investment Methodology
(1) Long-term Holding Strategy
- Suitable for: Investors with high risk tolerance who believe in Bitcoin ecosystem development
- Operational Recommendations:
- Consider accumulating positions during market corrections when SATS trades near support levels
- Monitor Bitcoin network developments and BRC-20 token adoption trends
- Storage Solution: Use Gate Web3 Wallet for secure custody, enabling both hot wallet convenience and cold storage security options
(2) Active Trading Strategy
- Technical Analysis Tools:
- Volume Analysis: Monitor the 24-hour trading volume of approximately $212,163 to identify liquidity patterns and potential breakout signals
- Price Range Trading: Utilize the current 24-hour range between $0.00000001573 (low) and $0.00000001663 (high) to identify entry and exit points
- Swing Trading Key Points:
- Pay attention to the -20.16% weekly decline as potential reversal zones
- Set stop-loss orders below recent support levels to manage downside risk
SATS Risk Management Framework
(1) Asset Allocation Principles
- Conservative Investors: 1-2% of crypto portfolio
- Aggressive Investors: 3-5% of crypto portfolio
- Professional Investors: Up to 10% with active hedging strategies
(2) Risk Hedging Solutions
- Diversification Approach: Balance SATS holdings with established cryptocurrencies to reduce concentration risk
- Position Sizing: Implement dollar-cost averaging to mitigate timing risk in volatile markets
(3) Secure Storage Solutions
- Hot Wallet Recommendation: Gate Web3 Wallet for active trading and quick access
- Cold Storage Solution: Transfer long-term holdings to hardware wallets or secure offline storage
- Security Precautions: Enable two-factor authentication, regularly update security settings, and never share private keys or recovery phrases
V. SATS Potential Risks and Challenges
SATS Market Risks
- High Volatility: The token experienced an 85.55% decline over the past year, demonstrating significant price volatility
- Limited Liquidity: With a market cap of approximately $33.54 million and ranking at #665, liquidity may be constrained during large transactions
- Price Decline Momentum: Recent 7-day performance shows a -20.16% decline, indicating downward pressure
SATS Regulatory Risks
- BRC-20 Token Classification: Regulatory uncertainty surrounding BRC-20 tokens and their legal status in various jurisdictions
- Exchange Compliance: Potential delisting risks if regulatory frameworks change regarding Bitcoin-based token standards
- Tax Treatment Ambiguity: Unclear tax implications for BRC-20 token transactions in many regions
SATS Technical Risks
- BRC-20 Standard Limitations: The BRC-20 protocol operates on Bitcoin's base layer, which may face scalability constraints
- Network Congestion: Bitcoin network congestion could impact BRC-20 token transfer efficiency and costs
- Protocol Development Risk: The relatively new BRC-20 standard may face technical challenges or require significant upgrades
VI. Conclusion and Action Recommendations
SATS Investment Value Assessment
SATS represents an experimental token within the Bitcoin ecosystem through the BRC-20 standard. While it demonstrates complete circulation (100% circulating supply of 2.1 quadrillion tokens) and availability on 20 exchanges, the token faces significant challenges. The 85.55% annual decline and recent downward momentum suggest substantial risk. Long-term value depends on broader BRC-20 adoption and Bitcoin ecosystem development, but short-term risks remain elevated due to market volatility and technical uncertainties.
SATS Investment Recommendations
✅ Beginners: Avoid or limit exposure to micro-allocations (less than 1%) only after thorough research and understanding of BRC-20 tokens
✅ Experienced Investors: Consider tactical positions with strict risk management, limiting exposure to 2-3% of crypto portfolio
✅ Institutional Investors: Approach with caution through structured products or hedged strategies, conducting comprehensive due diligence on BRC-20 infrastructure
SATS Trading Participation Methods
- Spot Trading: Purchase SATS directly on Gate.com with flexible order types for price entry management
- Dollar-Cost Averaging: Systematically accumulate positions over time to reduce market timing risk
- Portfolio Integration: Incorporate SATS as a small component within a diversified cryptocurrency portfolio strategy
Cryptocurrency investment carries extremely high risks, and this article does not constitute investment advice. Investors should make prudent decisions based on their own risk tolerance and are advised to consult professional financial advisors. Never invest more than you can afford to lose.
FAQ
Will SATS price rise in the future? How high?
SATS has strong fundamentals driven by Bitcoin ecosystem growth and increasing adoption. Market analysts project SATS could potentially reach $0.001-$0.005 range within 2-3 years, depending on Bitcoin performance and market conditions.
What is the relationship between SATS and Bitcoin? Will its price follow Bitcoin?
SATS is Bitcoin's smallest unit(1 BTC = 100 million SATS). SATS price directly correlates with Bitcoin's value. When Bitcoin rises, SATS rises proportionally; when Bitcoin falls, SATS follows. They move in tandem as SATS represents fractional Bitcoin ownership.
How to predict SATS price trends? What analysis methods are available?
Analyze SATS price through technical analysis(chart patterns,moving averages),on-chain metrics(transaction volume,holder distribution),market sentiment,and Bitcoin correlation. Monitor trading volume,supply dynamics,and historical price cycles for informed predictions.
What are the risks of investing in SATS? Is the price volatility high?
SATS exhibits moderate volatility typical of Bitcoin-based assets. As a scarce digital asset with growing adoption, price fluctuations are expected but manageable. Long-term holders have historically benefited from upside potential as utility and demand increase over time.
What are the application prospects of SATS in the Ordinals ecosystem?
SATS has strong potential in Ordinals ecosystem as the native currency for digital artifact inscription and trading. With growing adoption of Bitcoin NFTs, SATS demand will surge, driving ecosystem expansion and utility growth significantly.
What factors affect SATS price?
SATS price is influenced by Bitcoin market sentiment, trading volume, network adoption, halving events, macroeconomic conditions, and overall cryptocurrency market trends. These factors collectively drive price movements.
* The information is not intended to be and does not constitute financial advice or any other recommendation of any sort offered or endorsed by Gate.