This comprehensive analysis examines SCOR's price trajectory and investment potential through 2031. SCOR, a Web3 infrastructure network tokenizing professional sports IP for NHL, MLS, and other leagues, currently trades at $0.007988 with a $1.65M market cap. The article combines historical price patterns, market supply-demand dynamics, and ecosystem development to forecast SCOR reaching $0.01634 by 2031. Key sections address market positioning, price prediction scenarios across five years, professional investment methodologies, and risk management frameworks. Coverage includes technical analysis, liquidity considerations on Gate and partner exchanges, institutional holder concentration risks, and regulatory challenges in sports IP tokenization. Designed for crypto investors seeking Web3 sports ecosystem exposure, the guide provides actionable strategies for beginners through institutional participants while emphasizing the extreme volatility and early-stage development risks inherent in emerging sports blockc
Introduction: SCOR's Market Position and Investment Value
SCOR, as a Web3 infrastructure network connecting professional sports intellectual property, fans, and developers in a verified on-chain environment, has been actively developing its unique "fan economy" model since its inception. As of February 2026, SCOR maintains a market capitalization of approximately $1.65 million, with a circulating supply of around 206.03 million tokens, and a price hovering near $0.007988. This asset, developed by Sweet—the official Web3 partner of NHL and MLS—is playing an increasingly critical role in tokenizing sports IP and enabling transparent value sharing through smart contracts across multiple professional sports leagues and thousands of athletes.
This article will comprehensively analyze SCOR's price trends from 2026 to 2031, combining historical patterns, market supply and demand dynamics, ecosystem development, and macroeconomic conditions to provide investors with professional price forecasts and practical investment strategies.
I. SCOR Price History Review and Market Status
SCOR Historical Price Evolution Trajectory
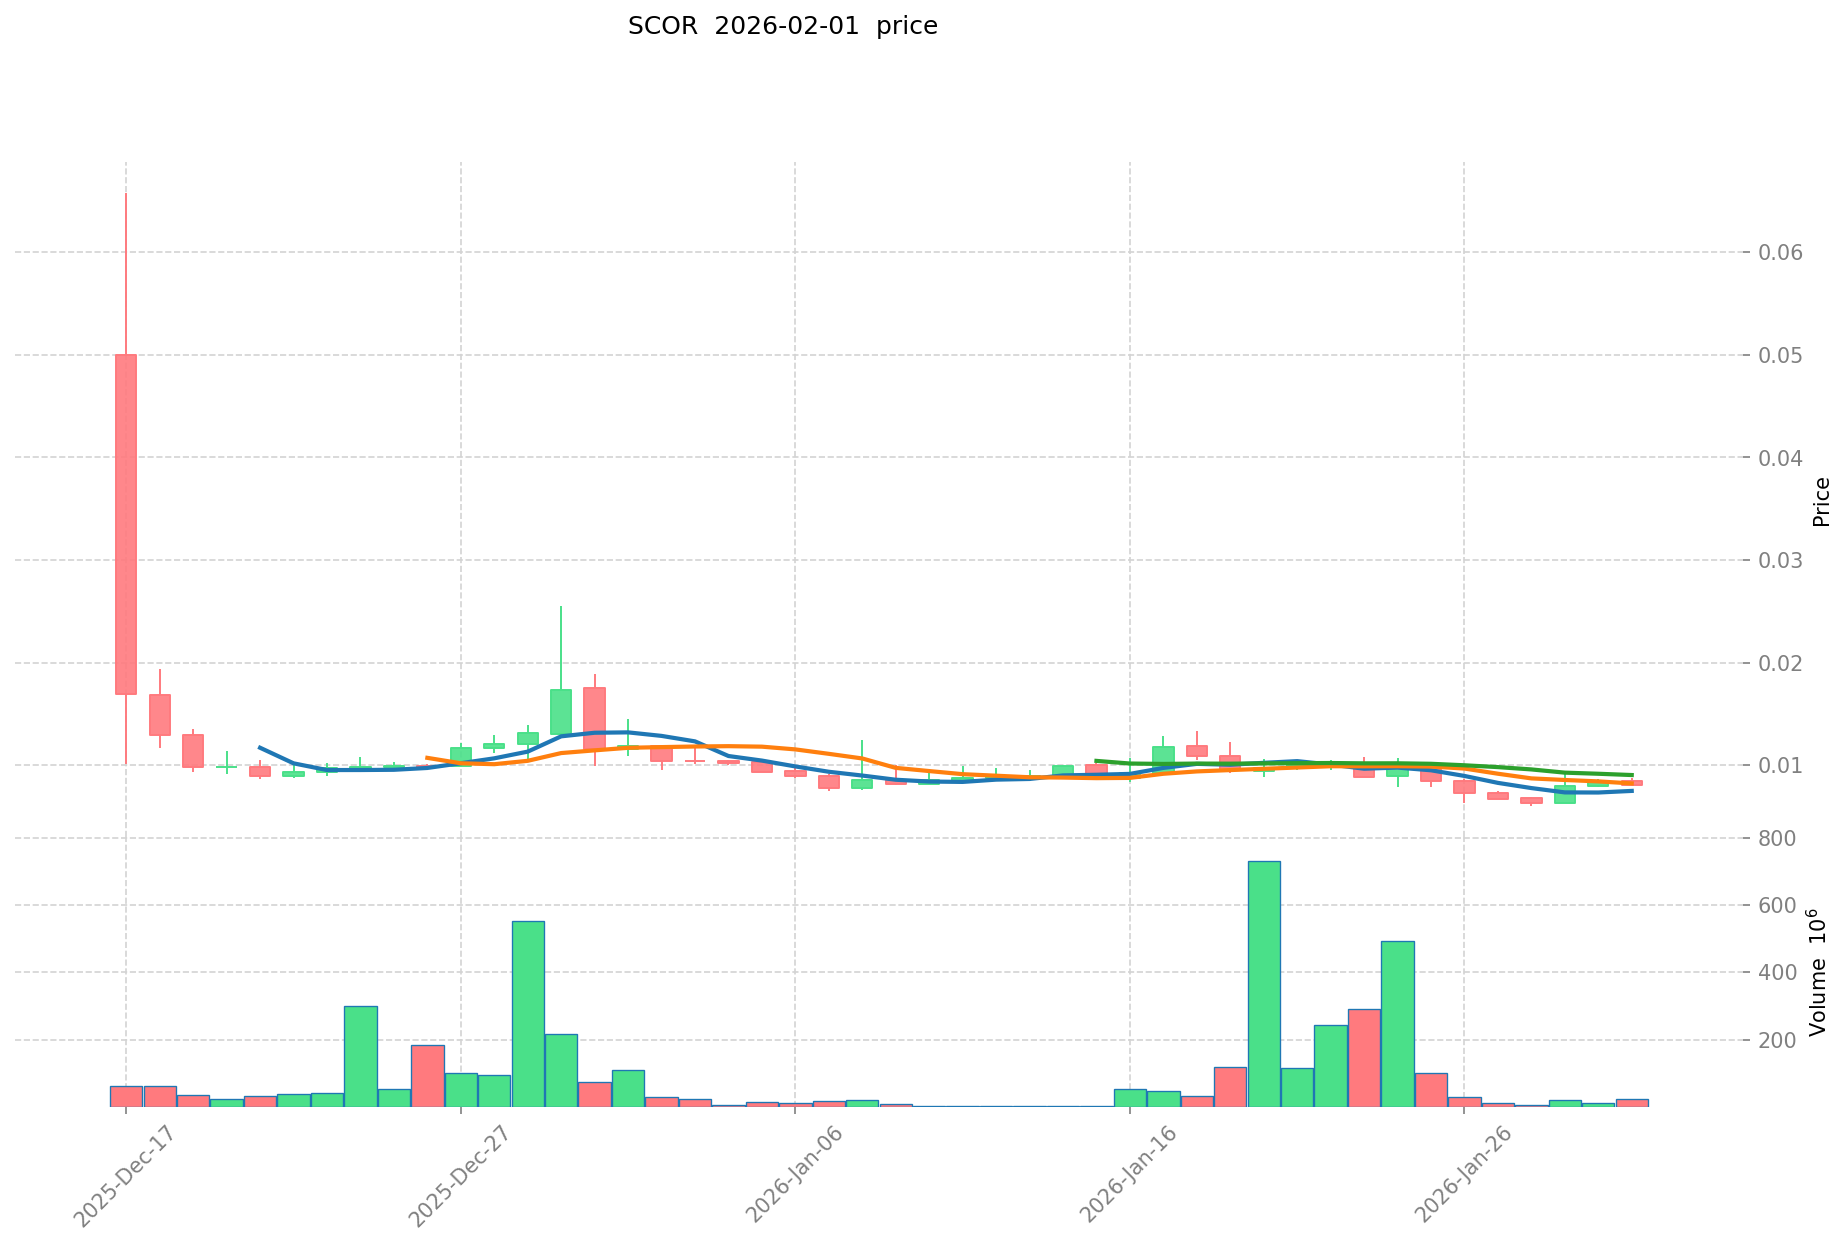
- December 2025: SCOR reached its peak price of $0.0658 on December 17, 2025, marking a significant milestone shortly after its market launch
- January 2026: The token experienced downward pressure, declining to its low of $0.006019 on January 28, 2026, representing a substantial correction from its previous high
SCOR Current Market Situation
As of February 2, 2026, SCOR is trading at $0.007988, positioning itself within the lower range of its historical trading band. The token's 24-hour trading volume stands at $208,093.51, indicating moderate market activity. Over the past hour, SCOR has shown a slight upward movement of 0.86%, while experiencing a 2.01% decline over the 24-hour period.
Looking at broader timeframes, the token has decreased by 3.67% over the past week and 22.15% over the past month, reflecting bearish sentiment in recent trading sessions. The current price of $0.007988 remains notably below the historical high of $0.0658 recorded in mid-December 2025, though it has recovered modestly from the historical low of $0.006019 set in late January 2026.
With a circulating supply of 206,025,560.51 SCOR tokens out of a maximum supply of 4 billion tokens, the circulation ratio stands at approximately 5.15%. The current market capitalization is $1,645,732.18, while the fully diluted market cap reaches $31,952,000. The token maintains a market dominance of 0.0011% and is held by 4,682 addresses across the BASE blockchain network.
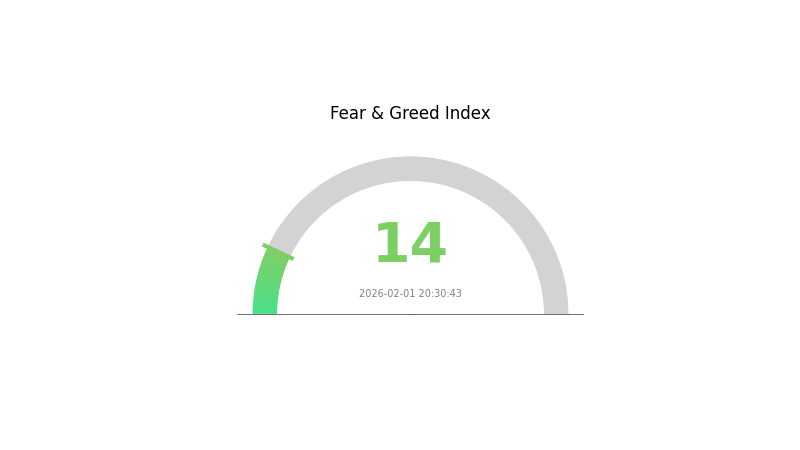
SCOR is currently available for trading on 4 exchanges, with the project gaining traction since its launch on December 16, 2025. The market sentiment index indicates an "Extreme Fear" reading of 14, suggesting cautious investor behavior in the current market environment.
Click to view the current SCOR market price
SCOR Market Sentiment Index
2026-02-01 Fear and Greed Index: 14 (Extreme Fear)
Click to view current Fear & Greed Index
The cryptocurrency market is experiencing extreme fear conditions, with the fear and greed index dropping to 14. This reading indicates severe market pessimism and heightened investor anxiety. Such extreme fear levels typically present contrarian opportunities for long-term investors, as panic-driven selloffs often create attractive entry points. During periods of extreme fear, risk-averse traders should exercise caution, while those with higher risk tolerance may consider strategic accumulation. Monitor market developments closely and consider your investment strategy in line with your personal risk tolerance and investment horizon. Stay informed through reliable market data sources.
SCOR Token Holding Distribution
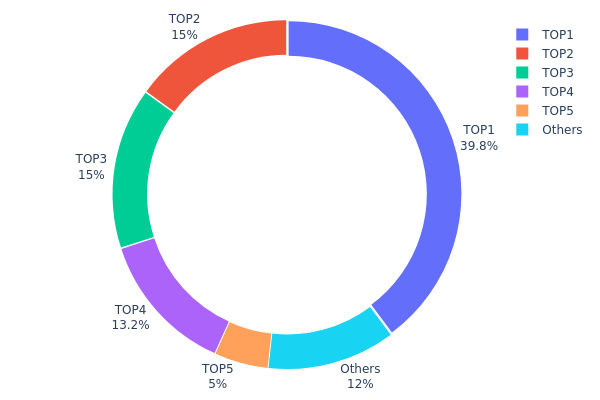
The holding distribution chart illustrates how SCOR tokens are allocated across different wallet addresses, providing insights into the degree of centralization and potential market control by major holders. As of February 2, 2026, the data reveals a highly concentrated ownership structure that warrants careful examination.
The top five addresses collectively control approximately 88.04% of the total SCOR supply, with the largest holder (0xc97a...9802c4) alone possessing 1,591,947.72K tokens, representing 39.79% of the circulating supply. The second and third positions each hold exactly 600,000.00K tokens (15.00%), while the fourth address controls 530,000.00K tokens (13.25%). The fifth position holds 200,000.00K tokens (5.00%). Only 11.96% of the supply is distributed among other addresses, indicating a significant concentration risk.
This extreme centralization pattern suggests potential vulnerabilities in market stability. The dominant position held by the top address, combined with the substantial holdings of the next four wallets, creates an environment where coordinated selling pressure could trigger significant price volatility. Such concentration levels may limit organic price discovery mechanisms and reduce market liquidity depth. From a decentralization perspective, the current distribution reflects a relatively immature token economy with limited broad-based participation, which could affect long-term sustainability and community-driven governance effectiveness.
Click to view the current SCOR Holding Distribution
| Top |
Address |
Holding Qty |
Holding (%) |
| 1 |
0xc97a...9802c4 |
1591947.72K |
39.79% |
| 2 |
0x7bc5...8a999a |
600000.00K |
15.00% |
| 3 |
0xd53e...0f59d1 |
600000.00K |
15.00% |
| 4 |
0x5df1...052b0c |
530000.00K |
13.25% |
| 5 |
0x33e3...143b3e |
200000.00K |
5.00% |
| - |
Others |
478052.28K |
11.96% |
II. Core Factors Influencing SCOR's Future Price
Supply Mechanism
- Market Demand and Competition: The supply configuration is influenced by delivery channels, inventory settings, and product manufacturing locations, which collectively shape market dynamics.
- Historical Patterns: Market demand trends have shown continuous expansion as technology develops and new products emerge, creating sustained consumption growth patterns.
- Current Impact: Supply chain factors including delivery channels and inventory management continue to affect price movements, with configuration adjustments playing a role in short-term price fluctuations.
Institutional and Major Holder Dynamics
- Investment Strategy Considerations: Investment return rate assumptions and capital market conditions influence institutional positioning decisions.
- Market Experience Integration: Institutional participants base their strategies on actual market experience and future expectations, which affects their allocation decisions.
Macroeconomic Environment
- Monetary Policy Impact: Discount rates and investment return assumptions are affected by future macroeconomic conditions and capital market developments, creating uncertainty in price projections.
- Capital Market Conditions: The broader capital market environment influences investment channels and strategies, which indirectly affects pricing dynamics.
- Market Trends Detection: Social network signals and algorithmic trend detection help identify factors that may influence market movements in the future.
Technical Development and Ecosystem Building
- Supply Chain Configuration: The SCOR model's configurability concept helps in describing, measuring, and evaluating supply chain setups, which affects operational efficiency.
- Data-Driven Analysis: Supply chain analysis utilizing data integration across demand forecasting, inventory management, and logistics helps identify bottlenecks and reduce costs, potentially improving overall performance.
III. 2026-2031 SCOR Price Prediction
2026 Outlook
- Conservative Forecast: $0.00447 - $0.00799
- Neutral Forecast: $0.00799 (average market conditions)
- Optimistic Forecast: $0.01078 (requires favorable market sentiment and increased adoption)
2027-2029 Outlook
- Market Stage Expectation: Gradual growth phase with moderate volatility as the project expands its ecosystem and user base
- Price Range Forecast:
- 2027: $0.00619 - $0.01351 (17% increase from 2026)
- 2028: $0.00801 - $0.01316 (43% increase from 2026)
- 2029: $0.01169 - $0.01612 (54% increase from 2026)
- Key Catalysts: Platform development progress, growing community engagement, and potential strategic partnerships
2030-2031 Long-term Outlook
- Baseline Scenario: $0.01350 - $0.01848 (assuming steady market conditions and project maturity)
- Optimistic Scenario: $0.01357 - $0.02370 (with accelerated adoption and positive market trends)
- Transformative Scenario: Above $0.02370 (breakthrough partnerships, significant ecosystem expansion, and favorable regulatory environment)
- 2026-02-02: SCOR remains in early growth stage with potential for measured appreciation over the forecast period
| Year |
Predicted High Price |
Predicted Average Price |
Predicted Low Price |
Price Change |
| 2026 |
0.01078 |
0.00799 |
0.00447 |
0 |
| 2027 |
0.01351 |
0.00938 |
0.00619 |
17 |
| 2028 |
0.01316 |
0.01145 |
0.00801 |
43 |
| 2029 |
0.01612 |
0.0123 |
0.01169 |
54 |
| 2030 |
0.01848 |
0.01421 |
0.0135 |
77 |
| 2031 |
0.0237 |
0.01634 |
0.01357 |
104 |
IV. SCOR Professional Investment Strategy and Risk Management
SCOR Investment Methodology
(I) Long-term Holding Strategy
- Suitable for: Investors seeking exposure to the Web3 sports ecosystem with medium to long-term horizons
- Operational Recommendations:
- Consider accumulating positions during periods of lower volatility, given the current 24-hour trading volume of approximately $208,093
- Monitor network development milestones and partnership announcements from Sweet, the official Web3 partner of NHL and MLS
- Storage Solution: Utilize Gate Web3 Wallet for secure on-chain asset management with multi-signature capabilities
(II) Active Trading Strategy
- Technical Analysis Tools:
- Volume Analysis: Track the 24-hour volume trends to identify accumulation or distribution phases
- Support and Resistance Levels: Monitor the recent low of $0.007884 and high of $0.009442 as key reference points
- Swing Trading Considerations:
- Given the -2.01% 24-hour change and -3.67% weekly change, assess short-term momentum carefully
- Position sizing should account for the relatively limited liquidity across 4 exchanges
SCOR Risk Management Framework
(I) Asset Allocation Principles
- Conservative Investors: 1-3% of crypto portfolio allocation
- Aggressive Investors: 5-8% of crypto portfolio allocation
- Professional Investors: Up to 10-15% with active hedging strategies
(II) Risk Hedging Solutions
- Diversification Approach: Balance SCOR holdings with other Web3 infrastructure assets and established cryptocurrencies
- Position Scaling: Implement gradual entry strategies rather than lump-sum investments given recent 30-day decline of -22.15%
(III) Secure Storage Solutions
- Hot Wallet Recommendation: Gate Web3 Wallet for active trading and ecosystem participation
- Cold Storage Option: Hardware wallet solutions for long-term holdings exceeding comfortable risk thresholds
- Security Precautions: Enable two-factor authentication, maintain backup recovery phrases in multiple secure locations, and avoid sharing wallet addresses publicly
V. SCOR Potential Risks and Challenges
SCOR Market Risks
- Volatility Risk: Price fluctuation between ATH of $0.0658 and ATL of $0.006019 demonstrates significant volatility potential
- Liquidity Risk: With a market cap of approximately $1.65 million and limited exchange listings, order execution may face slippage during large transactions
- Market Sentiment Risk: The dominance of 0.0011% indicates limited market attention, which may result in unpredictable price movements
SCOR Regulatory Risks
- Sports IP Tokenization Compliance: Evolving regulatory frameworks around tokenized intellectual property rights in professional sports may impact operational models
- Securities Classification Uncertainty: Potential regulatory scrutiny regarding token classification could affect trading availability
- Multi-Jurisdictional Challenges: Operating across different sports leagues and territories involves navigating diverse regulatory environments
SCOR Technical Risks
- Smart Contract Vulnerability: As with any blockchain-based protocol, smart contract bugs or exploits could compromise user funds
- Network Dependency: Building on BASE blockchain creates dependency on the underlying infrastructure's stability and performance
- Integration Complexity: Connecting multiple sports leagues, teams, and thousands of athletes requires maintaining complex technical integrations that may face operational challenges
VI. Conclusion and Action Recommendations
SCOR Investment Value Assessment
SCOR presents an innovative approach to Web3 sports infrastructure with backing from notable entities including the NHL, MSG, and Animoca Brands. The network's focus on tokenizing sports IP and creating direct fan-to-organization value sharing represents a potentially significant market opportunity. However, the current market metrics—including a 5.15% circulating supply ratio, limited liquidity, and recent price decline of -22.15% over 30 days—suggest the project remains in early development stages. The long-term value proposition depends on successful adoption by sports organizations and fans, while short-term risks include market volatility and liquidity constraints.
SCOR Investment Recommendations
✅ Beginners: Consider starting with minimal allocation (1-2% of crypto portfolio) and focus on understanding the Web3 sports ecosystem before increasing exposure
✅ Experienced Investors: Employ dollar-cost averaging strategy with 3-5% allocation, monitoring partnership developments and network metrics for signs of adoption
✅ Institutional Investors: Conduct thorough due diligence on the legal structure of sports IP tokenization, consider strategic allocation of 5-10% with active risk management protocols
SCOR Trading Participation Methods
- Spot Trading: Available on Gate.com and three other exchanges for direct token acquisition
- Gradual Accumulation: Implement systematic purchase plans during periods of stable or declining prices to build positions
- Ecosystem Participation: Engage with the SCOR network to understand value accrual mechanisms beyond pure price speculation
Cryptocurrency investment carries extremely high risks, and this article does not constitute investment advice. Investors should make prudent decisions based on their own risk tolerance and are advised to consult professional financial advisors. Never invest more than you can afford to lose.
FAQ
What price is SCOR expected to reach in the future?
Based on current trend analysis, SCOR is predicted to reach approximately $0.016703 by 2030, representing a 27.63% increase from current levels. Price projections depend on market conditions and adoption growth.
What are the main factors affecting SCOR price?
SCOR price is primarily influenced by supply and demand dynamics, market sentiment driven by news and social media, investor behavior, and overall market trends. Trading volume and project developments also play significant roles in price movement.
How to predict long-term price trends for SCOR tokens?
SCOR token long-term prices are driven by market demand, project fundamentals, and ecosystem adoption. Analyze on-chain metrics, trading volume, developer activity, and market sentiment. Compare historical patterns and industry trends for informed price forecasting.
SCOR has experienced significant volatility in its history. The all-time high reached ¥0.4452 in December 2025, while the all-time low was ¥0.04213 in January 2026. Currently, SCOR trades between ¥0.05582 and ¥0.06086, showing a correction from its peak levels.
What is SCOR's price advantage compared to similar tokens?
SCOR offers competitive pricing at $0.007994 with strong fundamentals. Its relatively low entry price, $1.79M market cap, and robust $1.12M daily trading volume provide excellent value and liquidity compared to similar tokens in the market.
What are the risks and return expectations for investing in SCOR coins?
SCOR presents high volatility risks typical of crypto assets. Expected returns depend on market conditions, with potential dividend yields around 6.55% and current market cap at 4.88B. Long-term growth potential exists in the Web3 ecosystem.
* The information is not intended to be and does not constitute financial advice or any other recommendation of any sort offered or endorsed by Gate.