This comprehensive analysis explores Stader Labs (SD) price dynamics and investment outlook through 2031, examining the staking infrastructure token's market position and future potential. The article reviews SD's price evolution from its $30.17 peak to current $0.23 levels, analyzes current market conditions with extreme fear sentiment, and provides detailed price forecasts ranging from $0.119 to $0.646 across different scenarios. Key sections cover holding distribution patterns, core market factors, professional investment strategies including long-term holding and active trading approaches, and critical risk management frameworks. The guide presents both opportunities in PoS network expansion and significant challenges including regulatory uncertainty, smart contract vulnerabilities, and low market liquidity. Investors receive actionable recommendations tailored to beginners, experienced traders, and institutional players, emphasizing thorough due diligence and risk-adjusted portfolio allocation strategies
Introduction: SD's Market Position and Investment Value
Stader Labs (SD) serves as a staking infrastructure solution designed to facilitate secure and convenient asset staking across multiple Proof-of-Stake networks. Since its inception, the project has established itself as a key middleware infrastructure provider, serving retail crypto users, exchanges, custodians, and fintech players. As of 2026, SD maintains a market capitalization of approximately $16.28 million, with a circulating supply of around 69.62 million tokens, and the price stabilizing near $0.23. This staking-focused asset is playing an increasingly important role in enabling users to participate in network validation across various blockchain ecosystems.
This article will comprehensively analyze SD's price trajectory from 2026 to 2031, combining historical patterns, market supply-demand dynamics, ecosystem development, and macroeconomic factors to provide investors with professional price forecasts and practical investment strategies.
I. SD Price History Review and Market Status
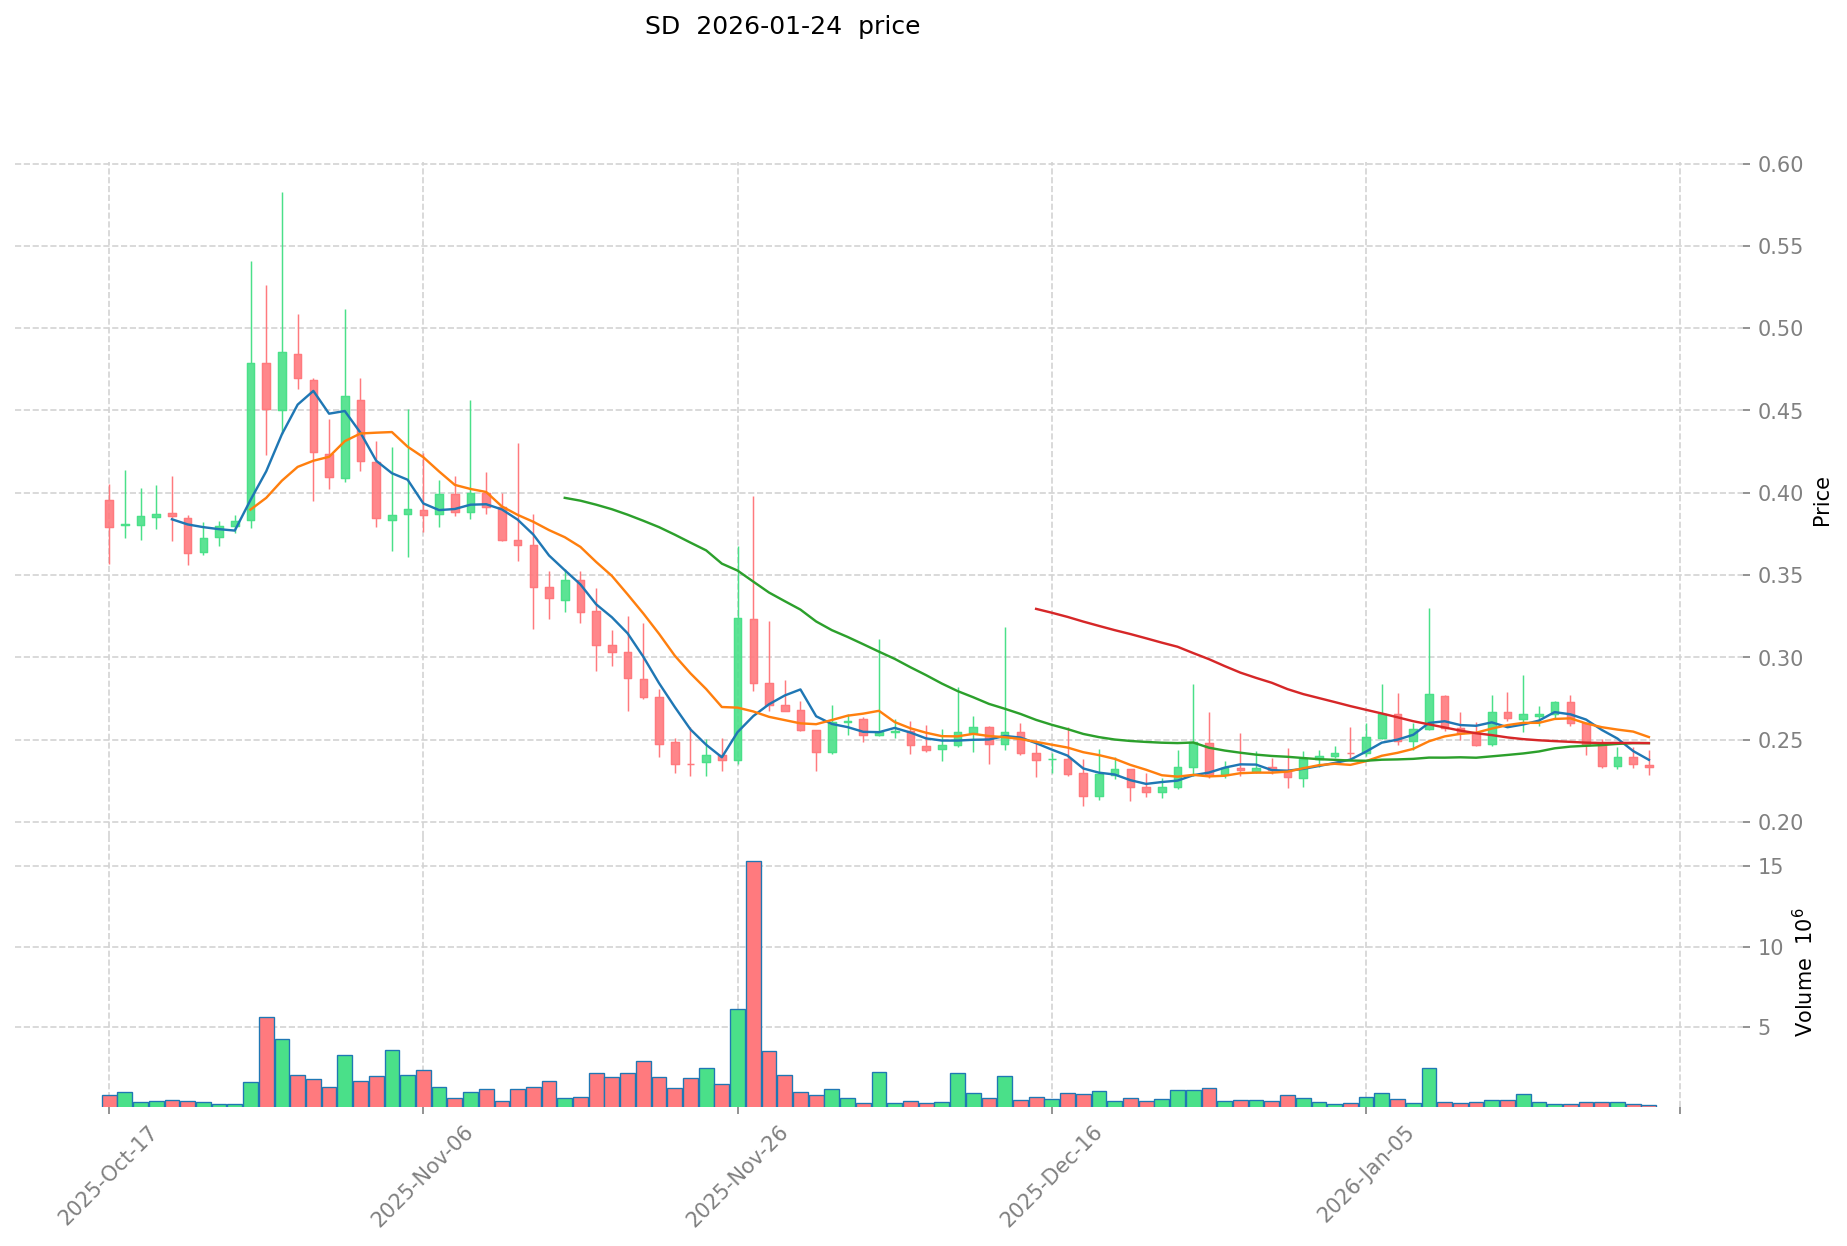
SD Historical Price Evolution Trajectory
- 2022: Project launched with initial price at $4.5, reached historical high of $30.17 on March 15, experiencing significant growth momentum in early market phase
- 2025: Market underwent substantial correction, price declined to historical low of $0.211989 on December 19, representing a considerable retracement from peak levels
SD Current Market Situation
As of January 24, 2026, SD is trading at $0.2339, showing a modest recovery from its recent low point. The token has experienced a 0.21% increase over the past hour, though it registered a 1.01% decline in the 24-hour period. Over the weekly timeframe, SD has decreased by 11.76%, while maintaining a slight 0.33% gain on the monthly scale. The annual performance reflects a 76.98% decline, indicating challenging market conditions throughout the past year.
The 24-hour trading range spans from $0.2288 to $0.2436, with trading volume reaching $34,667.85. The circulating supply stands at 69.62 million tokens out of a total supply of 120 million and maximum supply of 150 million, representing a circulation ratio of 46.41%. The current market capitalization is approximately $16.28 million, with a fully diluted market cap of $28.07 million. SD holds a market share of 0.00088% and ranks 965th in the overall cryptocurrency market. The token is currently available on 18 exchanges and maintains a holder base of 20,623 addresses.
Click to view current SD market price
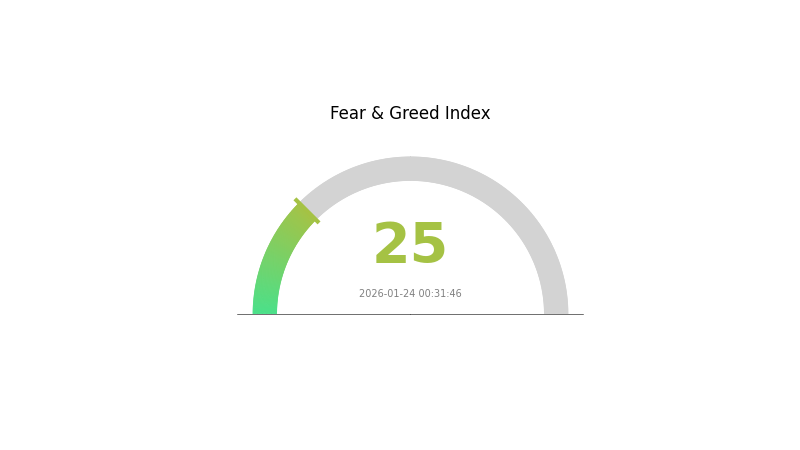
SD Market Sentiment Indicator
2026-01-24 Fear and Greed Index: 25 (Extreme Fear)
Click to view the current Fear & Greed Index
The crypto market is currently experiencing extreme fear, with the Fear and Greed Index standing at 25. This significantly low reading indicates widespread investor anxiety and pessimism in the market. When the index reaches such extreme levels, it often signals potential buying opportunities for contrarian investors, as markets tend to recover from oversold conditions. However, traders should exercise caution and conduct thorough research before making investment decisions. Such extreme fear periods typically precede market stabilization or rebounds.
SD Holding Distribution
The holding distribution chart illustrates the concentration of token ownership across different wallet addresses, serving as a critical indicator of decentralization and potential market manipulation risks. By analyzing the distribution pattern, researchers can assess whether token supply is widely dispersed among numerous holders or concentrated in the hands of a few major addresses, which directly impacts market stability and price volatility.
According to current on-chain data, SD exhibits a moderately concentrated holding structure. The top address (0xae71...d9bece) controls 31,806.68K tokens, representing 21.20% of the total supply, while the second-largest holder (0x0000...000001) possesses exactly 20.00% with 30,000.00K tokens. The top five addresses collectively hold 59.62% of the circulating supply, indicating significant concentration among major stakeholders. Meanwhile, the remaining 40.38% is distributed among other addresses, suggesting a relatively diverse but still concentrated ownership pattern.
This concentration level presents both opportunities and risks for market participants. The substantial holdings by top addresses could lead to heightened price volatility if these entities decide to liquidate positions, potentially triggering cascading sell-offs. However, the presence of approximately 40% distribution among smaller holders provides a moderate cushion against complete market control by whales. From a decentralization perspective, SD's current structure reflects an intermediate state—not entirely centralized like some governance tokens, yet not fully distributed like mature cryptocurrencies with broader community adoption. This holding pattern warrants careful monitoring, as shifts in whale behavior could significantly influence market dynamics and liquidity conditions.
Click to view current SD Holding Distribution
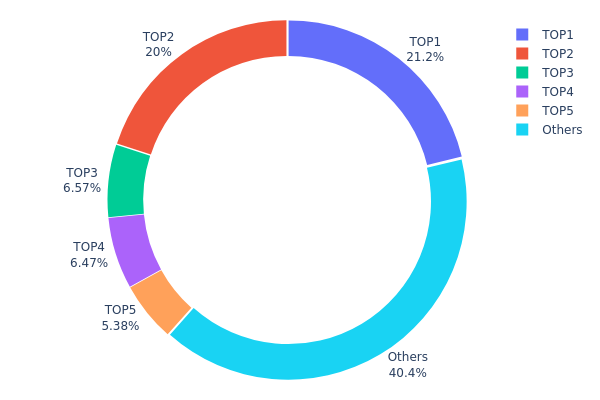
| Top |
Address |
Holding Qty |
Holding (%) |
| 1 |
0xae71...d9bece |
31806.68K |
21.20% |
| 2 |
0x0000...000001 |
30000.00K |
20.00% |
| 3 |
0x7af4...3ee91f |
9855.40K |
6.57% |
| 4 |
0x1536...642487 |
9710.24K |
6.47% |
| 5 |
0x7b99...444b30 |
8077.31K |
5.38% |
| - |
Others |
60550.36K |
40.38% |
II. Core Factors Affecting SD's Future Price
Based on the available information, there is insufficient data regarding SD's supply mechanisms, institutional holdings, macroeconomic positioning, or technical developments to provide a comprehensive analysis at this time. Market participants should conduct thorough research and monitor official project announcements for updates on these fundamental factors before making investment decisions.
III. 2026-2031 SD Price Prediction
2026 Outlook
- Conservative prediction: $0.119 - $0.234
- Neutral prediction: $0.234
- Optimistic prediction: $0.302 (requires favorable market conditions and increased adoption)
2027-2029 Outlook
- Market stage expectation: SD may experience gradual growth with moderate volatility as the project matures and expands its ecosystem
- Price range predictions:
- 2027: $0.249 - $0.378 (14% year-over-year growth expected)
- 2028: $0.184 - $0.352 (38% cumulative growth from 2026)
- 2029: $0.172 - $0.398 (44% cumulative growth from 2026)
- Key catalysts: ecosystem development, strategic partnerships, technology upgrades, and broader market adoption could drive price appreciation during this period
2030-2031 Long-term Outlook
- Base scenario: $0.291 - $0.368 in 2030 (57% cumulative growth from 2026, assuming steady market development)
- Optimistic scenario: $0.530 in 2030 (requires strong market momentum and significant ecosystem expansion)
- Transformative scenario: $0.449 - $0.646 by 2031 (91% cumulative growth from 2026, contingent on breakthrough adoption and favorable regulatory environment)
- 2026-01-24: SD trading within projected range, market participants monitoring development progress
| Year |
Predicted High Price |
Predicted Average Price |
Predicted Low Price |
Price Change |
| 2026 |
0.30199 |
0.2341 |
0.11939 |
0 |
| 2027 |
0.37794 |
0.26804 |
0.24928 |
14 |
| 2028 |
0.35206 |
0.32299 |
0.18411 |
38 |
| 2029 |
0.39828 |
0.33753 |
0.17214 |
44 |
| 2030 |
0.52978 |
0.36791 |
0.29065 |
57 |
| 2031 |
0.64634 |
0.44885 |
0.30073 |
91 |
IV. SD Professional Investment Strategy and Risk Management
SD Investment Methodology
(1) Long-term Holding Strategy
- Target investors: Investors with strong belief in staking infrastructure development and PoS network expansion
- Operational recommendations:
- Evaluate Stader Labs' expansion progress across multiple PoS networks and middleware infrastructure development
- Monitor the platform's total staked assets and active wallet growth trends
- Utilize Gate Web3 Wallet for secure storage, enabling convenient asset management while maintaining private key control
(2) Active Trading Strategy
- Technical analysis tools:
- Support and resistance levels: Current trading range shows support near $0.2288 (24H low) and resistance around $0.2436 (24H high)
- Volume analysis: Monitor 24-hour trading volume trends; current volume stands at approximately $34,667
- Swing trading considerations:
- Recent 7-day decline of 11.76% may present potential entry opportunities for risk-tolerant traders
- Set stop-loss orders to manage downside risk given the token's historical volatility
SD Risk Management Framework
(1) Asset Allocation Principles
- Conservative investors: 1-3% portfolio allocation
- Aggressive investors: 5-10% portfolio allocation
- Professional investors: Up to 15% portfolio allocation with active hedging strategies
(2) Risk Hedging Solutions
- Position sizing: Divide total intended investment into multiple tranches to average entry prices
- Diversification approach: Balance SD holdings with other staking-related tokens and mainstream assets
(3) Secure Storage Solutions
- Non-custodial wallet recommendation: Gate Web3 Wallet provides comprehensive security features for SD token storage
- Hardware wallet solution: Consider cold storage options for large holdings intended for long-term holding
- Security precautions: Never share private keys or seed phrases; enable two-factor authentication on all trading accounts; verify contract addresses before transactions
V. SD Potential Risks and Challenges
SD Market Risks
- High volatility: The token experienced a 76.98% decline over the past year, indicating substantial price fluctuation risk
- Low market dominance: With only 0.00088% market share, SD faces liquidity challenges and higher susceptibility to market manipulation
- Limited trading volume: Daily trading volume of approximately $34,667 suggests potential difficulty in executing large orders without significant price impact
SD Regulatory Risks
- Staking service scrutiny: Regulatory frameworks for staking services remain unclear in multiple jurisdictions, potentially affecting platform operations
- Cross-chain compliance: As Stader expands across multiple blockchain networks, navigating varying regulatory requirements becomes increasingly complex
- Securities classification concerns: Potential classification of staking rewards as securities income could trigger additional compliance requirements
SD Technical Risks
- Smart contract vulnerabilities: Despite modular design advantages, smart contract exploits remain a persistent threat in DeFi infrastructure
- Network dependency: Platform performance relies heavily on underlying PoS networks' stability and security
- Competition intensity: Established staking platforms and emerging competitors may erode Stader's market position
VI. Conclusion and Action Recommendations
SD Investment Value Assessment
Stader Labs presents a specialized investment opportunity in the staking infrastructure sector, targeting the growing PoS network ecosystem. The platform's modular middleware approach offers potential value for users seeking convenient staking solutions across multiple networks. However, investors should carefully weigh the significant risks evidenced by the token's 76.98% annual decline, low market capitalization of approximately $16.28 million, and limited liquidity. The current circulating supply represents 46.41% of fully diluted valuation, suggesting potential future dilution pressure. While the platform's vision to serve retail users, exchanges, and institutional clients demonstrates ambition, market adoption metrics require careful monitoring.
SD Investment Recommendations
✅ Beginners: Approach with extreme caution; limit exposure to no more than 1-2% of total portfolio; prioritize education about staking mechanisms and PoS networks before investing
✅ Experienced investors: Consider small speculative positions (3-5% allocation) only if possessing strong conviction in staking infrastructure growth; implement strict stop-loss measures
✅ Institutional investors: Conduct thorough due diligence on platform security audits, team background, and competitive positioning; consider strategic allocation only within diversified blockchain infrastructure portfolios
SD Trading Participation Methods
- Spot trading: Purchase SD tokens through Gate.com's spot market for direct ownership and staking opportunities
- Dollar-cost averaging: Implement systematic investment plans to mitigate timing risk given the token's historical volatility
- Research-driven approach: Stay informed about Stader's network expansion announcements, partnership developments, and platform TVL metrics before making investment decisions
Cryptocurrency investment carries extremely high risks, and this article does not constitute investment advice. Investors should make prudent decisions based on their own risk tolerance and are advised to consult professional financial advisors. Never invest more than you can afford to lose.
FAQ
Will SD price rise or fall in the future?
SD price is expected to rise. With increasing adoption, growing transaction volume, and strong market fundamentals, SD demonstrates bullish potential. Long-term trends suggest upward momentum as the ecosystem expands and utility increases.
What are the main factors affecting SD price?
SD price is primarily influenced by market demand, trading volume, network adoption, technological developments, overall crypto market sentiment, regulatory announcements, and macroeconomic conditions. These factors collectively determine price movements and market dynamics.
How to conduct technical analysis and forecast SD price?
Analyze SD price trends using candlestick charts, moving averages, and RSI indicators. Monitor trading volume and support/resistance levels. Track market sentiment and blockchain activity. Use these metrics to identify bullish or bearish patterns for price prediction.
Common SD price prediction tools include technical analysis charts, moving averages, RSI indicators, trading volume analysis, on-chain metrics, market sentiment analysis, and AI-powered prediction models. Combining multiple indicators provides more accurate forecasting for informed decision-making.
What are the advantages and disadvantages of SD price compared to other similar assets?
SD offers lower volatility and stable yield mechanisms compared to similar assets. Advantages include strong community support and consistent performance. Disadvantages include lower trading volume and limited liquidity relative to major competitors in the staking derivative space.
What is the historical price trend of SD and are there any patterns to follow?
SD has shown cyclical patterns tied to market sentiment and adoption cycles. Historically, price movements correlate with broader crypto market trends and project development milestones. Long-term trajectory suggests growth potential with periodic volatility typical of emerging digital assets.
* The information is not intended to be and does not constitute financial advice or any other recommendation of any sort offered or endorsed by Gate.