SIGN Price Prediction 2026-2031 provides comprehensive expert analysis of the Web3 infrastructure token trading at $0.03824 with a $45.89M market cap. This guide analyzes SIGN's historical price evolution, current market sentiment at fear level 44, and technical factors influencing future performance. The article addresses investor concerns about price volatility, liquidity, and market concentration, offering detailed predictions: 2026 range $0.02638-$0.0497, 2027 $0.04221-$0.0532, and long-term targets reaching $0.10542 by 2031 under favorable conditions. Professional investment strategies include dollar-cost averaging, active trading approaches, and risk management frameworks suitable for beginners through institutional investors. Comprehensive risk assessment covers market volatility, regulatory challenges, and smart contract vulnerabilities. Trade SIGN on Gate with actionable recommendations aligned with different investor profiles and risk tolerances.
Introduction: SIGN's Market Position and Investment Value
Sign (SIGN), as a global infrastructure project focused on credential verification and token distribution, has been developing its ecosystem through two core products since its launch in 2025: Sign Protocol, an omni-chain attestation protocol serving as foundational infrastructure for decentralized applications and governments, and Token Table, a smart contract-based platform for token distribution. As of January 2026, SIGN has achieved a market capitalization of approximately $45.89 million, with a circulating supply of 1.2 billion tokens, and the price maintains around $0.03824. This asset, which aims to revolutionize digital credential verification and token management, is playing an increasingly significant role in the Web3 infrastructure landscape.
This article will comprehensively analyze SIGN's price trajectory from 2026 to 2031, combining historical patterns, market supply and demand dynamics, ecosystem development, and macroeconomic conditions to provide investors with professional price forecasts and practical investment strategies.
I. SIGN Price History Review and Market Status
SIGN Historical Price Evolution Trajectory
- 2025: SIGN token was launched in April with initial trading activity, reaching a notable price level of $0.14888 on April 29, 2025, representing an early market valuation peak
- 2025: Following the initial launch period, the token experienced significant market adjustment, with price declining to $0.00611 by October 10, 2025, reflecting broader market volatility
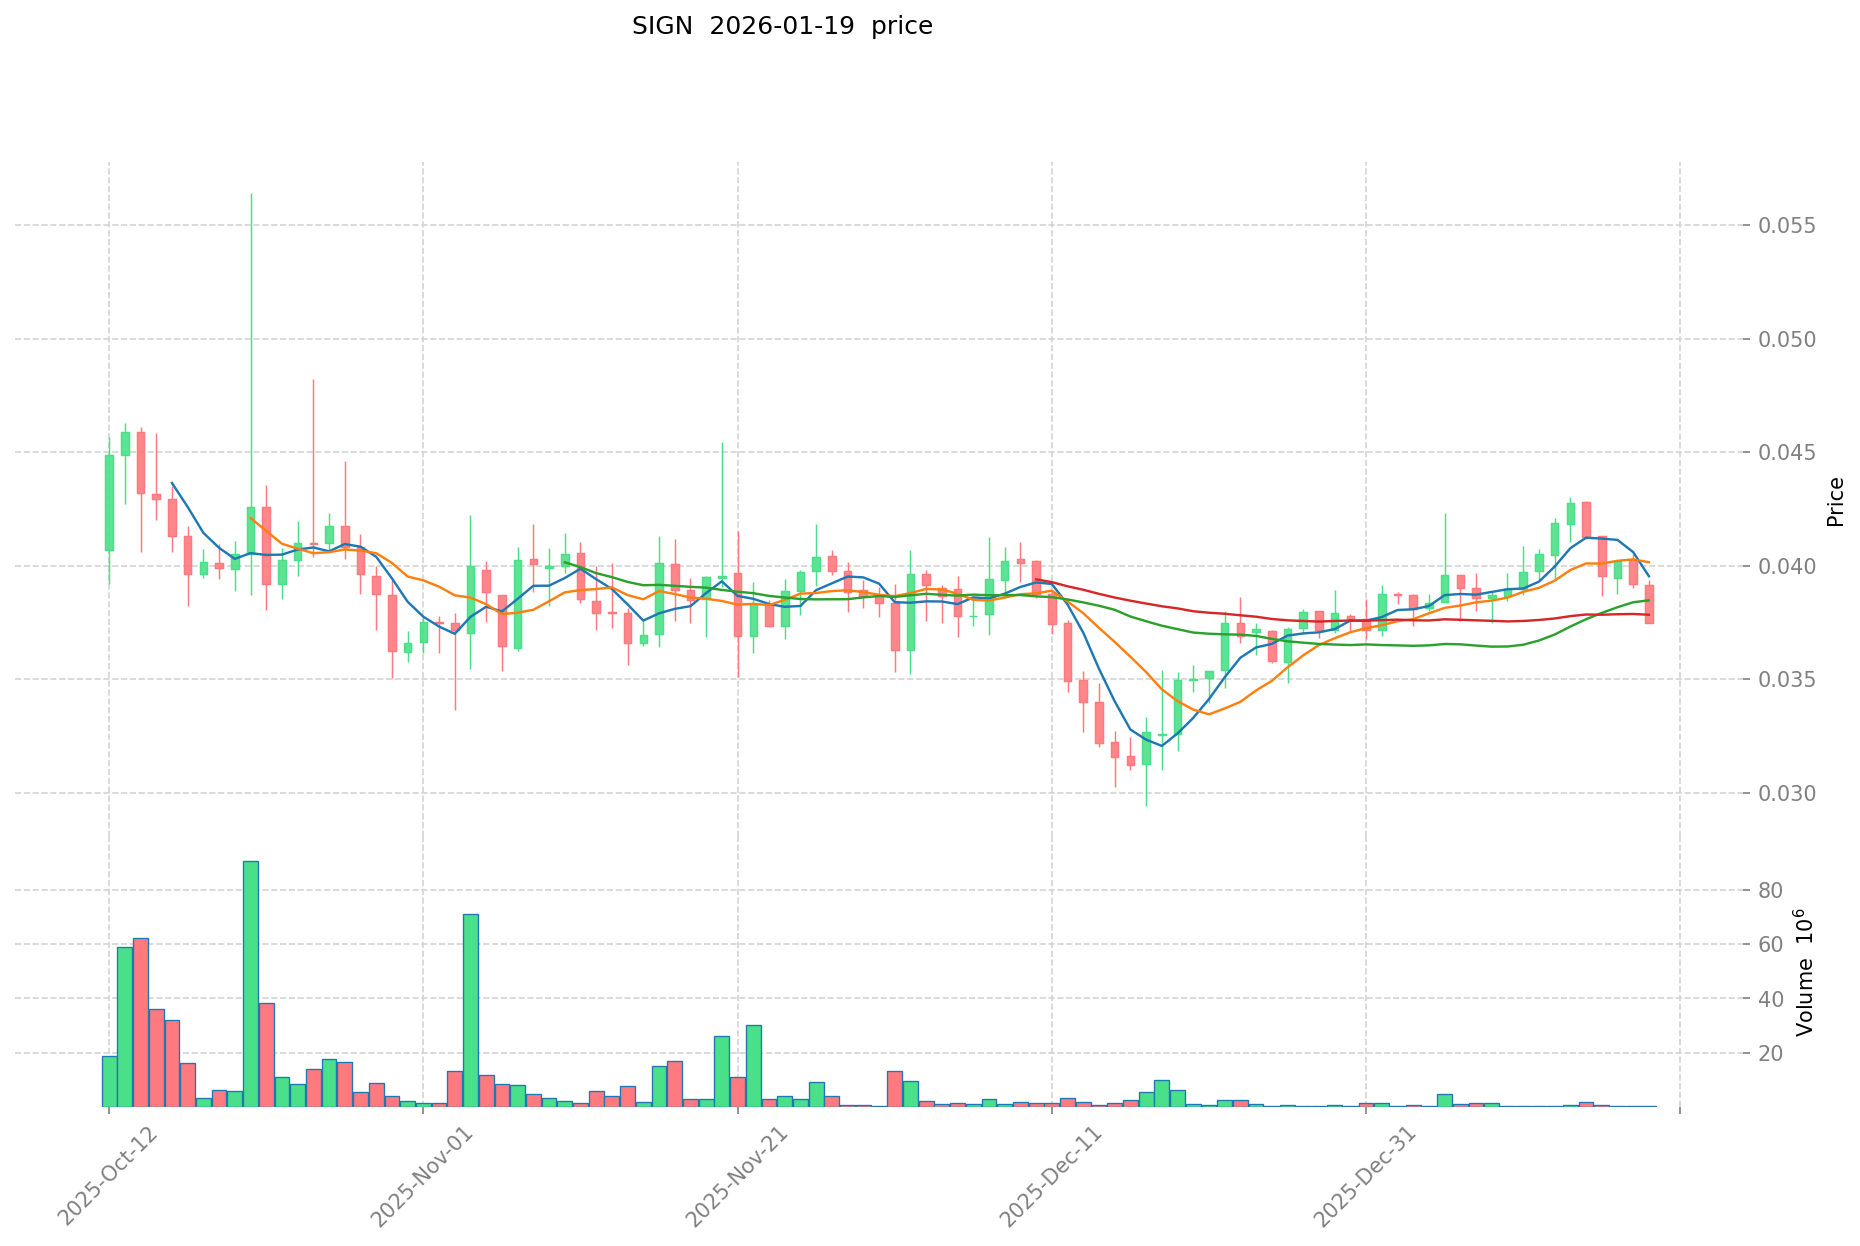
- 2025-2026: Through the market cycle transition, SIGN demonstrated recovery potential, with price movement from the lower range back toward the $0.038 level by January 2026
SIGN Current Market Situation
As of January 19, 2026, SIGN is trading at $0.03824, positioning itself within a mid-range valuation zone relative to its historical price spectrum. The token has experienced mixed short-term momentum, with a 1-hour decline of 1.19% and 24-hour decrease of 1.61%, indicating recent selling pressure in the immediate trading sessions.
Over the past week, SIGN has decreased by 4.61%, while maintaining a 30-day gain of 9.15%, suggesting some positive medium-term price action despite near-term volatility. The annual performance shows a decline of 51.94%, reflecting the broader market adjustment from earlier price levels.
The current 24-hour trading range spans from $0.03553 to $0.04036, with total trading volume reaching $195,106.26. SIGN maintains a market capitalization of approximately $45.89 million with 1.2 billion tokens in circulation, representing 12% of the total supply of 10 billion tokens. The fully diluted market cap stands at $382.4 million.
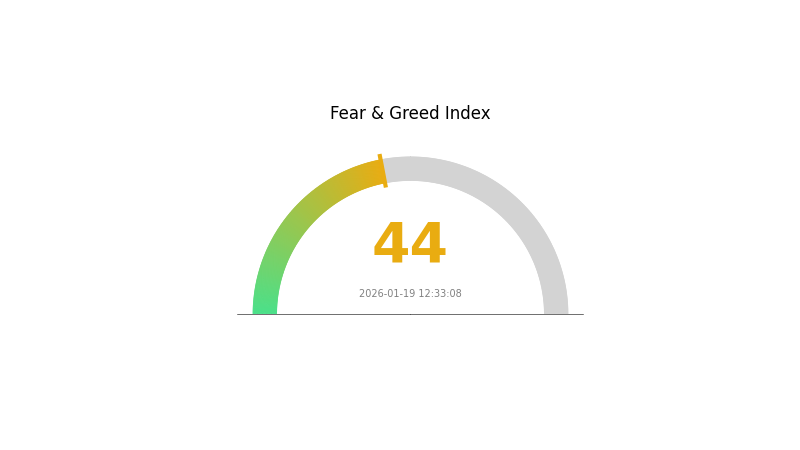
SIGN is currently ranked #553 in the cryptocurrency market with a market dominance of 0.011%. The token is listed on 28 exchanges and has approximately 560 holders. The market sentiment index indicates a "Fear" reading at 44, reflecting cautious investor positioning in the current environment.
Click to view current SIGN market price
SIGN Market Sentiment Index
2026-01-19 Fear and Greed Index: 44 (Fear)
Click to view the current Fear & Greed Index
Currently, the crypto market is in a fear state with an index reading of 44. This indicates heightened market anxiety and cautious investor sentiment. When fear dominates, markets typically experience increased volatility and selling pressure. Traders should exercise prudent risk management and avoid impulsive decisions driven by emotions. This environment often presents opportunities for long-term investors to accumulate positions at lower valuations. Monitor market developments closely and consider your investment strategy accordingly on Gate.com.
SIGN Holding Distribution
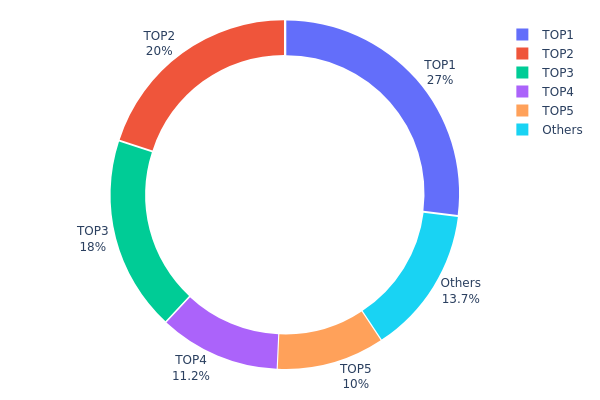
The holding distribution chart represents the allocation of token supply across different wallet addresses, serving as a crucial indicator of token decentralization and market structure. By analyzing the concentration of holdings among top addresses, we can assess potential risks related to price manipulation, liquidity constraints, and overall market stability.
Based on the current data, SIGN exhibits a highly concentrated holding pattern. The top five addresses collectively control 86.29% of the total token supply, with the largest single address holding 27.00% (2.7M tokens), followed by 20.00% and 18.05% respectively. Such pronounced concentration presents several structural concerns for the market. The dominance of a few major holders creates significant vulnerability to large-scale sell pressure, as coordinated or individual liquidations from these top addresses could trigger substantial price volatility. This distribution pattern also raises potential concerns about market manipulation capabilities, as the top three addresses alone control 65.05% of circulating supply.
The remaining 13.71% distributed among other addresses suggests limited retail participation and weak decentralization. This concentration level indicates that SIGN's market structure is heavily dependent on the behavior and intentions of a small number of major stakeholders. Such imbalanced distribution typically correlates with reduced market depth and heightened susceptibility to unilateral price movements, potentially deterring institutional investors who prioritize liquidity and market resilience.
Click to view current SIGN Holding Distribution
| Top |
Address |
Holding Qty |
Holding (%) |
| 1 |
0xd4b0...1f3755 |
2700000.00K |
27.00% |
| 2 |
0x77ed...baf52e |
2000000.00K |
20.00% |
| 3 |
0x1888...66c58f |
1805000.00K |
18.05% |
| 4 |
0x3a0e...b576a9 |
1124307.71K |
11.24% |
| 5 |
0xccc0...62bc84 |
1000000.00K |
10.00% |
| - |
Others |
1370692.29K |
13.71% |
II. Core Factors Influencing SIGN's Future Price
Market Trends and Technical Analysis
- Technical Analysis Methodology: Technical analysis serves as a valuable tool in financial markets, providing insights into potential price movements through the study of historical patterns and trends.
- Historical Price Patterns: Analysis of past price trends can offer valuable perspectives on future potential price movements, helping traders identify possible reversals and continuation patterns.
- Current Market Application: Price behavior and oscillator indicators, such as RSI, can alert traders to potential trend changes. For instance, divergences between price action and technical indicators may signal upcoming reversals.
Market Sentiment and Risk Management
- Extreme Fear Indicators: Current cryptocurrency markets are experiencing extreme fear conditions, with the Fear and Greed Index at 19, indicating severely depressed investor sentiment that may present opportunities for contrarian investment strategies.
- Historical Context: Historically, periods of extreme fear have often preceded market rebounds, though the fundamental factors driving sentiment remain important considerations.
- Risk Management Approach: Traders are advised to maintain diversified asset portfolios, strengthen risk management practices, and closely monitor market dynamics.
Macroeconomic Environment
- Monetary Policy Impact: Central bank interest rate decisions and policy changes may significantly influence cryptocurrency prices. The Federal Reserve's rate adjustment cycle, which began in September 2024, has driven down global real interest rates.
- Opportunity Cost Considerations: Lower real interest rates reduce the opportunity cost of holding non-yielding assets, potentially providing favorable conditions for cyclical investment inflows.
- Geopolitical Variables: International developments and policy changes across various countries continue to influence market dynamics.
Price Volatility and Trading Activity
- Volatility as Technical Indicator: Price volatility represents an important technical indicator, and identifying markets that align with individual risk tolerance levels remains crucial for traders.
- Trading Activity Impact: Increased trading activity can drive price movements and create trading opportunities, while influxes of new buyers or sellers may validate market trends.
III. 2026-2031 SIGN Price Prediction
2026 Outlook
- Conservative prediction: $0.02638-$0.03823
- Neutral prediction: $0.03823-$0.04
- Optimistic prediction: $0.0497 (requires favorable market conditions and increased adoption)
2027-2029 Outlook
- Market stage expectation: SIGN may enter a growth phase as the cryptocurrency market matures, with potential expansion in utility and ecosystem development
- Price range prediction:
- 2027: $0.04221-$0.0532
- 2028: $0.04712-$0.06996
- 2029: $0.04267-$0.08298
- Key catalysts: Market recovery trends, technological upgrades, expanded use cases, and growing community engagement could drive price appreciation
2030-2031 Long-term Outlook
- Baseline scenario: $0.05548-$0.1017 (assuming steady market growth and maintained project development)
- Optimistic scenario: $0.06049-$0.10542 (contingent on strong adoption rates and positive regulatory environment)
- Transformative scenario: Exceeding $0.10542 (requires breakthrough partnerships, significant technological advancements, and widespread institutional adoption)
- 2026-01-19: SIGN trading within predicted range of $0.02638-$0.0497
| Year |
Predicted High Price |
Predicted Average Price |
Predicted Low Price |
Price Change |
| 2026 |
0.0497 |
0.03823 |
0.02638 |
0 |
| 2027 |
0.0532 |
0.04396 |
0.04221 |
14 |
| 2028 |
0.06996 |
0.04858 |
0.04712 |
27 |
| 2029 |
0.08298 |
0.05927 |
0.04267 |
54 |
| 2030 |
0.1017 |
0.07112 |
0.05548 |
85 |
| 2031 |
0.10542 |
0.08641 |
0.06049 |
125 |
IV. SIGN Professional Investment Strategies and Risk Management
SIGN Investment Methodology
(I) Long-term Holding Strategy
- Suitable for: Investors with a strong conviction in decentralized credential infrastructure and token distribution platforms, typically with a 1-3 year investment horizon
- Operational Recommendations:
- Consider accumulating SIGN positions during market pullbacks, as the token has shown a 9.15% gain over the past 30 days despite broader volatility
- Implement a dollar-cost averaging (DCA) approach to mitigate entry price risk, given the token's 24-hour volatility range of $0.03553 to $0.04036
- Storage Solution: Utilize Gate Web3 Wallet for secure custody, supporting ERC-20, BEP-20, and BASE standards compatible with SIGN tokens
(II) Active Trading Strategy
- Technical Analysis Tools:
- Volume Analysis: Monitor the 24-hour trading volume of $195,106.26 to identify potential breakout or breakdown scenarios
- Support and Resistance Levels: Key technical levels include the 24-hour low at $0.03553 (support) and 24-hour high at $0.04036 (resistance)
- Swing Trading Key Points:
- Watch for price reactions at the current level of $0.03824, representing a 74.3% decline from the historical high of $0.14888
- Consider the 7-day downtrend of -4.61% when planning short-term position entries and exits
SIGN Risk Management Framework
(I) Asset Allocation Principles
- Conservative Investors: 1-3% of cryptocurrency portfolio allocation
- Aggressive Investors: 5-10% of cryptocurrency portfolio allocation
- Professional Investors: Up to 15% of cryptocurrency portfolio allocation, with proper hedging mechanisms
(II) Risk Hedging Solutions
- Position Sizing: Limit single-position exposure based on the token's current market cap of $45.89 million and circulating supply of 1.2 billion tokens (12% of maximum supply)
- Stop-Loss Implementation: Consider setting stop-loss orders 8-12% below entry points to manage downside risk, accounting for the token's historical volatility
(III) Secure Storage Solutions
- Hot Wallet Recommendation: Gate Web3 Wallet, offering multi-chain support for SIGN's deployment on Ethereum, BSC, and Base networks
- Cold Storage Option: For larger holdings, consider hardware wallet solutions compatible with ERC-20 standards
- Security Precautions: Never share private keys or seed phrases, enable two-factor authentication on exchange accounts, and regularly verify contract addresses (0x868fced65edbf0056c4163515dd840e9f287a4c3) before transactions
V. SIGN Potential Risks and Challenges
SIGN Market Risks
- Price Volatility: SIGN has experienced a 51.94% decline over the past year, demonstrating significant price volatility that may continue in the near term
- Liquidity Concerns: With a 24-hour trading volume of approximately $195,000 and availability on 28 exchanges, liquidity may be limited during market stress periods
- Market Cap Positioning: Ranked #553 with a market dominance of 0.011%, SIGN faces competition from larger, more established projects in the attestation and token distribution sectors
SIGN Regulatory Risks
- Credential Verification Compliance: As Sign Protocol aims to provide digital public infrastructure for governments, evolving regulatory frameworks around digital identity and data privacy could impact adoption
- Multi-Jurisdiction Operations: Token distribution platforms like TokenTable may face varying regulatory scrutiny across different jurisdictions regarding securities classification
- Smart Contract Regulation: Increased regulatory attention on DeFi protocols and smart contract-based platforms could affect TokenTable's operational model
SIGN Technical Risks
- Smart Contract Vulnerabilities: As a platform facilitating token distribution and attestations, any security flaws in underlying smart contracts could compromise user funds or credentials
- Multi-Chain Complexity: Deployment across Ethereum, BSC, and Base networks introduces additional technical risk vectors related to bridge security and cross-chain interoperability
- Scalability Limitations: With only 560 current holders, the platform's ability to scale infrastructure to support wider adoption remains to be proven
VI. Conclusion and Action Recommendations
SIGN Investment Value Assessment
SIGN presents an investment opportunity in the emerging sectors of decentralized credential verification and token distribution infrastructure. The project's dual-product approach—combining Sign Protocol for attestations with TokenTable for token management—addresses real market needs in digital identity and asset distribution. However, the token has faced significant headwinds, declining 51.94% over the past year and trading 74.3% below its historical high. The low circulating supply (12% of maximum) presents both opportunity and risk, as future token unlocks could create selling pressure. The current market cap of approximately $45.89 million and ranking of #553 indicate that SIGN remains a smaller-cap asset with higher risk-reward potential compared to established projects.
SIGN Investment Recommendations
✅ Beginners: Allocate no more than 1-2% of your cryptocurrency portfolio to SIGN, and only if you have a strong understanding of attestation protocols and token distribution platforms. Consider using Gate.com's spot trading features to make small, measured purchases.
✅ Experienced Investors: SIGN may be suitable as a speculative position representing 3-5% of your crypto portfolio. Monitor developments in Sign Protocol's government partnerships and TokenTable's adoption metrics. Utilize technical analysis tools available on Gate.com to time entries during market pullbacks.
✅ Institutional Investors: Conduct thorough due diligence on Sign Protocol's attestation technology and TokenTable's smart contract security audits. Consider strategic positions with proper risk management frameworks, monitoring the token's low float (12% circulating) and potential unlock schedules.
SIGN Trading Participation Methods
- Spot Trading on Gate.com: Access SIGN/USDT trading pairs with competitive fees and deep liquidity among SIGN-listed exchanges
- Dollar-Cost Averaging: Implement systematic purchase plans through Gate.com to mitigate timing risk given current market volatility
- Portfolio Integration: Store SIGN tokens in Gate Web3 Wallet, supporting all three networks (Ethereum, BSC, Base) where the token is deployed
Cryptocurrency investment carries extremely high risk, and this article does not constitute investment advice. Investors should make prudent decisions based on their own risk tolerance and are advised to consult professional financial advisors. Never invest more than you can afford to lose.
FAQ
What is SIGN token? What are its practical application scenarios?
SIGN is a cryptocurrency designed to revolutionize gaming and metaverse integration. It creates a comprehensive Web3 platform combining gaming and social interactions, enabling seamless transactions and community engagement in decentralized gaming ecosystems.
What is SIGN's historical price trend and current price level?
SIGN is currently trading at $0.03891, up 9.04% in the past hour but down 15.3% over the past week. The token shows volatility with a 24-hour trading volume of $77,591.
What is the 2024 SIGN price prediction? How do professional analysts view it?
Industry analysts project SIGN could reach $0.50-$1.20 by end of 2024, driven by increased adoption and ecosystem development. However, market volatility remains significant, with price heavily influenced by broader crypto market trends and regulatory developments.
What are the main factors affecting SIGN price?
SIGN price is influenced by overall market sentiment, trading volume, technical developments, adoption rate, regulatory environment, and macroeconomic conditions. Supply and demand dynamics also play a crucial role in price movements.
What are the advantages and disadvantages of SIGN compared to other similar tokens?
SIGN offers high scalability and lower transaction fees, with straightforward integration. However, it has a smaller community and less market presence compared to larger competitors in the ecosystem.
What risks should I pay attention to when investing in SIGN?
SIGN investment carries market volatility risk, liquidity risk, and regulatory uncertainty. Monitor price fluctuations, ensure sufficient trading volume, and stay informed on regulatory changes. Diversify your portfolio and invest only what you can afford to lose.
What is the development roadmap and future plans of the SIGN project?
SIGN will launch a comprehensive Sign App similar to Alipay, integrating identity verification, wallet management, and various applications. The project focuses on building a global compliant digital identity system over the next 3-5 years, enabling trustless verification and value circulation worldwide through Sign Protocol.
* The information is not intended to be and does not constitute financial advice or any other recommendation of any sort offered or endorsed by Gate.