This comprehensive analysis examines SLICE (Tranche Finance) token price dynamics and investment opportunities through 2031. SLICE, a decentralized protocol for loan issuance and securitization, currently trades at $0.009837 with a market cap of $171,354. The article evaluates historical price trends since 2021, identifies core market drivers including supply mechanisms and macroeconomic factors, and provides price forecasts ranging from $0.00787-$0.01161 (2026) to $0.01204-$0.02266 (2031). Designed for investors ranging from beginners to institutions, the guide offers practical long-term holding and active trading strategies via Gate.com, comprehensive risk management frameworks, and critical risk assessment regarding liquidity constraints and regulatory challenges. Suitable for understanding DeFi token valuation fundamentals and developing informed investment decisions in the securitization sector.
Introduction: SLICE's Market Position and Investment Value
Tranche Finance (SLICE), as a decentralized protocol for loan issuance and securitization, has been facilitating on-chain asset creation equivalent to collateralized debt obligations (CDOs) since its launch in 2021. As of 2026, SLICE maintains a market capitalization of approximately $171,354, with a circulating supply of around 17.42 million tokens, and the price stabilizing near $0.009837. This asset, designed to unify incentive mechanisms among token holders, development teams, and platform users, is playing an increasingly important role in decentralized finance lending and asset management.
This article will comprehensively analyze SLICE's price trends from 2026 to 2031, combining historical patterns, market supply and demand dynamics, ecosystem development, and macroeconomic conditions to provide investors with professional price forecasts and practical investment strategies.
I. SLICE Price History Review and Market Status
SLICE Historical Price Evolution Trajectory
- 2021: Token launched in March, reaching a peak price of $1.79 on March 1st, marking its historical high point during the early development phase
- 2021-2025: Following the initial launch period, the token experienced a sustained downward trend, with price declining significantly from the March 2021 peak
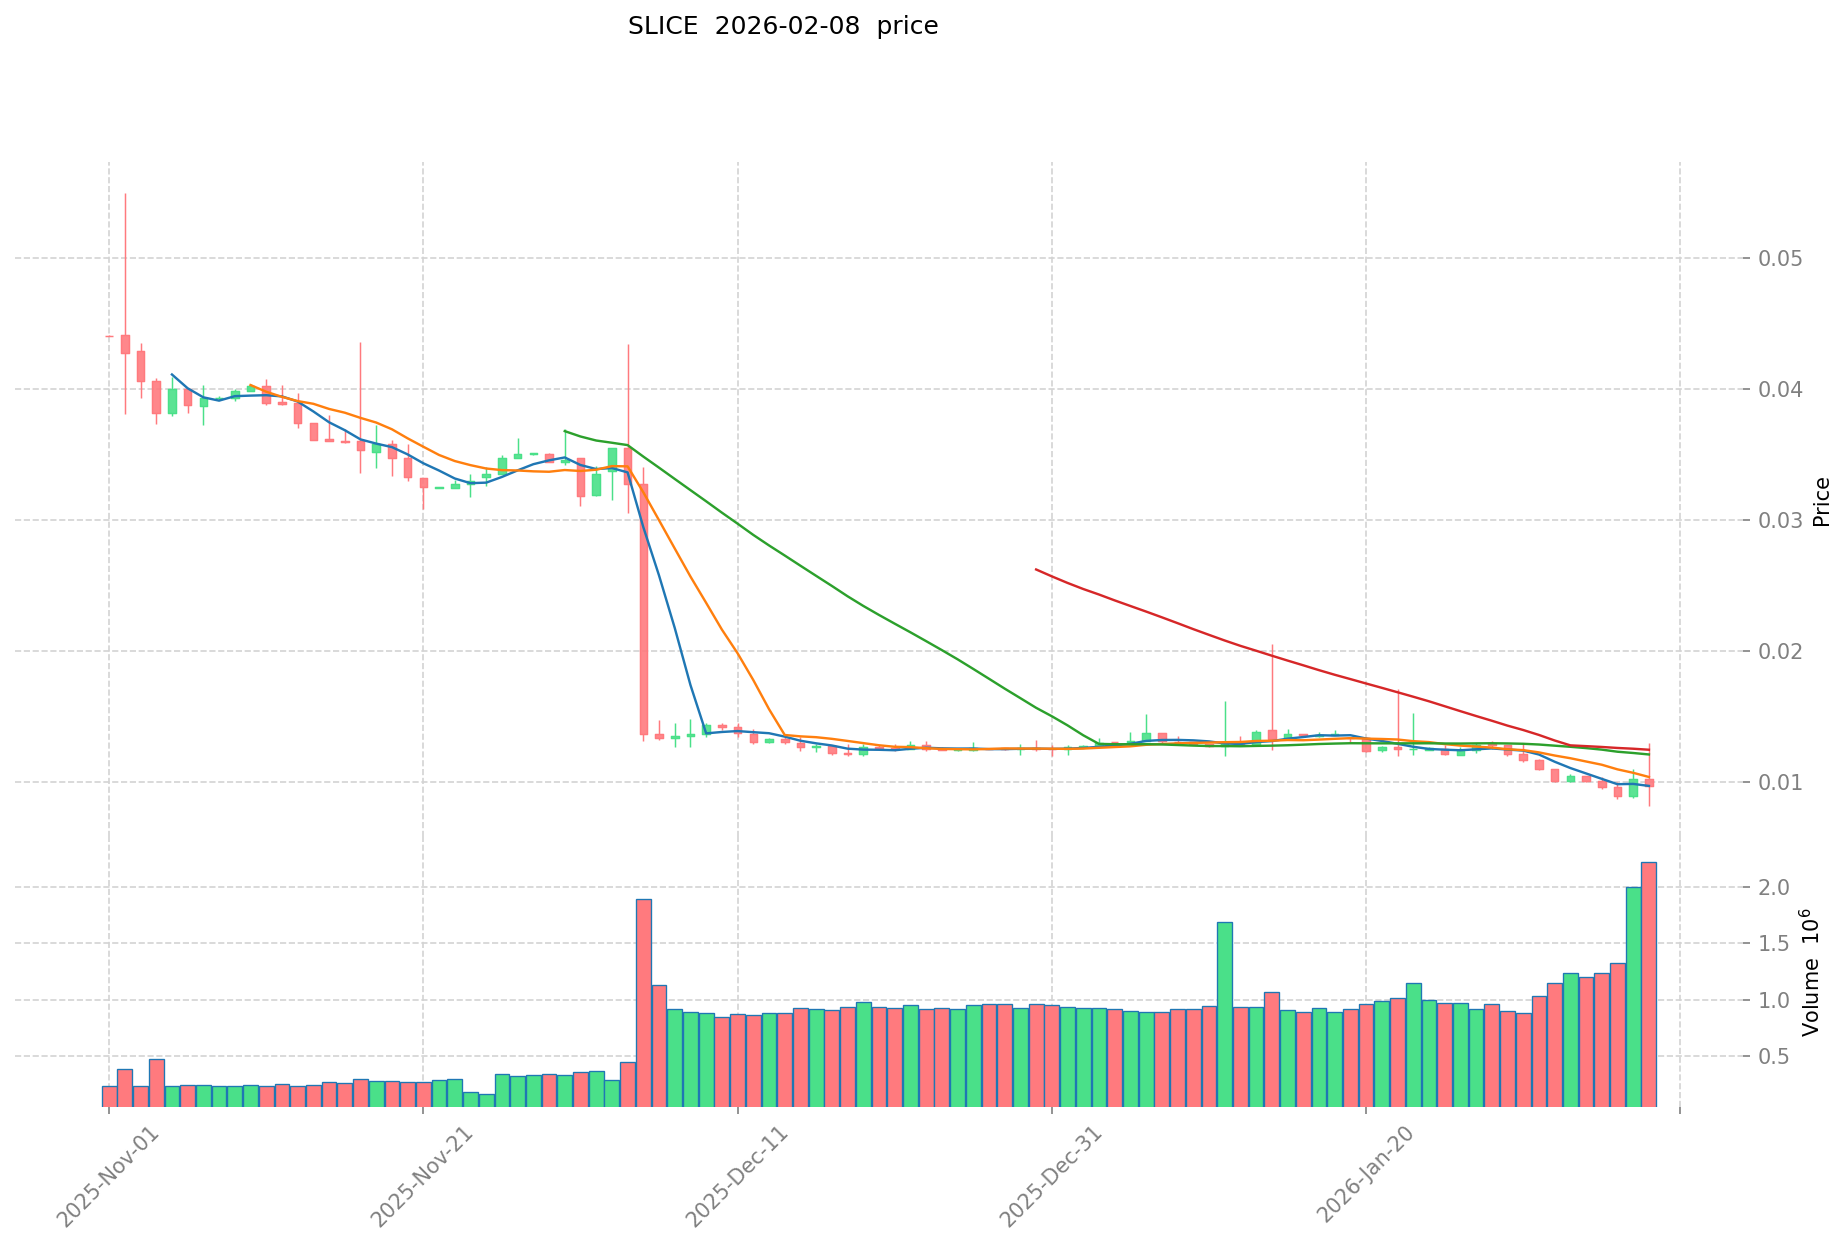
- 2026: On February 7th, the token reached its historical low of $0.00842264, reflecting a substantial correction from previous levels
SLICE Current Market Status
As of February 9, 2026, SLICE is trading at $0.009837, showing a modest 24-hour increase of 1.04%. The token's intraday range spans from $0.009208 to $0.01023. Short-term momentum indicators reveal a 0.21% gain over the past hour, while the 7-day performance shows a decline of 3.84%.
The broader timeframe analysis indicates more pronounced downward pressure, with a 30-day decrease of 23.79% and a one-year decline of 65.12%. The current trading volume stands at $8,773.68, with market capitalization at approximately $171,354.
Circulating supply accounts for 87.1% of the maximum supply, with 17,419,343 SLICE tokens currently in circulation out of a maximum supply of 20,000,000 tokens. The token maintains a market cap to fully diluted valuation ratio of 87.1%, with market dominance at 0.0000078%. The project is held by 3,849 addresses and is available for trading on Gate.com.
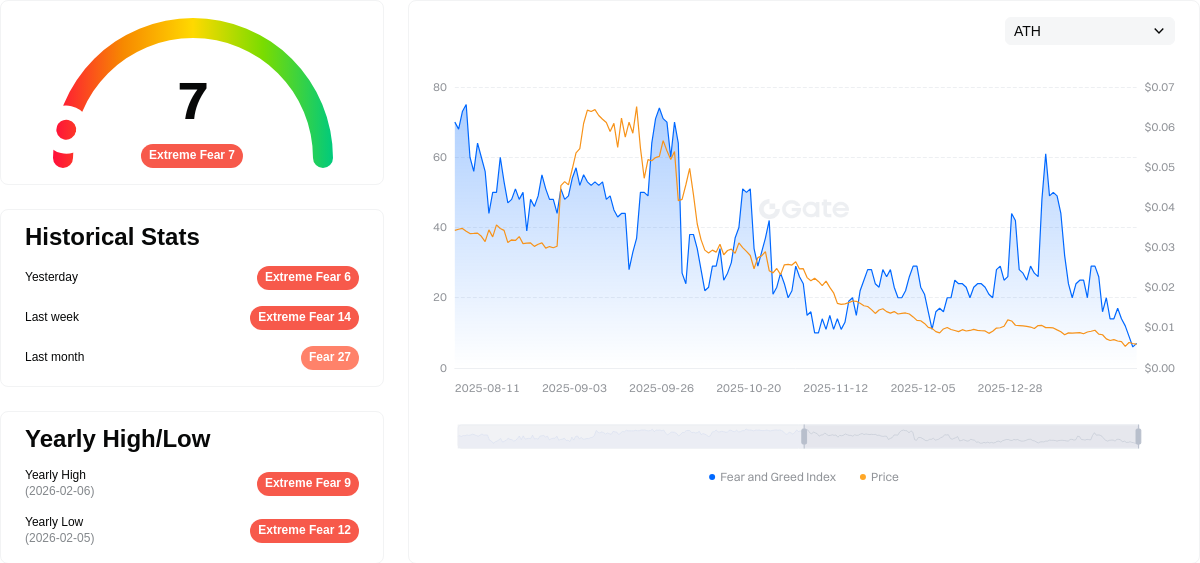
The current market sentiment index registers at 7, indicating extreme fear conditions in the broader cryptocurrency market.
Click to view current SLICE market price
SLICE Market Sentiment Index
2026-02-08 Fear and Greed Index: 7 (Extreme Fear)
Click to view current Fear & Greed Index
The cryptocurrency market is currently experiencing extreme fear, with the Fear and Greed Index hitting 7. This indicates severe market pessimism and heightened investor anxiety. During periods of extreme fear, market volatility typically intensifies as panic selling dominates trading activity. Historically, such extreme readings often present contrarian opportunities for long-term investors, as excessive fear can lead to temporary overshooting on the downside. Traders should exercise caution and consider their risk tolerance carefully before making trading decisions in such volatile conditions.
SLICE Holding Distribution
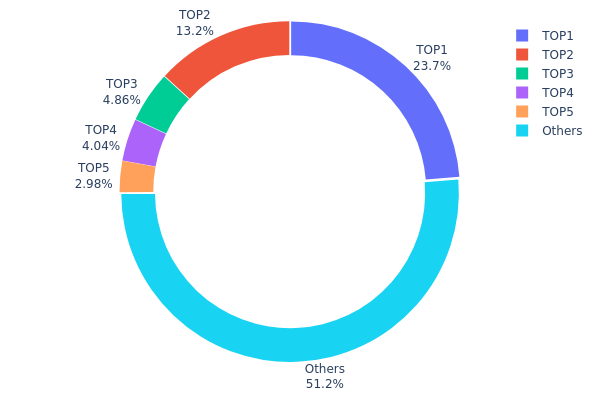
The holding distribution chart reflects the allocation of SLICE tokens across different wallet addresses, serving as a critical indicator of token concentration and decentralization level within the ecosystem. By analyzing the proportion held by top addresses versus the broader community, we can assess potential risks related to price manipulation and evaluate the overall health of the token's distribution structure.
According to the latest on-chain data, the top holder controls approximately 4.74 million SLICE tokens, accounting for 23.71% of the total supply. The second-largest address holds 2.64 million tokens (13.19%), while the third through fifth positions hold 4.86%, 4.03%, and 2.98% respectively. Collectively, the top five addresses control 48.77% of the circulating supply, with the remaining 51.23% distributed among other holders. This concentration pattern reveals a moderately centralized holding structure, where nearly half of the token supply is controlled by a small group of major holders.
This level of concentration presents both structural advantages and potential risks for the SLICE market. On one hand, the presence of large holders may indicate strong conviction from early investors or strategic partners, potentially providing price stability during market volatility. On the other hand, such concentration creates vulnerability to significant selling pressure if major holders decide to liquidate their positions, which could trigger sharp price movements and increased volatility. The current distribution suggests that SLICE's market structure remains susceptible to the actions of its largest stakeholders, and investors should monitor whale activity closely when making trading decisions.
Click to view the current SLICE Holding Distribution
| Top |
Address |
Holding Qty |
Holding (%) |
| 1 |
0xa21e...49ea1e |
4743.33K |
23.71% |
| 2 |
0xab42...3ca45a |
2639.33K |
13.19% |
| 3 |
0x896e...294ee8 |
972.67K |
4.86% |
| 4 |
0x5e62...195dbb |
807.74K |
4.03% |
| 5 |
0x0ba4...c39261 |
596.59K |
2.98% |
| - |
Others |
10240.34K |
51.23% |
II. Core Factors Influencing SLICE's Future Price
Supply Mechanism
- Silicon Material Cost Dynamics: Silicon material price remains the primary cost driver for slice production. Recent market data indicates silicon material prices have approached cost lines, potentially triggering price support behavior from downstream manufacturers.
- Historical Patterns: Silicon material price fluctuations historically demonstrate high correlation with slice pricing. When raw material costs decline, slice manufacturers typically experience margin compression, leading to corresponding price adjustments.
- Current Impact: Supply-side cost pressures continue to influence slice pricing trends. Equipment quality, diamond wire technology, and cutting processes collectively determine output efficiency, indirectly affecting supply dynamics and market equilibrium.
Market Demand and Supply Chain
- Demand Dynamics: Market demand patterns significantly impact slice price trajectories. Downstream consumption levels and inventory adjustments create short-term price volatility.
- Supply Chain Status: Supply chain stability affects production continuity and delivery schedules. Disruptions in component availability or logistics can create temporary supply constraints.
- Technology Progress: Advancements in cutting equipment, diamond wire quality, and process optimization continue to improve production efficiency, potentially moderating cost structures over time.
Macroeconomic Environment
- Economic Indicators: Broader economic conditions including GDP growth rates influence industrial demand and investment sentiment in the semiconductor and solar sectors.
- Market Sentiment: Investor confidence and trading activity respond to economic data releases, policy announcements, and industry developments.
- International Dynamics: Global trade conditions and regional market developments affect supply chain configurations and demand distribution patterns.
Technology Development and Ecosystem
- Process Innovation: Ongoing improvements in slicing technology enhance material utilization rates and reduce waste, contributing to cost efficiency gains.
- Equipment Advancement: Next-generation cutting equipment with improved precision and automation capabilities supports higher throughput and quality standards.
- Application Expansion: Growing adoption across semiconductor manufacturing and photovoltaic cell production drives sustained demand for high-quality silicon slices.
III. 2026-2031 SLICE Price Forecast
2026 Outlook
- Conservative estimate: $0.00787 - $0.00984
- Neutral estimate: $0.00984 (average trading range)
- Optimistic estimate: $0.01161 (requires favorable market conditions and increased adoption)
2027-2029 Mid-term Outlook
- Market stage expectation: Gradual growth phase with increasing volatility as the project matures and market recognition expands
- Price range forecast:
- 2027: $0.00547 - $0.01319, representing approximately 9% year-over-year growth
- 2028: $0.00861 - $0.01363, with potential 21% increase from baseline
- 2029: $0.00985 - $0.01599, showing continued upward momentum with 30% growth trajectory
- Key catalysts: Market sentiment shifts, potential protocol upgrades, broader cryptocurrency market cycles, and increased trading volume on platforms such as Gate.com
2030-2031 Long-term Outlook
- Baseline scenario: $0.00734 - $0.02101 (assuming steady market development and maintained project fundamentals)
- Optimistic scenario: $0.01439 - $0.02266 (contingent upon significant ecosystem expansion and sustained bull market conditions)
- Transformative scenario: Approaching $0.02266 upper range (requires exceptional adoption rates, major partnership announcements, and highly favorable regulatory environment)
- 2026-02-09: SLICE trading within established range as market participants assess long-term value proposition and technical developments
| Year |
Predicted High Price |
Predicted Average Price |
Predicted Low Price |
Price Change |
| 2026 |
0.01161 |
0.00984 |
0.00787 |
0 |
| 2027 |
0.01319 |
0.01072 |
0.00547 |
9 |
| 2028 |
0.01363 |
0.01196 |
0.00861 |
21 |
| 2029 |
0.01599 |
0.01279 |
0.00985 |
30 |
| 2030 |
0.02101 |
0.01439 |
0.00734 |
46 |
| 2031 |
0.02266 |
0.0177 |
0.01204 |
79 |
IV. SLICE Professional Investment Strategy and Risk Management
SLICE Investment Methodology
(I) Long-term Holding Strategy
- Suitable for: Investors who believe in DeFi infrastructure development and decentralized securitization protocols
- Operational Recommendations:
- Establish positions gradually during market downturns, with SLICE currently trading near recent lows at $0.009837
- Consider dollar-cost averaging to mitigate volatility risk, particularly given the token's 65.12% decline over the past year
- Storage Solution: Use Gate Web3 Wallet for secure long-term custody, with multi-signature options for larger holdings
(II) Active Trading Strategy
- Technical Analysis Tools:
- Volume Analysis: Monitor 24-hour trading volume ($8,773.68), as low liquidity may create volatility opportunities
- Support/Resistance Levels: Key support near $0.00842264 (recent low), resistance at $0.01023 (24h high)
- Swing Trading Key Points:
- Watch for volatility around the 24h range of $0.009208-$0.01023, representing approximately 8.9% potential swing
- Set stop-loss orders given the token's historical volatility, with careful attention to limited exchange availability
SLICE Risk Management Framework
(I) Asset Allocation Principles
- Conservative Investors: 1-2% of crypto portfolio allocation
- Aggressive Investors: 3-5% of crypto portfolio allocation
- Professional Investors: Up to 7% with active hedging strategies
(II) Risk Hedging Solutions
- Position Sizing: Limit exposure due to low market capitalization ($171,354) and limited exchange listings (only 1 exchange)
- Diversification Strategy: Combine with established DeFi blue-chips to offset concentrated risk in lower-cap tokens
(III) Secure Storage Solutions
- Hot Wallet Recommendation: Gate Web3 Wallet for active trading and staking participation
- Cold Storage Solution: Hardware wallet storage for holdings exceeding $5,000 equivalent
- Security Precautions: Verify contract address (0x0AeE8703D34DD9aE107386d3eFF22AE75Dd616D1 on Ethereum) before any transactions, be aware of potential phishing risks with lower-profile tokens
V. SLICE Potential Risks and Challenges
SLICE Market Risks
- Liquidity Risk: With only $8,773.68 in 24-hour trading volume and availability on 1 exchange, entering or exiting positions may result in significant slippage
- Volatility Risk: The token has experienced a 65.12% decline over one year and 23.79% drop in the past month, indicating sustained bearish pressure
- Market Cap Risk: With a market capitalization of approximately $171,354, SLICE ranks 4,131 by market cap, suggesting limited institutional interest and higher susceptibility to manipulation
SLICE Regulatory Risks
- Securitization Protocol Scrutiny: As a platform for creating CDO-equivalent on-chain assets, Tranche Finance may face regulatory examination regarding securities laws compliance
- Token Migration Risk: The transition from JNT (Jibrel Network Token) to SLICE may create regulatory uncertainty regarding token classification
- DeFi Regulation: Evolving global frameworks for decentralized finance protocols could impact platform operations and token utility
SLICE Technical Risks
- Smart Contract Risk: The protocol's securitization mechanism involves complex smart contracts that may contain vulnerabilities
- Ethereum Network Dependency: As an ERC-20 token, SLICE is subject to Ethereum network congestion and gas fee fluctuations
- Platform Adoption Risk: With 3,849 holders and limited trading activity, the protocol faces challenges in achieving meaningful traction in the competitive DeFi lending space
VI. Conclusion and Action Recommendations
SLICE Investment Value Assessment
SLICE presents a high-risk, speculative opportunity in the DeFi securitization sector. While the protocol's CDO-equivalent mechanism offers innovative functionality, significant concerns exist around liquidity constraints, sustained price decline, and limited adoption. The token's 87.1% market cap to fully diluted valuation ratio suggests minimal overhang risk, but extremely low trading volumes and single-exchange availability create substantial execution challenges. Long-term value depends heavily on successful platform development and user acquisition in a competitive lending market.
SLICE Investment Recommendations
✅ Beginners: Avoid SLICE investment due to extreme volatility, low liquidity, and high technical complexity. Focus on established cryptocurrencies before considering micro-cap DeFi tokens
✅ Experienced Investors: Consider only as a high-risk speculative allocation (under 2% of portfolio), with strict stop-loss parameters given the 65% annual decline
✅ Institutional Investors: Conduct thorough due diligence on protocol mechanics and token economics before any allocation, with particular attention to liquidity risk management
SLICE Trading Participation Methods
- Spot Trading: Available on Gate.com with SLICE trading pairs
- Liquidity Provision: Participate in Uniswap liquidity pools (SLICE-ETH and SLICE-DAI pairs) for potential yield generation, though with impermanent loss considerations
- Long-term Accumulation: For believers in decentralized securitization, consider gradual accumulation during price weakness with extended holding horizons
Cryptocurrency investment carries extremely high risk, and this article does not constitute investment advice. Investors should make prudent decisions based on their own risk tolerance and are advised to consult professional financial advisors. Never invest more than you can afford to lose.
FAQ
What is SLICE token? What are its basic functions and use cases?
SLICE is a blockchain-based digital asset and ERC-20 token designed for payments and decentralized finance(DeFi)applications. It serves as a utility token within the DeFi ecosystem, enabling transactions and protocol interactions across the blockchain network.
What are the main factors affecting SLICE price?
SLICE price is primarily driven by market demand, trading volume, ecosystem development, tokenomics, and broader crypto market sentiment. Technical upgrades and adoption growth also significantly influence price movements.
How to analyze and predict SLICE's future price trends?
Analyze SLICE price by monitoring trading volume, market sentiment, and ecosystem developments. Historical trends show growth potential, but high volatility exists. Track key metrics like adoption rates, technical indicators, and broader crypto market conditions for informed predictions.
SLICE price prediction exists what risks and limitations?
SLICE price predictions face market liquidity constraints and execution risks, potentially causing wider spreads and slower transaction speeds. Prediction accuracy is affected by market sentiment and unexpected events. Incomplete data may limit forecasting precision.
What are the advantages and disadvantages of SLICE compared to similar tokens?
SLICE offers strong transparency and security through its immutable blockchain foundation. However, it may face scalability challenges compared to some competitors. Its decentralized structure ensures trust, though transaction speeds could be slower than certain alternatives.
* The information is not intended to be and does not constitute financial advice or any other recommendation of any sort offered or endorsed by Gate.