This comprehensive analysis examines Solv Protocol (SOLV), a leading Bitcoin staking protocol revolutionizing Bitcoin-centric DeFi ecosystems. Trading at $0.0131 as of January 2026 with a $19.42 million market cap, SOLV has recovered from an October 2025 low following significant early volatility. The article evaluates price trajectories through 2031, analyzing historical performance, token distribution showing 75.11% concentration in top 5 addresses, and market sentiment currently at extreme fear levels. Expert analysis projects 2026 price ranges from $0.00877 to $0.01571, with longer-term scenarios reaching $0.03348 by 2031 under favorable conditions. Strategic recommendations include long-term holding for protocol believers, active trading leveraging technical indicators, and risk management through diversification. Critical considerations encompass regulatory uncertainties in Bitcoin staking, smart contract vulnerabilities, and limited circulation with 15.35% supply in circulation. Available on Gate and 3
Introduction: SOLV's Market Position and Investment Value
Solv Protocol (SOLV), as a leading Bitcoin staking protocol building a thriving Bitcoin-centric financial ecosystem, has been actively unlocking liquidity and maximizing the utility of idle Bitcoin assets since its inception. As of January 2026, SOLV has established a market capitalization of approximately $19.42 million, with a circulating supply of around 1.48 billion tokens, and maintains a price level near $0.0131. This asset, recognized for its innovative approach to Bitcoin liquidity solutions, is playing an increasingly vital role in the decentralized finance sector, particularly in Bitcoin staking and liquidity management.
This article will comprehensively analyze SOLV's price trajectory from 2026 to 2031, combining historical patterns, market supply and demand dynamics, ecosystem development, and macroeconomic environments to provide investors with professional price forecasts and practical investment strategies.
I. SOLV Price History Review and Current Market Status
SOLV Historical Price Evolution Trajectory
- January 2025: SOLV launched at an initial price of $0.03 on January 16, 2025, reaching an all-time high of $0.1737 on January 17, 2025, representing a significant surge in its early trading days
- 2025 Mid-Year: Following the initial peak, the token experienced substantial volatility, with price movements reflecting broader market dynamics and protocol adoption phases
- October 2025: The token reached its all-time low of $0.00278 on October 10, 2025, marking a decline of approximately 98.4% from its peak, reflecting a challenging market environment
SOLV Current Market Status
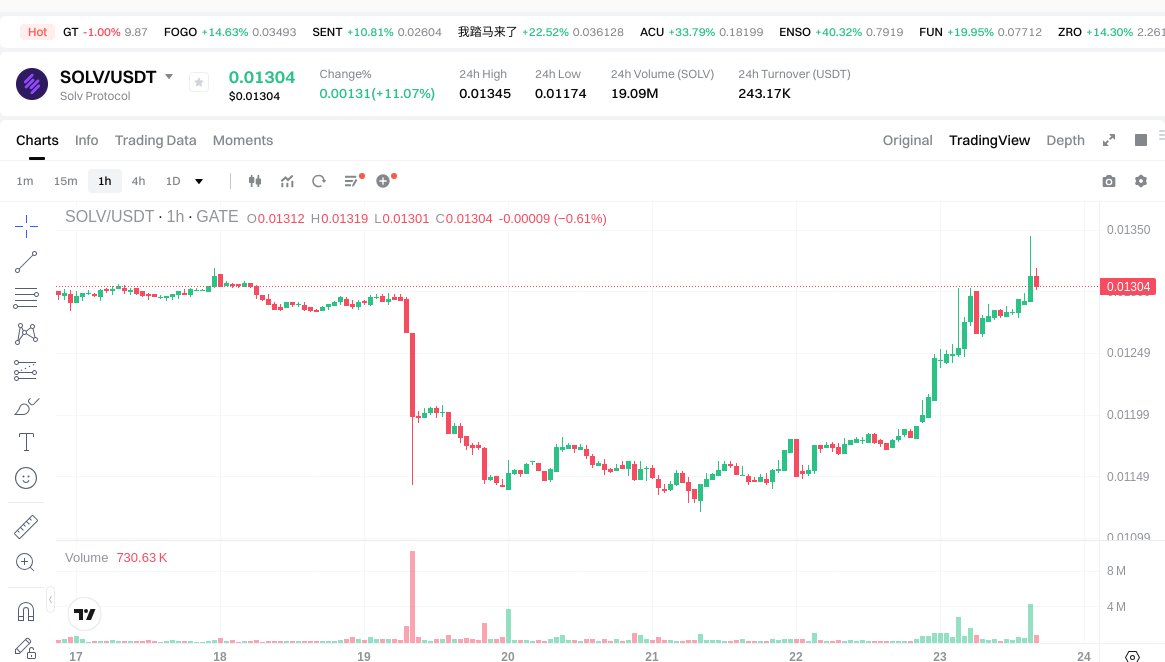
As of January 23, 2026, SOLV is trading at $0.0131, demonstrating an 11.56% increase over the past 24 hours. The token has shown recent volatility with a 24-hour trading range between $0.01174 and $0.01345. Over the past hour, the price declined by 0.53%, while the 7-day performance shows a modest decrease of 0.15%.
The 30-day trend indicates a 9.08% decline, and the annual performance reflects an 82.6% decrease from its price level one year prior. The current price represents a 92.5% decline from its all-time high of $0.1737 recorded in January 2025.
SOLV maintains a market capitalization of approximately $19.42 million, with a circulating supply of 1.48 billion tokens out of a maximum supply of 9.66 billion tokens, representing a circulation ratio of 15.35%. The fully diluted market cap stands at $126.55 million. The token's market dominance is 0.0040%, ranking 896th in the cryptocurrency market.
The 24-hour trading volume reached $240,035.80, distributed across 33 exchanges. The token has attracted 127,466 holders, indicating a growing community base. The current market sentiment index stands at 24, classified as "Extreme Fear," reflecting cautious investor sentiment in the broader cryptocurrency market.
SOLV operates on the BSC network using the BEP-20 standard, with its contract address verified at 0xabe8e5cabe24cb36df9540088fd7ce1175b9bc52.
Click to view the current SOLV market price
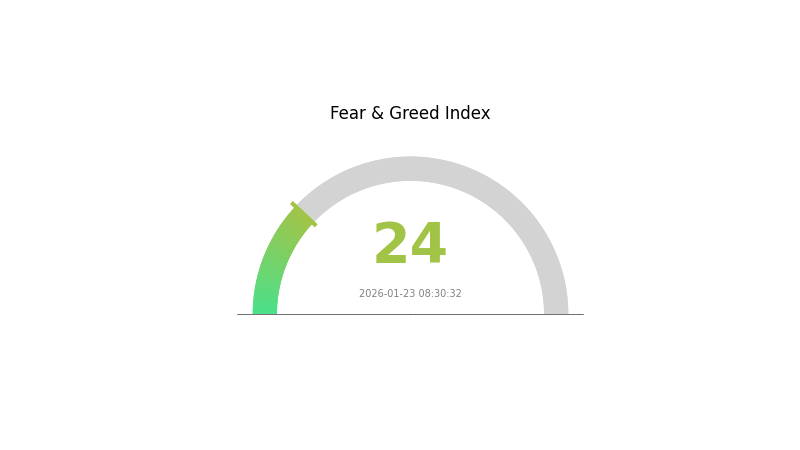
SOLV Market Sentiment Indicator
2026-01-23 Fear & Greed Index: 24 (Extreme Fear)
Click to view current Fear & Greed Index
The SOLV market is currently experiencing extreme fear sentiment, with the Fear & Greed Index standing at 24. This indicates heightened market anxiety and pessimistic investor outlook. During periods of extreme fear, risk-averse traders often reduce positions, while opportunistic investors may consider accumulating at depressed price levels. Market participants should remain cautious and conduct thorough analysis before making investment decisions. Monitor index fluctuations closely for potential reversal signals and market turning points.
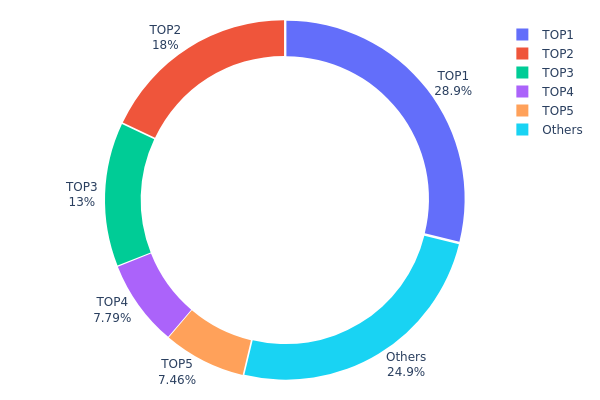
SOLV Holding Distribution
The holding distribution chart illustrates the concentration of SOLV tokens across different wallet addresses, providing insights into the decentralization level and potential market dynamics. According to the latest data, the top 5 addresses collectively hold approximately 75.11% of the total supply, with the largest holder controlling 28.86% (2,424,240K tokens), followed by the second and third addresses holding 18.00% and 13.00% respectively.
This distribution pattern reveals a relatively high concentration risk in SOLV's current market structure. The dominance of top holders, particularly with nearly half of the supply (46.86%) concentrated in just the top two addresses, suggests potential vulnerability to large-scale selling pressure or coordinated market manipulation. The remaining addresses categorized as "Others" account for only 24.89% of the supply, indicating limited distribution among smaller holders and retail participants.
Such concentrated holding patterns typically correlate with increased price volatility and reduced market depth, as large holders possess significant influence over price movements through their trading decisions. While this concentration may reflect strategic partnerships, treasury reserves, or early investor allocations, it also signals a market structure that has yet to achieve broad-based distribution. The current on-chain architecture indicates that SOLV is in a relatively early stage of ecosystem development, where token distribution remains skewed toward major stakeholders rather than achieving the more decentralized profile typically associated with mature blockchain projects.
Click to view current SOLV Holding Distribution
| Top |
Address |
Holding Qty |
Holding (%) |
| 1 |
0xbf1f...b44ca0 |
2424240.00K |
28.86% |
| 2 |
0x82b3...a61c5f |
1512000.00K |
18.00% |
| 3 |
0x07ea...0b8205 |
1092000.00K |
13.00% |
| 4 |
0xa354...e254ef |
654360.00K |
7.79% |
| 5 |
0x5a52...70efcb |
626990.43K |
7.46% |
| - |
Others |
2090409.57K |
24.89% |
II. Core Factors Influencing SOLV's Future Price
Due to the lack of available data in the provided materials regarding SOLV's supply mechanisms, institutional dynamics, macroeconomic factors, and technical developments, a comprehensive analysis cannot be completed at this time. Market participants should monitor official announcements and verified data sources for updates on these fundamental factors that typically influence cryptocurrency valuations.
For the latest information on SOLV, users may visit Gate.com to access real-time market data and trading opportunities.
III. 2026-2031 SOLV Price Prediction
2026 Outlook
- Conservative forecast: $0.00877 - $0.01309
- Neutral forecast: Around $0.01309
- Optimistic forecast: Up to $0.01571 (requires favorable market conditions)
2027-2029 Outlook
- Market stage expectation: The token may enter a gradual growth phase, with prices showing moderate upward momentum as the project ecosystem develops and market recognition increases.
- Price range forecast:
- 2027: $0.0085 - $0.018
- 2028: $0.01021 - $0.01911
- 2029: $0.01024 - $0.02472
- Key catalysts: Project ecosystem expansion, increased adoption rates, and potential technological upgrades could serve as primary drivers for price appreciation during this period.
2030-2031 Long-term Outlook
- Baseline scenario: $0.01229 - $0.02119 (assumes steady market development and sustained project growth)
- Optimistic scenario: $0.01982 - $0.02437 (assumes accelerated ecosystem expansion and broader market adoption)
- Transformative scenario: Up to $0.03348 (requires exceptional favorable conditions including significant institutional adoption and major protocol breakthroughs)
- 2026-01-23: SOLV shows stable positioning with average price around $0.01309 (early development stage)
| Year |
Predicted High Price |
Predicted Average Price |
Predicted Low Price |
Price Change |
| 2026 |
0.01571 |
0.01309 |
0.00877 |
0 |
| 2027 |
0.018 |
0.0144 |
0.0085 |
9 |
| 2028 |
0.01911 |
0.0162 |
0.01021 |
23 |
| 2029 |
0.02472 |
0.01766 |
0.01024 |
34 |
| 2030 |
0.02437 |
0.02119 |
0.01229 |
61 |
| 2031 |
0.03348 |
0.02278 |
0.01982 |
73 |
IV. SOLV Professional Investment Strategies and Risk Management
SOLV Investment Methodology
(1) Long-term Holding Strategy
- Target Investors: Investors seeking exposure to Bitcoin-centric DeFi ecosystems with a focus on staking protocols
- Operational Recommendations:
- Consider accumulating SOLV during market corrections when price volatility presents opportunities
- Monitor the protocol's Total Value Locked (TVL) and Bitcoin staking adoption metrics as fundamental indicators
- Implement a storage solution using Gate Web3 Wallet for secure asset custody with multi-signature protection
(2) Active Trading Strategy
- Technical Analysis Tools:
- Moving Averages: Track 20-day and 50-day MAs to identify trend reversals; recent 24-hour price increase of 11.56% suggests short-term momentum
- Volume Analysis: Current 24-hour trading volume of approximately $240,036 should be monitored for breakout confirmation
- Swing Trading Points:
- Establish support levels near the 24-hour low of $0.01174 and resistance at $0.01345
- Consider the significant decline from ATH of $0.1737 (reached January 2025) when evaluating retracement opportunities
SOLV Risk Management Framework
(1) Asset Allocation Principles
- Conservative Investors: 2-5% of crypto portfolio allocation
- Aggressive Investors: 10-15% of crypto portfolio allocation
- Professional Investors: Up to 20% with active hedging strategies
(2) Risk Hedging Solutions
- Portfolio Diversification: Balance SOLV exposure with established assets like BTC and ETH
- Position Sizing: Limit single trade exposure to no more than 2-3% of total capital given the token's volatility profile
(3) Secure Storage Solutions
- Hot Wallet Recommendation: Gate Web3 Wallet for active trading with enhanced security features
- Cold Storage Solution: Hardware wallet integration for long-term holdings exceeding $10,000
- Security Precautions: Enable two-factor authentication, regularly backup private keys, and avoid sharing wallet credentials on public networks
V. SOLV Potential Risks and Challenges
SOLV Market Risks
- High Volatility: The token has experienced an 82.6% decline over the past year, indicating significant price instability
- Limited Circulation: With only 15.35% of total supply in circulation (1.48B out of 9.66B tokens), future token unlocks may create selling pressure
- Liquidity Concerns: Listed on 33 exchanges with moderate 24-hour volume, potential for slippage during large transactions
SOLV Regulatory Risks
- Bitcoin Staking Regulation: Evolving regulatory frameworks for Bitcoin staking products may impact protocol operations
- Securities Classification: Potential regulatory scrutiny regarding token classification as securities in certain jurisdictions
- Compliance Requirements: Cross-border operational challenges as global crypto regulations continue to develop
SOLV Technical Risks
- Smart Contract Vulnerabilities: DeFi protocols face inherent risks of code exploits despite security audits
- Protocol Dependency: Heavy reliance on Bitcoin network infrastructure and Layer 2 scaling solutions
- Competition: Emerging Bitcoin staking protocols may challenge Solv's market position in the Bitcoin DeFi ecosystem
VI. Conclusion and Action Recommendations
SOLV Investment Value Assessment
Solv Protocol presents an innovative approach to unlocking Bitcoin liquidity through staking mechanisms, addressing a significant gap in the Bitcoin DeFi landscape. The protocol's focus on maximizing utility for idle Bitcoin assets aligns with growing institutional interest in Bitcoin yield products. However, the token's substantial decline from its all-time high and limited circulating supply present notable short-term risks. Long-term value depends on the protocol's ability to scale TVL, maintain security standards, and navigate evolving regulatory environments. The current market capitalization of approximately $19.4 million and 127,466 holders suggest early-stage adoption with room for growth.
SOLV Investment Recommendations
✅ Beginners: Start with minimal exposure (1-3% of crypto portfolio) and focus on understanding Bitcoin staking mechanics before increasing position size
✅ Experienced Investors: Consider dollar-cost averaging during market weakness while monitoring protocol metrics and token unlock schedules
✅ Institutional Investors: Conduct comprehensive due diligence on protocol security, team credentials, and competitive positioning before committing significant capital
SOLV Trading Participation Methods
- Spot Trading: Available on Gate.com and 32 other exchanges for direct token purchases
- Staking Programs: Participate in protocol staking to earn yield while supporting network security
- Liquidity Provision: Consider providing liquidity on supported DEXs for additional yield opportunities with managed risk
Cryptocurrency investments carry extremely high risks, and this article does not constitute investment advice. Investors should make careful decisions based on their own risk tolerance and are advised to consult professional financial advisors. Never invest more than you can afford to lose.
FAQ
What is SOLV token? What are its uses and application scenarios?
SOLV is a utility token powering the Solv Protocol, a decentralized platform for digital asset tokenization and yield optimization. It enables governance, staking rewards, and access to innovative DeFi solutions for managing financial instruments and generating sustainable yields in Web3 ecosystem.
SOLV has demonstrated strong growth momentum since launch. The token experienced significant appreciation through 2024-2025, reflecting increasing adoption in the RWA tokenization sector. Current price levels reflect market confidence in the protocol's expanding ecosystem and real-world asset integration capabilities.
How much will SOLV price rise in 2024-2025? What are expert predictions?
Expert predictions suggest SOLV could reach $2-3 range by end of 2025, driven by ecosystem expansion and increased adoption. However, market conditions and protocol developments will significantly influence actual price movements. Analysts remain cautiously optimistic about SOLV's long-term growth trajectory.
What are the main factors affecting SOLV price?
SOLV price is primarily influenced by market demand and token utility, project developments and partnerships, overall crypto market sentiment, trading volume and liquidity, staking rewards mechanisms, and ecosystem growth on Solana network.
What are the advantages and disadvantages of SOLV compared to other DeFi tokens?
SOLV's advantages include innovative structured products, yield optimization mechanisms, and strong institutional partnerships. Disadvantages: relatively smaller trading volume compared to major DeFi tokens and narrower asset support ecosystem.
What are the risks to be aware of when investing in SOLV?
SOLV investment risks include market volatility, liquidity fluctuations, regulatory uncertainty in crypto markets, and technology platform risks. Monitor token fundamentals and market conditions closely before investing.
How is SOLV's liquidity and trading volume? Where can I buy it?
SOLV maintains solid liquidity across major DEXs and CEXs with consistent daily trading volume. The token is widely available on leading platforms, ensuring easy access and smooth trading experience for users globally.
* The information is not intended to be and does not constitute financial advice or any other recommendation of any sort offered or endorsed by Gate.