This comprehensive article provides professional analysis of SONIC token's market position and investment outlook from 2026-2031. SONIC, positioned as the first SVM network extension on Solana for gaming and applications, currently trades at $0.05961 with a $21.46M market cap. The analysis covers historical price trends, current market status with extreme fear sentiment (index 20), and detailed price forecasts predicting growth from $0.06 to potentially $0.14 by 2031. The article presents three investment strategies—long-term holding, active trading, and risk management frameworks—while addressing critical challenges including extreme token concentration (90% held by top three addresses) and volatility risks. Designed for investors ranging from beginners to institutions, the article offers practical trading methods on Gate, actionable recommendations based on risk tolerance, and transparent risk disclosures for informed decision-making in SONIC's evolving ecosystem.
Introduction: SONIC's Market Position and Investment Value
Sonic SVM (SONIC), positioned as the first SVM network extension launched on Solana for games and applications, has been developing since its launch in January 2024. As of January 23, 2026, SONIC maintains a market capitalization of approximately 21.46 million USD, with a circulating supply of around 360 million tokens, and the price is currently hovering around 0.05961 USD. This asset, designed to power the Web3 TikTok application layer and onboard the next billion users through the Sonic HyperGrid framework, is playing an increasingly important role in the blockchain gaming and application ecosystem.
This article will comprehensively analyze SONIC's price trends from 2026 to 2031, combining historical patterns, market supply and demand dynamics, ecosystem development, and macroeconomic conditions to provide investors with professional price forecasts and practical investment strategies.
I. SONIC Price History Review and Current Market Status
SONIC Historical Price Evolution Trajectory
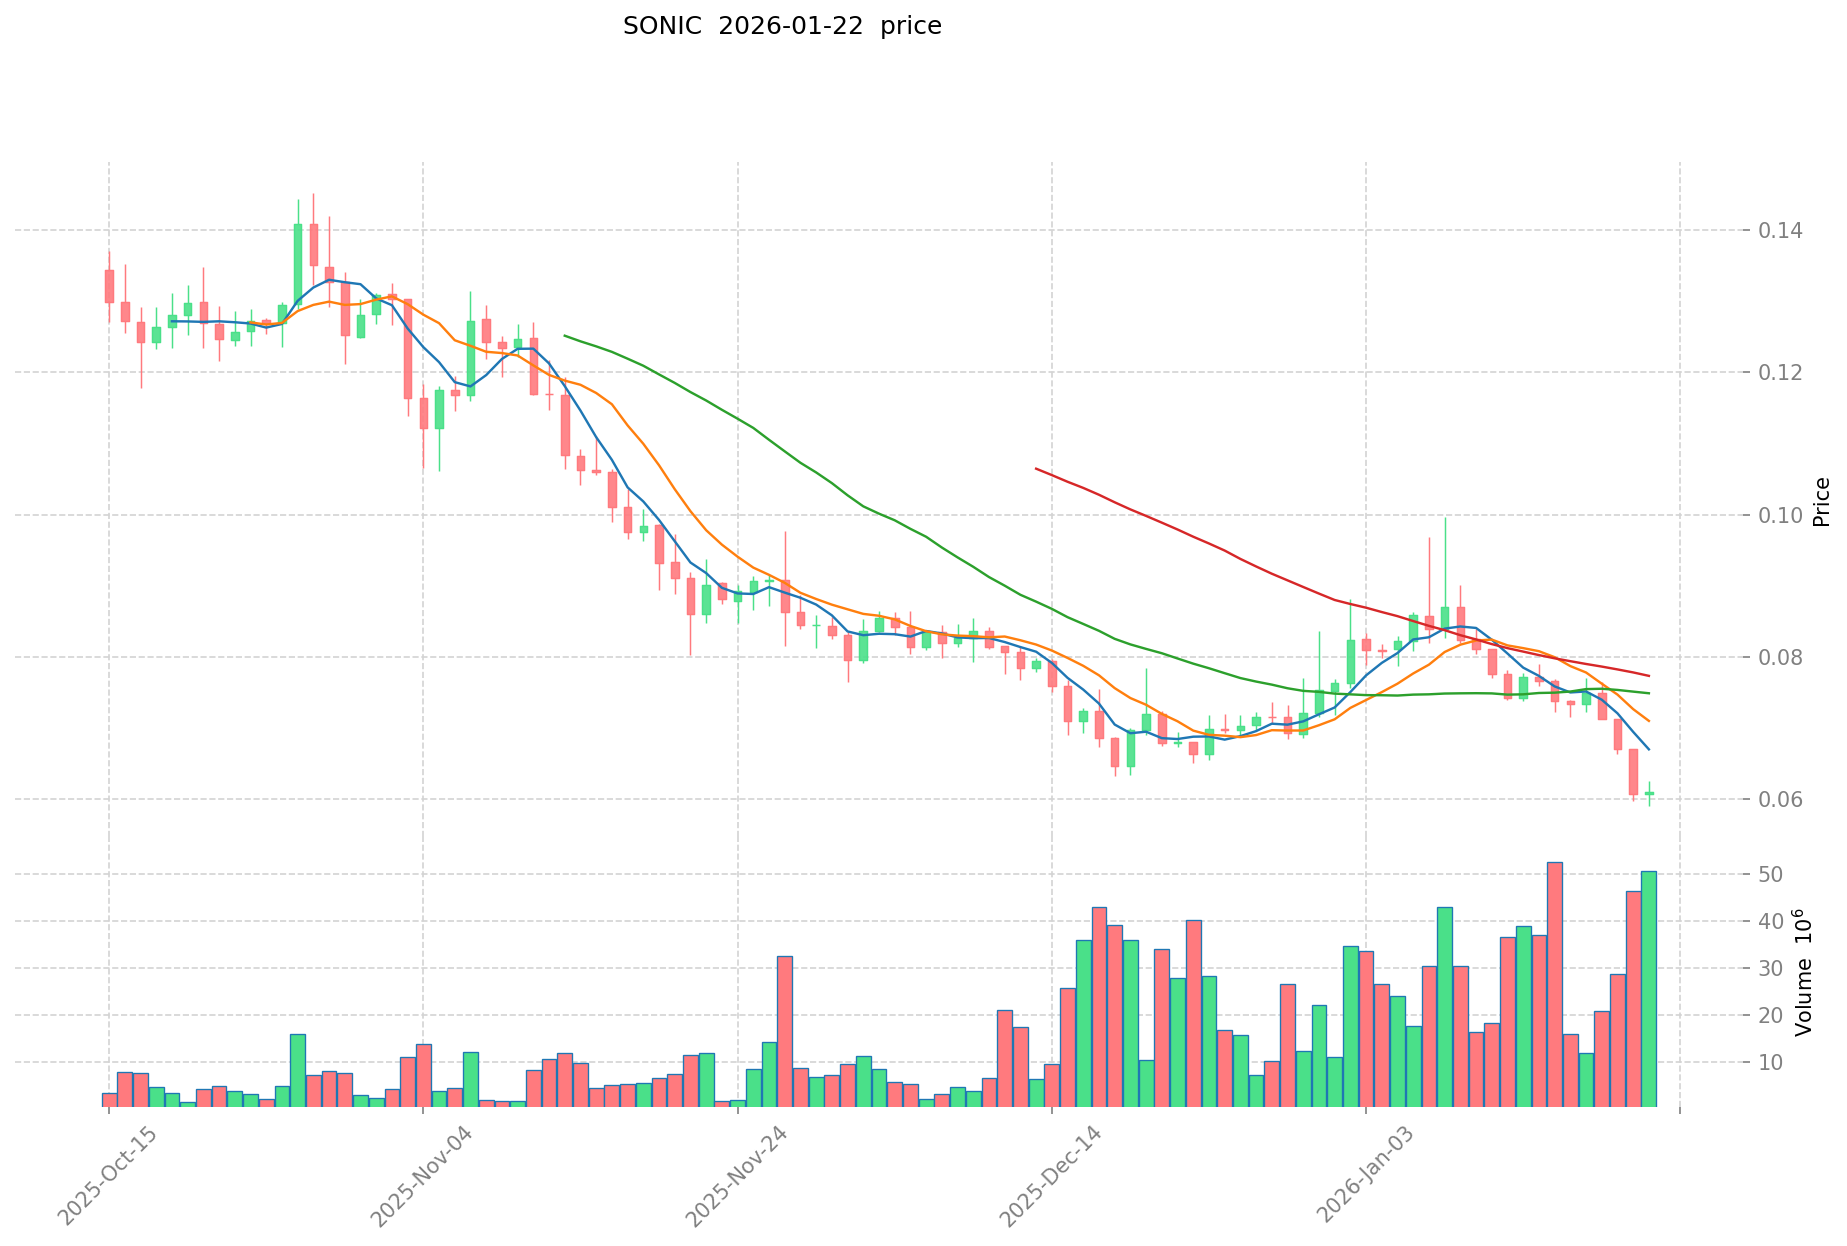
- 2025: Project launched in January with an initial price of $0.04167, experiencing significant growth to reach a peak of $1.225 on January 8th, reflecting strong initial market interest in this Solana-based SVM network extension.
- 2025: Following the January peak, the token entered a correction phase, with price declining substantially throughout the year as broader market conditions shifted.
- 2025: By October 10th, the price reached its low point at $0.03238, representing a significant pullback from earlier highs as the project navigated its first year of market trading.
SONIC Current Market Status
As of January 23, 2026, SONIC is trading at $0.05961, showing a modest 24-hour increase of 0.25%. The token has demonstrated mixed short-term performance, with a slight decline of 0.1% over the past hour. Over the past week, SONIC has experienced a price decrease of 18.88%, while the 30-day performance shows a decline of 9.16%.
The token currently holds a market capitalization of approximately $21.46 million, ranking 843rd in the cryptocurrency market with a market share of 0.0045%. With a circulating supply of 360 million tokens out of a maximum supply of 2.4 billion, the circulation ratio stands at 15%. The fully diluted market cap is calculated at $143.06 million, suggesting substantial room for supply expansion.
SONIC has recorded a 24-hour trading volume of approximately $2.73 million across 30 exchanges, with over 44,000 token holders participating in the ecosystem. The token is deployed on the Solana blockchain using the SPL20 standard. The current price remains significantly below its peak, down 89.44% from its high point, while trading approximately 84% above its recorded low.
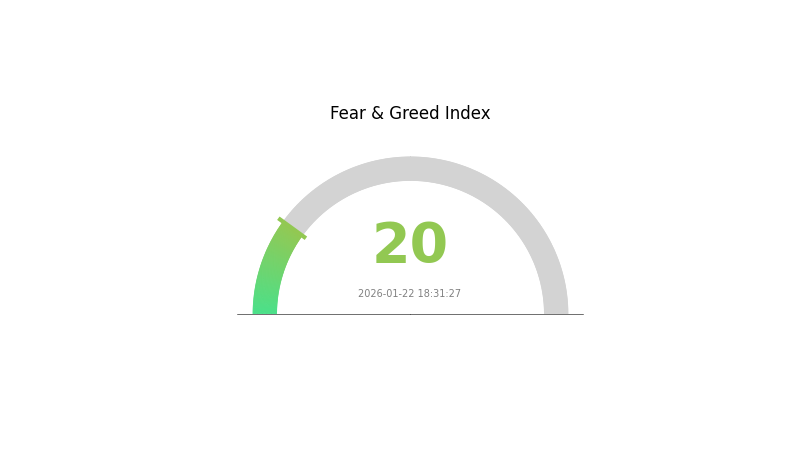
Market sentiment indicators currently reflect an "Extreme Fear" reading with a volatility index of 20, suggesting cautious investor positioning in the broader cryptocurrency market environment.
Click to view current SONIC market price
SONIC Market Sentiment Index
2026-01-22 Fear & Greed Index: 20 (Extreme Fear)
Click to view the current Fear & Greed Index
The SONIC market is currently experiencing extreme fear, with the Fear & Greed Index standing at 20. This reading indicates significant market pessimism and heightened anxiety among investors. When the index reaches such low levels, it often presents contrarian opportunities for long-term investors, as panic-driven selling may create potential entry points. However, traders should exercise caution and conduct thorough due diligence before making investment decisions in such volatile market conditions.
SONIC Holding Distribution
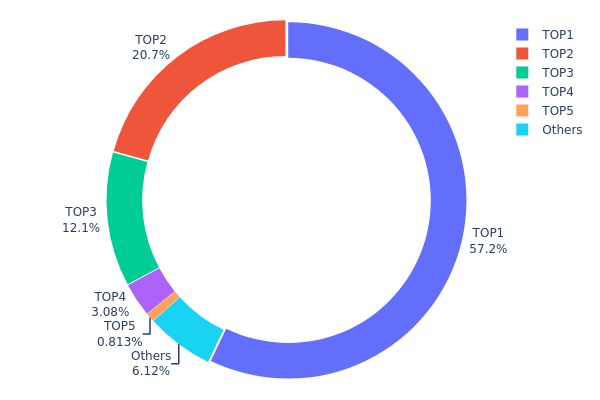
The holding distribution chart represents the concentration of token ownership among different addresses in the blockchain network. It reveals how tokens are allocated between top holders and smaller participants, serving as a crucial indicator of market structure and potential price volatility. A highly concentrated distribution may indicate greater susceptibility to large-scale sell-offs, while a more dispersed pattern typically suggests a healthier, more decentralized ecosystem.
According to the current data, SONIC demonstrates a notably concentrated holding structure. The top holder controls 1,371,770.10K tokens, accounting for 57.15% of the total supply, while the second and third largest addresses hold 20.68% and 12.13% respectively. The top three addresses collectively control nearly 90% of all circulating tokens, with only 6.16% distributed among other market participants. This extreme concentration pattern raises concerns about centralization risks and potential market manipulation.
Such a concentrated distribution structure presents several market implications. The dominance of a single entity holding over half the supply creates substantial price volatility risk, as large-scale movements by this holder could trigger significant market disruptions. Additionally, this concentration level may limit genuine price discovery mechanisms, reduce liquidity depth, and potentially undermine investor confidence in the token's long-term stability. The current holding pattern reflects a centralized market structure that deviates from the decentralization principles typically valued in blockchain ecosystems, suggesting investors should carefully evaluate the associated risks before participating.
Click to view current SONIC Holding Distribution
| Top |
Address |
Holding Qty |
Holding (%) |
| 1 |
GtoUEX...JHXUAG |
1371770.10K |
57.15% |
| 2 |
7ZHVYZ...NqPYxk |
496542.62K |
20.68% |
| 3 |
9o1ySM...rpt3it |
291299.02K |
12.13% |
| 4 |
YmmTtW...icPD2y |
73888.11K |
3.07% |
| 5 |
CRL73R...UE5VQm |
19500.00K |
0.81% |
| - |
Others |
146997.09K |
6.16% |
II. Core Factors Influencing SONIC's Future Price
Based on the available information, there is insufficient data to provide a comprehensive analysis of the core factors that may influence SONIC's future price. The current materials do not contain specific details regarding supply mechanisms, institutional holdings, macroeconomic correlations, or technical developments related to SONIC.
Investors and analysts should conduct further research and monitor official announcements from the project team, as well as track market developments through reputable cryptocurrency data platforms and news sources. Price movements in cryptocurrency markets are influenced by multiple complex factors, and any investment decisions should be made after thorough due diligence.
III. 2026-2031 SONIC Price Prediction
2026 Outlook
- Conservative Prediction: $0.0423 - $0.0596
- Neutral Prediction: Around $0.0596
- Optimistic Prediction: Up to $0.0625 (requires favorable market conditions)
For 2026, SONIC is expected to establish its baseline trading range. The conservative scenario anticipates prices maintaining support around $0.0423, while the average price is projected to hover near $0.0596. Under optimistic market conditions, SONIC could test resistance levels approaching $0.0625.
2027-2029 Mid-term Outlook
- Market Stage Expectation: Gradual growth phase with potential volatility
- Price Range Predictions:
- 2027: $0.0348 - $0.0812 (potential increase of 2%)
- 2028: $0.0484 - $0.0946 (potential increase of 19%)
- 2029: $0.0746 - $0.1193 (potential increase of 38%)
- Key Catalysts: Market adoption growth, ecosystem development, and broader cryptocurrency market trends
The mid-term period suggests progressive price appreciation. 2027 may see modest growth with prices ranging between $0.0348 and $0.0812. By 2028, SONIC could experience more significant momentum, with projections indicating a 19% potential increase and prices reaching up to $0.0946. The 2029 outlook appears more bullish, with potential gains of 38% and prices possibly touching $0.1193 under favorable conditions.
2030-2031 Long-term Outlook
- Baseline Scenario: $0.0728 - $0.1213 (assuming steady market growth)
- Optimistic Scenario: $0.1011 - $0.1213 (with strong ecosystem expansion)
- Transformative Scenario: Up to $0.1401 (under exceptionally favorable market conditions)
Looking toward the long-term horizon, SONIC's price trajectory shows potential for sustained growth. The 2030 projections suggest a possible 69% increase, with prices ranging from $0.0728 to $0.1213. By 2031, the outlook becomes even more promising, with an 86% potential increase and prices potentially reaching $0.1401 under optimal conditions. The average price in 2031 is forecasted around $0.1112, indicating continued upward momentum.
It is important to note that these predictions are based on current market analysis and historical data trends. Cryptocurrency markets remain highly volatile, and actual prices may vary significantly based on market sentiment, regulatory developments, technological advancements, and overall adoption rates. Investors should conduct thorough research and consider their risk tolerance before making investment decisions.
| Year |
Predicted High Price |
Predicted Average Price |
Predicted Low Price |
Price Change |
| 2026 |
0.06254 |
0.05956 |
0.04229 |
0 |
| 2027 |
0.0812 |
0.06105 |
0.0348 |
2 |
| 2028 |
0.09459 |
0.07112 |
0.04836 |
19 |
| 2029 |
0.11931 |
0.08286 |
0.07457 |
38 |
| 2030 |
0.1213 |
0.10109 |
0.07278 |
69 |
| 2031 |
0.1401 |
0.11119 |
0.08562 |
86 |
IV. SONIC Professional Investment Strategies and Risk Management
SONIC Investment Methodology
(1) Long-term Holding Strategy
- Suitable for: Investors who believe in Solana ecosystem expansion and SVM technology development
- Operational Recommendations:
- Consider accumulating SONIC gradually during market corrections, particularly when price approaches support levels around $0.058-$0.060
- Monitor Sonic HyperGrid framework development progress and adoption metrics as key indicators for long-term value assessment
- Storage Solution: Consider using Gate Web3 Wallet for secure storage, which supports SPL20 tokens and provides multi-layer security features
(2) Active Trading Strategy
- Technical Analysis Tools:
- Price Range Analysis: Monitor the recent trading range between $0.05856 (24h low) and $0.06195 (24h high) to identify potential entry and exit points
- Volume Analysis: Track the 24-hour trading volume of approximately $2.73M to assess market liquidity and participation levels
- Swing Trading Considerations:
- Pay attention to the current circulating supply ratio of 15%, which indicates limited token availability in the market
- Consider the significant distance from all-time high ($1.225 in January 2025), which may present both risk and opportunity depending on project development
SONIC Risk Management Framework
(1) Asset Allocation Principles
- Conservative Investors: 1-2% of crypto portfolio allocation
- Aggressive Investors: 3-5% of crypto portfolio allocation
- Professional Investors: May consider up to 5-8% allocation with active management strategies
(2) Risk Hedging Solutions
- Position Sizing: Avoid over-concentration, given the token's ranking at #843 by market cap
- Diversification Approach: Balance SONIC holdings with other Solana ecosystem projects and broader market exposure
(3) Secure Storage Solutions
- Web3 Wallet Recommendation: Gate Web3 Wallet provides comprehensive support for SPL20 tokens with multi-signature capabilities
- Hardware Wallet Option: Consider cold storage solutions for long-term holdings exceeding significant value thresholds
- Security Precautions: Never share private keys, enable two-factor authentication, and regularly verify wallet addresses before transactions
V. SONIC Potential Risks and Challenges
SONIC Market Risks
- Volatility Exposure: The token has experienced an 89.44% decline over one year, indicating substantial price volatility
- Liquidity Concerns: With a market cap of $21.46M and 24h trading volume of $2.73M, liquidity may be limited during market stress periods
- Market Sentiment: The current market dominance of 0.0045% suggests limited mainstream adoption and potential susceptibility to broader market movements
SONIC Regulatory Risks
- Solana Ecosystem Dependencies: Regulatory developments affecting Solana could impact SONIC's operational framework
- Gaming and Application Layer Compliance: Potential regulatory scrutiny of Web3 gaming and application platforms may affect project development
- Token Classification Uncertainty: Evolving regulatory frameworks for utility tokens and gaming assets may impact SONIC's legal status in various jurisdictions
SONIC Technical Risks
- Early-stage Technology: As the first SVM network extension on Solana, the Sonic HyperGrid framework may face unforeseen technical challenges
- Rollup Coordination Complexity: The optimistic Solana rollups orchestration system requires ongoing development and optimization
- Network Dependency: Reliance on Solana's underlying infrastructure means any technical issues with the base layer could affect SONIC operations
VI. Conclusion and Action Recommendations
SONIC Investment Value Assessment
SONIC positions itself as an innovative infrastructure project within the Solana ecosystem, targeting gaming and application scalability. The project's focus on supporting the next generation of Web3 applications through its HyperGrid framework represents an interesting technological proposition. However, the significant price decline of 89.44% over the past year and the current market cap of approximately $21.46M suggest that the project is in an early development phase with considerable volatility. The limited circulating supply of 15% indicates potential future supply pressure as more tokens enter circulation. While the technology addresses real scalability challenges, investors should weigh the innovation potential against the execution risks and market uncertainty.
SONIC Investment Recommendations
✅ Beginners: Consider observing the project's development and community growth before making any investment. If interested, start with a minimal allocation (less than 1% of crypto portfolio) and use Gate Web3 Wallet for secure storage
✅ Experienced Investors: May consider a small strategic position (1-3% of crypto portfolio) with a focus on monitoring Sonic HyperGrid adoption metrics and ecosystem development milestones
✅ Institutional Investors: Conduct thorough due diligence on the technical architecture, team capabilities, and competitive positioning within the Solana scaling solution landscape before considering any allocation
SONIC Trading Participation Methods
- Spot Trading: Available on Gate.com with USDT trading pairs, suitable for direct purchase and holding strategies
- Dollar-Cost Averaging: Consider systematic accumulation during market corrections to mitigate timing risk and reduce average entry price
- Technical Analysis Trading: Utilize Gate.com's advanced charting tools and real-time market data to identify potential entry and exit points based on technical indicators
Cryptocurrency investments carry extremely high risks, and this article does not constitute investment advice. Investors should make prudent decisions based on their own risk tolerance and are advised to consult professional financial advisors. Never invest more than you can afford to lose.
FAQ
What is SONIC coin? What are its main uses and technical features?
SONIC is a high-performance Layer 1 blockchain designed for speed and efficiency. It features fast transaction finality, low fees, and EVM compatibility. The token powers network operations, governance, and staking, enabling decentralized application development on a scalable infrastructure optimized for Web3 adoption.
SONIC has demonstrated strong momentum in 2025, gaining approximately 150-200% over the past year. The token experienced significant growth driven by ecosystem development and increased adoption. While volatility remains, SONIC's trajectory reflects positive market sentiment and growing utility in the Web3 space.
What is the SONIC price prediction for 2024-2025? How do professional analysts view it?
Based on market analysis, SONIC showed strong momentum in 2024-2025. Analysts projected prices ranging from $0.50-$2.00, driven by network growth and ecosystem development. Conservative estimates suggested $0.80-$1.20 range, while bullish analysts anticipated $1.50+ by end of 2025.
What are the main factors affecting SONIC price?
SONIC price is primarily influenced by network adoption and user growth, developer activity and ecosystem development, market sentiment and crypto trends, trading volume and liquidity, technological upgrades and improvements, and competition from other Layer 1 blockchains.
What are the risks of investing in SONIC coin and how should they be evaluated?
SONIC carries market volatility risk, liquidity risk, and technology adoption uncertainty. Evaluate by monitoring trading volume, project fundamentals, team credibility, and market sentiment. Start with small positions and diversify your portfolio accordingly.
What are the advantages and disadvantages of SONIC compared to other Layer 1 blockchain projects such as SOL and AVAX?
SONIC offers faster transaction speeds and lower fees through optimized consensus mechanisms. Advantages include high throughput and developer-friendly infrastructure. Compared to SOL and AVAX, SONIC provides competitive scalability, though ecosystem maturity and network effects remain areas for development as it builds its community.
* The information is not intended to be and does not constitute financial advice or any other recommendation of any sort offered or endorsed by Gate.