This comprehensive SQD price prediction guide provides expert analysis of Subsquid's token performance from 2026 through 2031. The article examines SQD's market position, tracing its evolution from $0.176 launch price to current $0.06946 levels, while analyzing critical factors affecting future valuation. Featured predictions range from conservative ($0.04508-$0.06935 in 2026) to optimistic scenarios (potentially exceeding $0.19001 by 2031), supported by ecosystem development assessment and macroeconomic analysis. Readers gain practical investment strategies including long-term holding approaches, active trading techniques, and risk management frameworks suitable for different investor profiles. The guide addresses essential considerations including liquidity analysis, regulatory risks, technical vulnerabilities, and secure storage solutions via Gate Web3 Wallet. Ideal for cryptocurrency investors seeking informed SQD investment decisions, this analysis combines historical data with future outlook to support
Introduction: SQD's Market Position and Investment Value
Subsquid (SQD), as a hyper-scalable data access layer and indexing protocol for blockchain applications, has been serving the decentralized ecosystem since its launch in 2024. As of January 2026, Subsquid holds a market capitalization of approximately $11.21 million, with a circulating supply of around 161.4 million tokens, and the price maintaining around $0.06946. This asset, recognized as an essential infrastructure provider for dApp user experiences, is playing an increasingly critical role in blockchain data accessibility and indexing solutions.
This article will comprehensively analyze SQD's price trends from 2026 to 2031, combining historical patterns, market supply and demand dynamics, ecosystem development, and macroeconomic conditions to provide investors with professional price forecasts and practical investment strategies.
I. SQD Price History Review and Market Status
SQD Historical Price Evolution Trajectory
- 2024: SQD launched on May 16, 2024, with a publish price of $0.176. The token experienced significant volatility in its first year, reaching a historical high of $0.5 on May 17, 2024, just one day after launch, representing a substantial increase from its initial offering price.
- 2024: Following the initial peak, SQD entered a correction phase. By mid-November 2024, specifically on November 16, 2024, the token recorded its historical low of $0.02288, reflecting the challenging market conditions during this period.
SQD Current Market Status
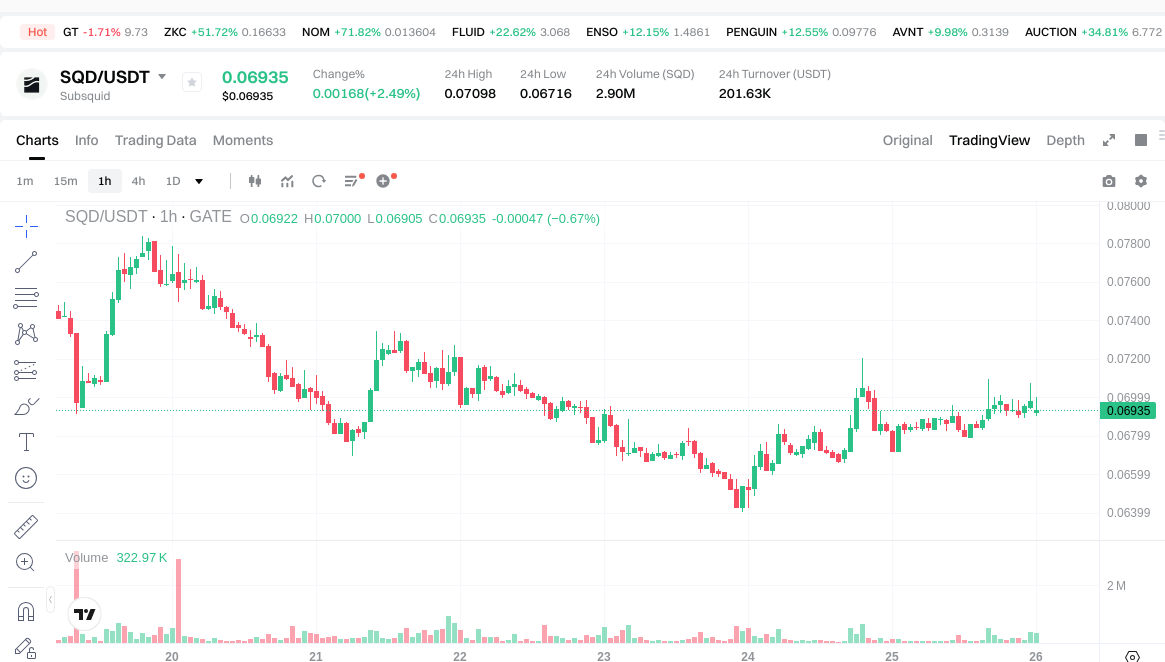
As of January 26, 2026, SQD is trading at $0.06946, showing a 24-hour price increase of 2.45%. The token's intraday trading range spans from a low of $0.06716 to a high of $0.07098. Over the past hour, SQD experienced a slight decline of 1.22%, while the 7-day performance shows a decrease of 8.14%.
Looking at longer timeframes, SQD has demonstrated a 30-day gain of 13.65%, indicating some recovery momentum in recent weeks. However, the 1-year performance reflects a decline of 9.99% from the previous year's levels.
The project's market capitalization stands at approximately $11.21 million, with a 24-hour trading volume of $196,321.49. SQD maintains a circulating supply of 161.4 million tokens out of a maximum supply of 1.337 billion tokens, representing a circulation ratio of approximately 12.07%. The fully diluted market cap is calculated at $92.87 million.
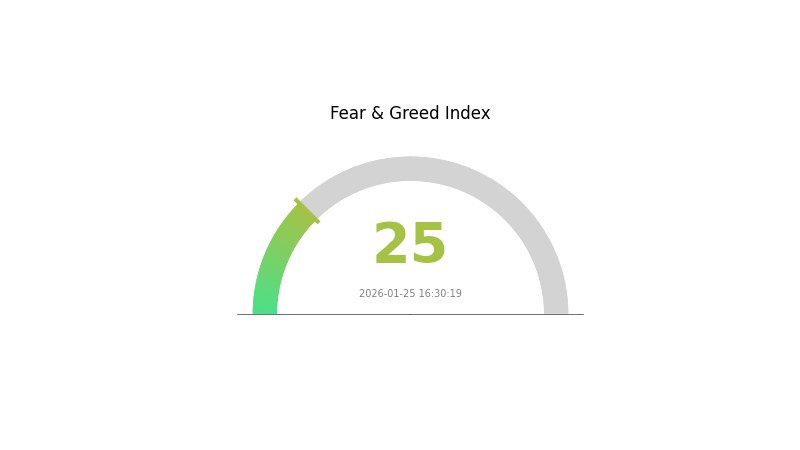
SQD is currently listed on 18 exchanges and holds a market ranking of 1141. The token has a holder base of 16,621 addresses, primarily on the Arbitrum network. The current market sentiment indicator shows a reading of 25, corresponding to an "Extreme Fear" classification.
Click to view the current SQD market price
SQD Market Sentiment Index
2026-01-25 Fear and Greed Index: 25 (Extreme Fear)
Click to view the current Fear & Greed Index
The cryptocurrency market is currently experiencing extreme fear, with the Fear and Greed Index at 25. This indicates significant market pessimism and heightened investor anxiety. During periods of extreme fear, experienced traders often identify potential buying opportunities, as assets may be undervalued due to panic selling. However, caution is advised, as the market may continue declining before stabilizing. Investors should maintain a long-term perspective, conduct thorough research, and avoid making emotional decisions based on short-term market fluctuations.
SQD Holding Distribution
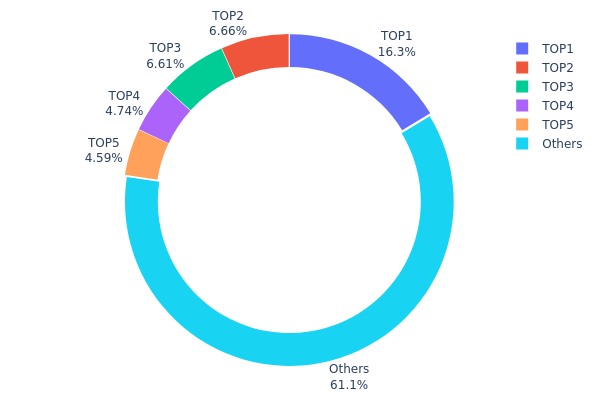
The holding distribution chart provides insight into the concentration of token ownership across different addresses. For SQD, the current on-chain data reveals a moderately concentrated ownership structure. The top holder controls 216.5 million tokens (16.30% of total supply), followed by four other major addresses holding between 4.59% and 6.65% each. Collectively, the top five addresses account for 38.88% of the circulating supply, while the remaining 61.12% is distributed among other participants.
This concentration level presents a mixed market structure. While the majority stake remains distributed among smaller holders, the significant holdings by top addresses could introduce potential volatility risks. Large holders possess sufficient market power to influence price movements through concentrated selling pressure or strategic accumulation. The relatively balanced distribution between major holders and the broader community suggests moderate decentralization, though not at optimal levels for fully resilient market dynamics.
From a structural stability perspective, this holding pattern indicates an evolving ecosystem. The presence of multiple large addresses rather than single dominant control reduces the risk of unilateral market manipulation, yet coordinated actions among top holders could still impact liquidity and price discovery mechanisms. Investors should monitor potential movements from these concentrated positions, as sudden redistributions could trigger significant market reactions.
Click to view current SQD Holding Distribution
| Top |
Address |
Holding Qty |
Holding (%) |
| 1 |
0x36e2...fcae4e |
216500.00K |
16.30% |
| 2 |
0xb31a...ac9a51 |
88383.45K |
6.65% |
| 3 |
0x2677...6cb310 |
87800.00K |
6.61% |
| 4 |
0x86ac...50d8b6 |
62892.59K |
4.73% |
| 5 |
0xb9de...3cf3b2 |
60959.62K |
4.59% |
| - |
Others |
810984.66K |
61.12% |
II. Core Factors Influencing SQD's Future Price
Based on the available information, there is currently insufficient data to comprehensively analyze the core factors that may influence SQD's future price movements. The following aspects require further monitoring and research:
Supply Mechanism
Detailed information regarding SQD's supply mechanism, including tokenomics, emission schedules, and historical supply changes, is not currently available in the provided materials.
Institutional and Major Holder Dynamics
Data concerning institutional holdings, enterprise adoption, and regulatory policies specific to SQD has not been identified in the reference materials.
Macroeconomic Environment
While macroeconomic factors such as monetary policy, inflation hedging characteristics, and geopolitical elements can influence cryptocurrency markets broadly, specific analysis related to SQD's performance under various economic conditions requires additional data.
Technology Development and Ecosystem Building
Information about technical upgrades, protocol improvements, and ecosystem applications related to SQD is not available in the current materials. Further research into the project's development roadmap and ecosystem expansion would be necessary for a comprehensive assessment.
III. 2026-2031 SQD Price Prediction
2026 Outlook
- Conservative Prediction: $0.04508 - $0.06935
- Neutral Prediction: $0.06935
- Optimistic Prediction: $0.0742 (requires favorable market conditions and increased adoption)
2027-2029 Outlook
- Market Stage Expectation: The token may enter a gradual growth phase as the ecosystem matures and user adoption expands. During this period, SQD could benefit from broader blockchain infrastructure development and potential partnerships within the data indexing sector.
- Price Range Predictions:
- 2027: $0.05312 - $0.10336
- 2028: $0.05692 - $0.1296
- 2029: $0.06841 - $0.16071
- Key Catalysts: Enhanced protocol utility, expansion of the user base, technological improvements in data indexing capabilities, and overall cryptocurrency market sentiment could serve as primary drivers for price appreciation.
2030-2031 Long-term Outlook
- Baseline Scenario: $0.08617 - $0.16696 (assuming steady ecosystem growth and moderate market conditions)
- Optimistic Scenario: $0.13464 - $0.19001 (assuming successful protocol upgrades, strong institutional adoption, and favorable regulatory environment)
- Transformational Scenario: Prices could potentially exceed $0.19001 (under conditions of exceptional market demand, breakthrough technological advancements, and widespread industry integration)
- 2026-01-26: SQD trading within the projected range as the project continues its development trajectory
| Year |
Predicted High Price |
Predicted Average Price |
Predicted Low Price |
Price Change |
| 2026 |
0.0742 |
0.06935 |
0.04508 |
0 |
| 2027 |
0.10336 |
0.07178 |
0.05312 |
3 |
| 2028 |
0.1296 |
0.08757 |
0.05692 |
26 |
| 2029 |
0.16071 |
0.10858 |
0.06841 |
56 |
| 2030 |
0.16696 |
0.13464 |
0.08617 |
93 |
| 2031 |
0.19001 |
0.1508 |
0.08897 |
117 |
IV. SQD Professional Investment Strategy and Risk Management
SQD Investment Methodology
(I) Long-Term Holding Strategy
- Target Investors: Blockchain infrastructure believers and indexing protocol enthusiasts
- Operational Recommendations:
- Consider accumulating positions during market corrections when price approaches support levels
- Monitor Subsquid Network's adoption metrics and protocol development milestones
- Implement dollar-cost averaging to mitigate timing risk
- Storage Solution: Gate Web3 Wallet offers secure multi-chain support for SQD token storage
(II) Active Trading Strategy
- Technical Analysis Tools:
- Support and Resistance Levels: Current price range shows support near $0.067 and resistance around $0.071 based on 24-hour data
- Volume Analysis: Monitor daily trading volume ($196,321) relative to market cap to gauge liquidity conditions
- Swing Trading Key Points:
- Track 24-hour volatility patterns between $0.06716 and $0.07098
- Set stop-loss orders 5-8% below entry points to manage downside risk
SQD Risk Management Framework
(I) Asset Allocation Principles
- Conservative Investors: 1-3% of crypto portfolio
- Aggressive Investors: 5-8% of crypto portfolio
- Professional Investors: 8-12% of crypto portfolio with active hedging strategies
(II) Risk Hedging Solutions
- Diversification Approach: Balance SQD holdings with established layer-1 tokens and stablecoins
- Position Sizing: Limit single-position exposure based on personal risk tolerance and market conditions
(III) Secure Storage Solutions
- Software Wallet Recommendation: Gate Web3 Wallet provides user-friendly interface with Arbitrum network support
- Multi-Signature Option: Consider multi-sig solutions for institutional holdings
- Security Precautions: Enable two-factor authentication, regularly update recovery phrases, and avoid sharing private keys
V. SQD Potential Risks and Challenges
SQD Market Risks
- High Volatility: Price declined 8.14% over 7 days, demonstrating significant short-term fluctuations
- Limited Liquidity: With market cap around $11.2 million and 18 exchange listings, liquidity may be constrained during high-volume periods
- Low Circulation Ratio: Only 12.07% of total supply currently circulating, potential for increased selling pressure as more tokens unlock
SQD Regulatory Risks
- Indexing Protocol Classification: Evolving regulatory frameworks may impact how data infrastructure tokens are classified
- Cross-Chain Operations: Multi-chain indexing services may face varying regulatory requirements across jurisdictions
- Compliance Requirements: Future regulations regarding blockchain data access and user privacy could affect protocol operations
SQD Technical Risks
- Smart Contract Vulnerabilities: Arbitrum-based contract at 0x1337420dED5ADb9980CFc35f8f2B054ea86f8aB1 requires ongoing security audits
- Competition Risk: Emergence of alternative indexing solutions could impact Subsquid's market position
- Network Dependencies: Protocol functionality relies on underlying blockchain networks maintaining operational integrity
VI. Conclusion and Action Recommendations
SQD Investment Value Assessment
Subsquid (SQD) represents a specialized investment opportunity in the blockchain infrastructure sector, specifically focusing on data indexing protocols. The token has demonstrated notable volatility with a 13.65% gain over 30 days but an 8.14% decline over 7 days. With a relatively small market cap of $11.2 million and limited circulation (12.07%), SQD carries heightened risk but potential upside for investors who believe in the long-term demand for scalable blockchain data access solutions. The project's positioning in the growing dApp ecosystem provides fundamental support, though investors should carefully weigh execution risks and competitive dynamics.
SQD Investment Recommendations
✅ Beginners: Start with minimal allocation (1-2% of crypto portfolio) and focus on education about indexing protocols before increasing exposure
✅ Experienced Investors: Consider strategic positions during price corrections, employing technical analysis and monitoring protocol adoption metrics
✅ Institutional Investors: Conduct thorough due diligence on Subsquid's technology stack, evaluate competitive positioning, and implement risk-adjusted position sizing
SQD Trading Participation Methods
- Spot Trading: Purchase SQD directly on Gate.com and 17 other supported exchanges
- Dollar-Cost Averaging: Establish regular purchase intervals to smooth entry price over time
- Wallet Storage: Transfer holdings to Gate Web3 Wallet for secure self-custody on Arbitrum network
Cryptocurrency investments carry extreme risk, and this article does not constitute investment advice. Investors should make prudent decisions based on their own risk tolerance and are advised to consult professional financial advisors. Never invest more than you can afford to lose.
FAQ
What is the historical price trend of SQD tokens?
SQD has demonstrated strong growth since its launch, experiencing significant price appreciation driven by increasing adoption and ecosystem development. The token showed resilience through market cycles, with notable rallies during periods of heightened blockchain activity and expanded partnerships.
What are the main factors affecting SQD price?
SQD price is influenced by network adoption and developer activity, market sentiment and crypto trends, trading volume and liquidity, technology updates and ecosystem development, and competition from similar indexing protocols.
What is the SQD price prediction for 2024-2025?
Based on market trends and fundamental analysis, SQD was projected to range between $0.50-$1.20 during 2024-2025, with potential growth driven by increased adoption and network expansion within the Squid ecosystem.
What distinguishes SQD from other cryptocurrencies?
SQD powers Subsquid's decentralized data indexing infrastructure, enabling efficient blockchain data processing and query capabilities. Unlike general-purpose cryptocurrencies, SQD serves as both governance token and economic incentive for network participants, making it uniquely positioned for Web3 data solutions.
What are the risks of investing in SQD?
SQD investment risks include market volatility, liquidity fluctuations, regulatory uncertainties in crypto markets, technology risks, and potential project development delays. Monitor market conditions and diversify your portfolio accordingly.
What is the market liquidity and trading volume of SQD?
SQD demonstrates strong market liquidity with consistent daily trading activity. The token maintains healthy trading volume across multiple platforms, reflecting solid market interest and accessibility for traders seeking exposure to the Squid protocol ecosystem.
What are SQD project's development prospects and technical foundation?
SQD leverages advanced indexing and query infrastructure built on decentralized architecture. The project demonstrates strong technical fundamentals with efficient data processing capabilities. Future prospects include expanded ecosystem adoption, enhanced scalability solutions, and increased integration with emerging Web3 applications, positioning SQD as critical infrastructure.
* The information is not intended to be and does not constitute financial advice or any other recommendation of any sort offered or endorsed by Gate.