This comprehensive analysis examines Serum (SRM) token's price trajectory from 2026 to 2031, providing expert forecasts and investment insights for cryptocurrency investors. The article reviews SRM's market history, current trading status at $0.006299, and key performance metrics including its 79.24% annual decline and $2.35 million market capitalization. Through supply-demand analysis, ecosystem development assessment, and macroeconomic evaluation, the article projects SRM's average price reaching $0.01284 by 2031, representing 103% potential growth. Additionally, it outlines professional investment strategies suitable for beginners through institutional investors, highlights risk management frameworks including position sizing and secure storage solutions on Gate exchange, and addresses critical challenges such as high volatility, limited liquidity, and regulatory uncertainties. Ideal for investors seeking data-driven DeFi investment guidance and market sentiment analysis.
Introduction: SRM's Market Position and Investment Value
Serum (SRM), positioned as a decentralized exchange protocol supporting trustless cross-chain transactions, has been operating in the DeFi ecosystem since its launch in 2020. As of 2026, SRM maintains a market capitalization of approximately $2.35 million, with a circulating supply of around 372.78 million tokens, and the price hovering near $0.006299. This asset, designed to serve as a utility token within the Serum ecosystem, plays a role in reducing trading fees and enabling participation in the protocol's governance and validation mechanisms.
This article will comprehensively analyze SRM's price trajectory from 2026 to 2031, combining historical patterns, market supply-demand dynamics, ecosystem developments, and macroeconomic conditions to provide professional price forecasts and practical investment strategies for investors.
I. SRM Price History Review and Market Status
SRM Historical Price Evolution Trajectory
- 2020: Serum launched with an initial offering price of $0.11, establishing its position in the decentralized exchange ecosystem
- 2021: The token experienced significant growth momentum, reaching its peak price of $13.78 on September 11, 2021
- 2022-2024: Following the broader crypto market correction, SRM underwent substantial price adjustments
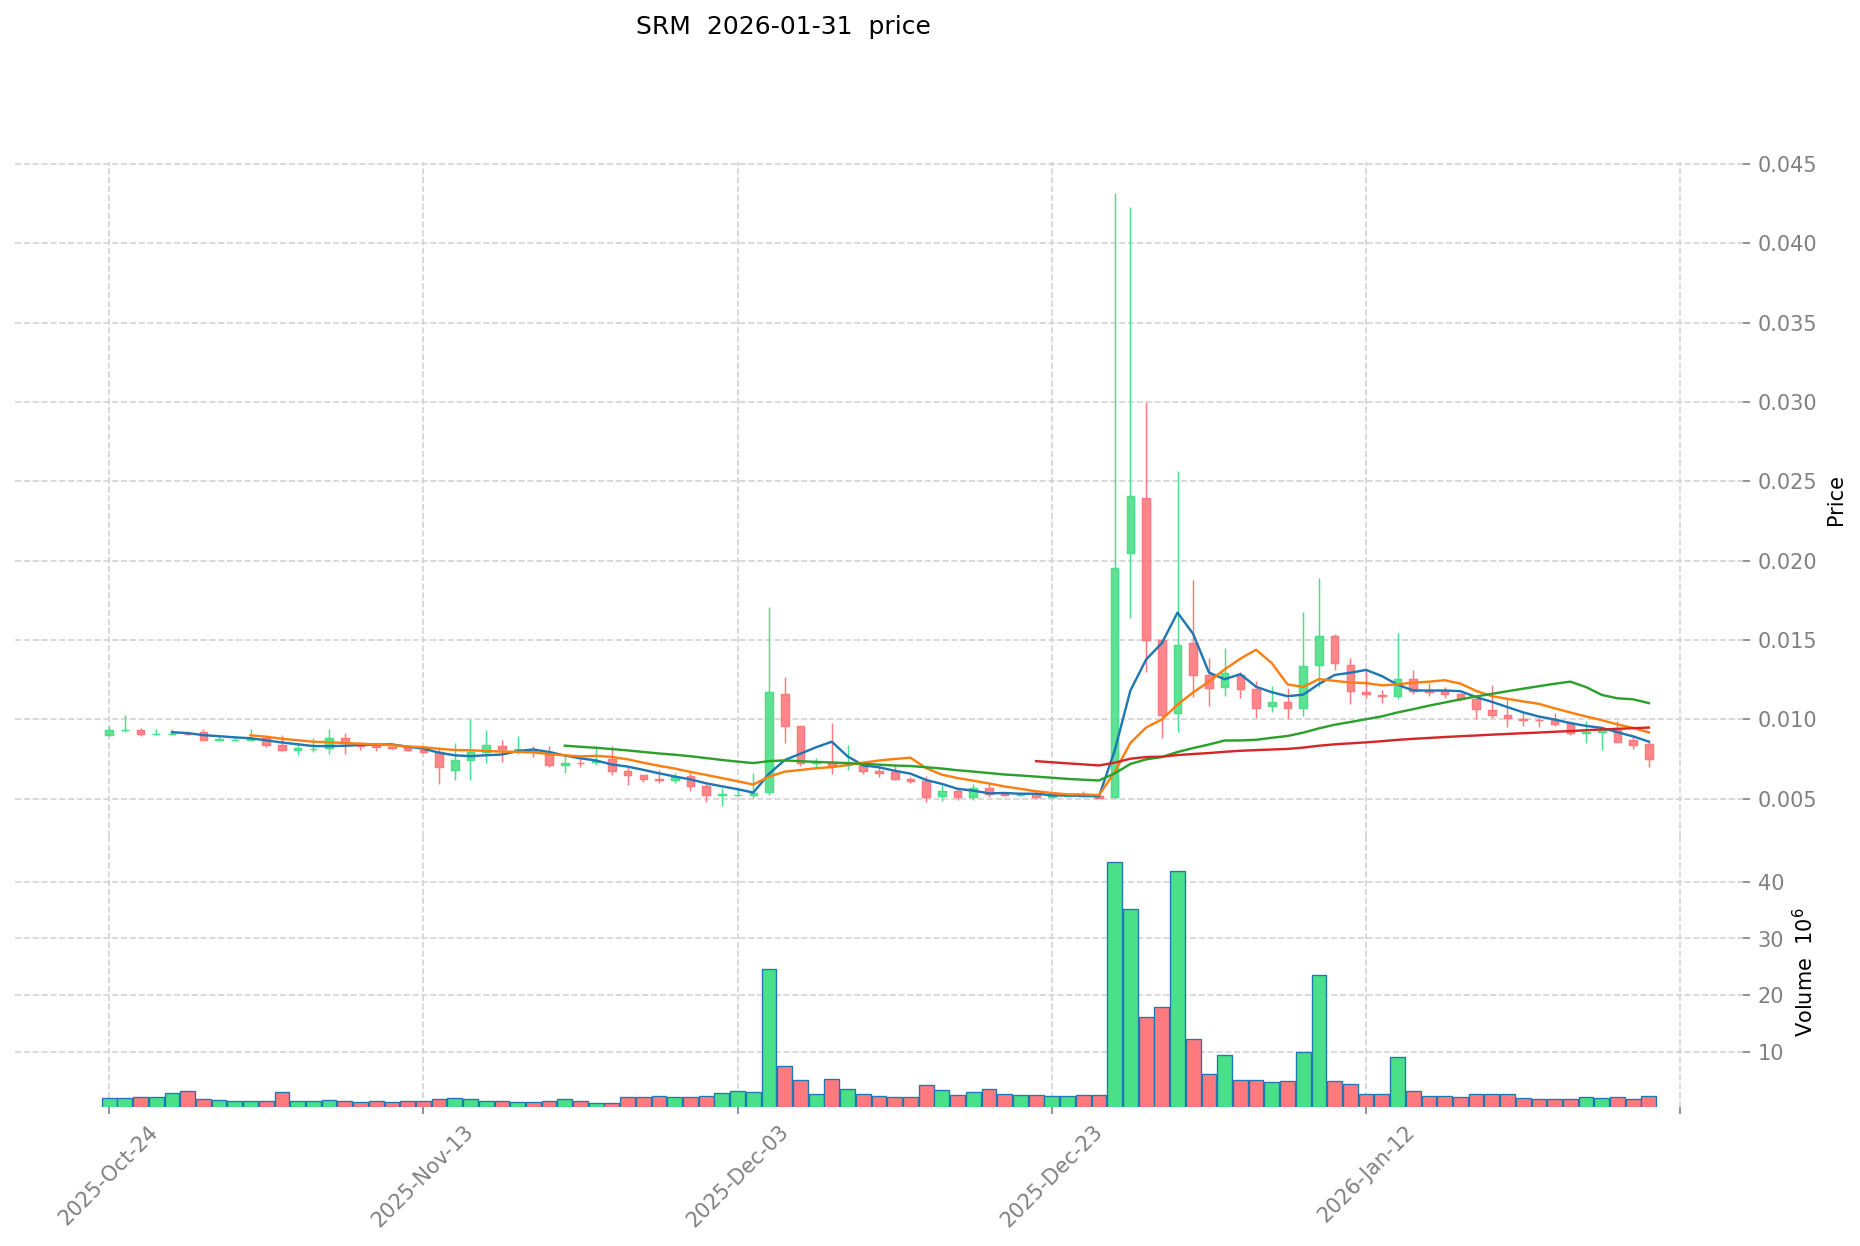
- 2025: The token declined to its recorded low of $0.00360482 on December 16, 2025
SRM Current Market Status
As of February 1, 2026, SRM is trading at $0.006299, showing a 1.01% increase over the past hour. However, the token has experienced notable price movements across different timeframes: a 13.72% decrease over the past 24 hours, a 35.58% decline over the past 7 days, and a 53.05% drop over the past 30 days. The annual performance indicates a 79.24% decrease compared to the previous year.
The token's 24-hour trading range spans from a low of $0.006138 to a high of $0.008337, with a total trading volume of $19,682.68. The current market capitalization stands at approximately $2.35 million, with a circulating supply of 372,782,297 SRM tokens, representing 3.67% of the total supply of 1,092,844,982 SRM. The fully diluted market cap is calculated at $6.88 million.
Serum maintains a market dominance of 0.00024% and is currently ranked #1941 in the cryptocurrency market. The token is available for trading on 5 exchanges and has a holder count of 16,838. The market-cap-to-FDV ratio stands at 3.67%, indicating limited current circulation relative to total supply.
Click to view current SRM market price
SRM Market Sentiment Index
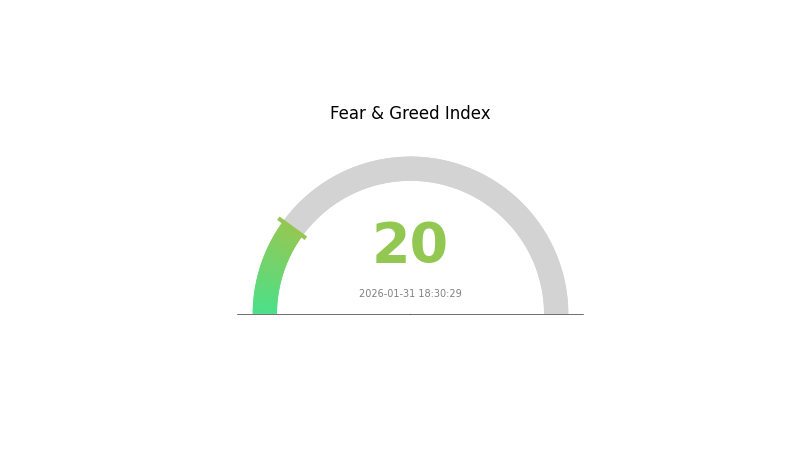
2026-01-31 Fear and Greed Index: 20 (Extreme Fear)
Click to view current Fear & Greed Index
The crypto market is currently experiencing extreme fear, with the Fear and Greed Index reaching 20. This indicates investors are highly risk-averse and pessimistic about market conditions. Such extreme fear often signals capitulation, which historically can present buying opportunities for contrarian investors. However, caution is advised as further downside risks may persist. Monitor key support levels closely and consider dollar-cost averaging into positions rather than lump-sum investments during periods of market panic.
SRM Holding Distribution
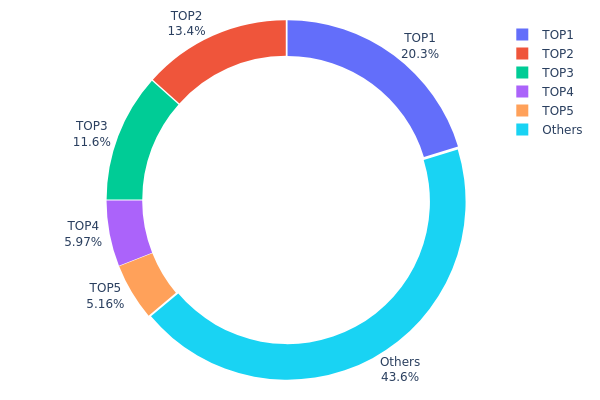
The holding distribution chart reveals the concentration of token ownership across wallet addresses, serving as a key indicator of decentralization and potential market manipulation risks. For SRM, the current on-chain distribution demonstrates significant centralization characteristics that warrant careful examination.
According to the latest data, the top five addresses collectively control approximately 56.38% of the total SRM supply, with the largest single holder possessing 20.27% (52.93 million tokens). The second and third-largest addresses hold 13.39% and 11.61% respectively, indicating a pronounced concentration among major stakeholders. This distribution pattern suggests that a relatively small number of entities maintain substantial influence over the token's market dynamics. The "Others" category, representing all remaining addresses, accounts for 43.62% of the supply, which, while substantial, still leaves the majority of tokens concentrated in the hands of a few major holders.
This concentration level presents both structural advantages and potential vulnerabilities. On one hand, major holders may include project teams, institutional investors, or strategic partners whose long-term commitment could provide price stability. However, excessive concentration simultaneously introduces heightened volatility risks, as large-scale sell-offs by any top holder could trigger significant price fluctuations. The current distribution structure indicates relatively limited decentralization, potentially affecting the token's resilience against coordinated market actions and increasing susceptibility to whale-driven price movements.
Click to view current SRM Holding Distribution
| Top |
Address |
Holding Qty |
Holding (%) |
| 1 |
0x97f9...a71e5c |
52930.43K |
20.27% |
| 2 |
0xa98f...6a7ef3 |
34965.00K |
13.39% |
| 3 |
0x85e6...39c942 |
30309.42K |
11.61% |
| 4 |
0xcb69...8c0b12 |
15575.27K |
5.96% |
| 5 |
0x9642...2f5d4e |
13464.63K |
5.15% |
| - |
Others |
113755.26K |
43.62% |
II. Core Factors Influencing Future SRM Prices
Supply and Demand Dynamics
- Market Supply-Demand Relationship: The SRM system market is experiencing rapid growth, with China's SRM market reaching 4.2 billion yuan and an annual growth rate of 31.2%, significantly exceeding traditional enterprise software such as ERP and CRM. Enterprise scale, functional requirements, and implementation scope constitute the core factors determining system pricing.
- Historical Patterns: During the period from 2010-2018, SRM systems focused on basic online functionality. From 2018-2022, the emphasis shifted to cost reduction and efficiency improvement. Currently (2023-2025), the market has evolved toward supply chain resilience and value creation. Price trends show year-over-year increases in SRM system costs.
- Current Impact: As enterprises transition from traditional "cost control" to "value creation + risk prevention" dual positioning, demand for advanced SRM systems continues to rise. High-end solutions demonstrate stronger pricing power, with costs ranging from 300,000 to 2 million yuan annually.
Technology Development and Ecosystem Building
- AI-Powered Intelligent Prediction: AI technology has significantly enhanced SRM systems' price prediction capabilities. Advanced systems achieve price prediction accuracy rates of 93.5% (compared to industry averages of 50-70%), enabling enterprises to identify optimal purchasing timing and reduce price volatility losses by 3-7%.
- Microservices Architecture and Cloud Deployment: Modern SRM systems adopt microservices architecture supporting multi-cloud deployment, low-code capabilities, and middleware technology. Leading platforms offer 3,000+ functional points with monthly updates of 150+ features, supporting 17+ languages and global mainstream currencies.
- Ecosystem Applications: SRM systems have evolved from simple supplier ledger tools to enterprise digital procurement decision centers and supply chain resilience platforms. Leading providers establish open ecosystems through 100+ ecosystem partners, covering e-commerce, technology, consulting, finance, logistics, and other fields.
Macroeconomic Environment
- Market Competition and Technology Iteration: In the electronic components procurement sector, prices fluctuate frequently due to supply-demand relationships and technological iteration. Real-time market monitoring through SRM systems enables enterprises to increase procurement during low-price periods for key raw materials.
- Digital Transformation Trends: Enterprise procurement management has undergone three-stage evolution: basic digitalization (2010-2018) → cost reduction and efficiency improvement (2018-2022) → supply chain resilience and value creation (2023-2025). Companies currently face four major challenges driving SRM system adoption and price increases.
- Investment Return Expectations: Advanced SRM systems can reduce procurement costs by an average of 16.8% (compared to industry averages of 8-10%), shorten procurement cycles by 62%, and decrease supplier management costs by 41.5%. Investment payback periods range from 6-12 months, with leading solutions delivering the fastest returns.
III. 2026-2031 SRM Price Forecast
2026 Outlook
- Conservative estimate: $0.00594 - $0.0066
- Neutral estimate: Around $0.0066
- Optimistic estimate: Up to $0.00963 (subject to favorable market conditions)
Based on the analytical framework, SRM is projected to experience modest growth in 2026, with an anticipated average price of $0.0066. The price range is expected to fluctuate between $0.00594 and $0.00963, representing approximately a 4% increase from current levels. This conservative growth outlook reflects the early-stage recovery phase of the broader cryptocurrency market.
2027-2029 Mid-term Outlook
- Market stage expectation: Progressive recovery and gradual value appreciation
- Price range forecast:
- 2027: $0.00706 - $0.01104 (average $0.00812, approximately 28% growth)
- 2028: $0.00661 - $0.01111 (average $0.00958, approximately 52% growth)
- 2029: $0.00621 - $0.01096 (average $0.01034, approximately 64% growth)
- Key catalysts: Market maturation, increased adoption potential, and enhanced ecosystem development
The mid-term projection suggests a steady upward trajectory for SRM, with the average price potentially reaching $0.01034 by 2029. This represents a compound growth rate as the asset gradually establishes stronger market positioning. The widening price range during this period indicates increased market activity and potential volatility.
2030-2031 Long-term Outlook
- Baseline scenario: $0.00767 - $0.01065 (assuming sustained market growth)
- Optimistic scenario: $0.01284 - $0.01502 (contingent on significant ecosystem expansion)
- Transformative scenario: Up to $0.01848 (under exceptionally favorable market conditions with widespread adoption)
Looking toward the end of the forecast period, SRM shows potential for substantial appreciation. The 2030 projection suggests an average price of $0.01065, representing approximately 69% growth. By 2031, the optimistic scenario could see prices reaching $0.01848, with an average of $0.01284, marking a potential 103% increase. These projections assume continued development in the decentralized finance sector and favorable regulatory environments.
- 2026-02-01: SRM price forecast begins at an average of $0.0066 (early recovery phase with conservative growth expectations)
| Year |
Predicted High Price |
Predicted Average Price |
Predicted Low Price |
Price Change |
| 2026 |
0.00963 |
0.0066 |
0.00594 |
4 |
| 2027 |
0.01104 |
0.00812 |
0.00706 |
28 |
| 2028 |
0.01111 |
0.00958 |
0.00661 |
52 |
| 2029 |
0.01096 |
0.01034 |
0.00621 |
64 |
| 2030 |
0.01502 |
0.01065 |
0.00767 |
69 |
| 2031 |
0.01848 |
0.01284 |
0.01078 |
103 |
IV. SRM Professional Investment Strategy and Risk Management
SRM Investment Methodology
(1) Long-term Holding Strategy
- Suitable for: Investors with moderate risk tolerance who believe in the long-term potential of decentralized exchange infrastructure
- Operational Recommendations:
- Consider accumulating SRM positions during market corrections, as the token has experienced significant volatility with a 79.24% decline over the past year
- Monitor the transaction fee burn mechanism which creates potential deflationary pressure on circulating supply
- Storage Solution: Use Gate Web3 Wallet for secure long-term storage with full control of private keys
(2) Active Trading Strategy
- Technical Analysis Tools:
- Volume Analysis: Monitor the 24-hour trading volume of approximately $19,682 to identify liquidity trends and potential breakout opportunities
- Support and Resistance Levels: Track the 24-hour range between $0.006138 (low) and $0.008337 (high) to identify entry and exit points
- Swing Trading Key Points:
- The token has shown high volatility with a 13.72% decline in 24 hours, providing opportunities for short-term traders
- Consider the 1-hour positive movement of 1.01% as potential short-term reversal signals within broader downtrends
SRM Risk Management Framework
(1) Asset Allocation Principles
- Conservative Investors: 1-2% of crypto portfolio given the high volatility and market capitalization rank of 1941
- Aggressive Investors: 3-5% for those comfortable with higher risk in exchange for potential upside
- Professional Investors: Up to 5-8% with active hedging strategies and continuous monitoring
(2) Risk Hedging Solutions
- Position Sizing: Implement strict position limits based on the token's low market share of 0.00024% and relatively thin liquidity
- Stop-Loss Orders: Set stop-loss levels considering the significant price swings, with particular attention to the 7-day decline of 35.58%
(3) Secure Storage Solutions
- Hot Wallet Recommendation: Gate Web3 Wallet for active traders requiring frequent access
- Cold Storage Approach: For long-term holders, consider moving larger positions to hardware wallets after purchase
- Security Precautions: Be aware that SRM is an ERC-20 token (contract address: 0x476c5E26a75bd202a9683ffD34359C0CC15be0fF), requiring proper ETH for gas fees during transfers
V. SRM Potential Risks and Challenges
SRM Market Risks
- High Volatility: The token has experienced substantial price fluctuations with a 79.24% decline over one year and 53.05% decline over 30 days, indicating significant market instability
- Limited Liquidity: With a relatively low 24-hour trading volume of $19,682 and market cap ranking of 1941, large positions may face slippage and difficulty in execution
- Market Capitalization Concerns: The low circulating market cap of approximately $2.35 million and dominance of only 0.00024% suggests vulnerability to market manipulation
SRM Regulatory Risks
- DeFi Regulatory Uncertainty: As a decentralized exchange token, SRM may face evolving regulatory scrutiny as governments worldwide develop frameworks for DeFi protocols
- Cross-chain Operation Compliance: The cross-chain nature of Serum may attract attention from regulators concerned about asset traceability and compliance
- Token Classification: Uncertainty around whether SRM might be classified as a security in certain jurisdictions could impact its trading and usage
SRM Technical Risks
- Smart Contract Vulnerabilities: As an ERC-20 token integrated with complex DeFi protocols, there are inherent risks of smart contract bugs or exploits
- Validator Node Centralization: The high barrier to becoming a validator (10 million SRM plus 1 MSRM) may lead to centralization concerns despite the project's decentralized goals
- Network Dependency: The token's value and utility are closely tied to the success and adoption of the Serum protocol ecosystem
VI. Conclusion and Action Recommendations
SRM Investment Value Assessment
SRM presents a high-risk, high-volatility investment opportunity in the decentralized exchange space. The token's deflationary mechanism through fee burns and utility in reducing trading costs provide long-term value propositions. However, significant challenges exist, including substantial price depreciation (79.24% over one year), limited liquidity, and low market capitalization ranking. The project's complete decentralization model and cross-chain capabilities represent innovative features, but investors must weigh these against the considerable market and technical risks. The current price of $0.006299 is notably below its historical high of $13.78, which may represent either a potential recovery opportunity or a reflection of fundamental challenges.
SRM Investment Recommendations
✅ Beginners: Limit exposure to less than 1% of total crypto portfolio; focus on understanding DeFi mechanics before investing; consider starting with small amounts available on Gate.com
✅ Experienced Investors: Allocate 2-5% based on risk tolerance; actively monitor trading volumes and protocol developments; implement strict stop-loss strategies given high volatility
✅ Institutional Investors: Conduct thorough due diligence on validator economics and protocol sustainability; consider strategic positions with comprehensive hedging; evaluate liquidity constraints for larger positions
SRM Trading Participation Methods
- Spot Trading: Direct purchase and sale on Gate.com for straightforward exposure to price movements
- Token Staking: Consider validator node operation (requires 10 million SRM plus 1 MSRM) for transaction fee income and staking rewards, suitable for large holders
- Trading Fee Optimization: Hold SRM to receive 50% trading fee reduction or MSRM for 60% reduction, beneficial for high-frequency traders
Cryptocurrency investments carry extreme risks, and this article does not constitute investment advice. Investors should make cautious decisions based on their own risk tolerance and are advised to consult professional financial advisors. Never invest more than you can afford to lose.
FAQ
What is SRM token? What are its main uses and application scenarios?
SRM is Solana ecosystem's governance token enabling trading fee discounts and community participation. Key uses include governance voting, protocol decisions, and ecosystem participation within the Solana network.
What are the main factors affecting SRM price?
SRM price is primarily influenced by market demand, token utility within the ecosystem, overall crypto market sentiment, trading volume, network activity, and regulatory developments. Increased adoption and platform growth typically drive price appreciation.
How to conduct SRM price prediction? What are the analysis methods?
SRM price prediction uses multiple methods: technical analysis of historical price data and trading volume, fundamental analysis of project developments and ecosystem, on-chain metrics tracking holder distribution, market sentiment analysis, and comparative valuation against similar projects. Combining these approaches provides comprehensive price forecasting insights.
SRM的历史价格走势如何?曾经达到过什么价格?
SRM历史最高价达到HK$107.001189,记录于2021年9月11日。自那以后价格波动较大,但该价格仍为历史高点。实时价格持续变化。
What risks should investors be aware of when investing in SRM?
SRM faces market volatility, regulatory uncertainty, and technical security risks. Market fluctuations and policy changes can significantly impact investment returns. Conduct thorough risk assessment before investing.
What are the advantages and disadvantages of SRM compared to other DeFi tokens?
SRM's advantages include cross-chain functionality and its unique role in the Serum DeFi ecosystem. Disadvantages are high market volatility and relatively smaller user base compared to major DeFi tokens.
How is the development status of the Serum ecosystem? What impact does it have on SRM price?
Serum ecosystem is expanding rapidly with growing users and DeFi functionalities. SRM price is driven by market demand and ecosystem growth, showing upside potential. Monitor protocol upgrades and market conditions for future performance.
* The information is not intended to be and does not constitute financial advice or any other recommendation of any sort offered or endorsed by Gate.