This comprehensive analysis examines StakeStone (STO), a decentralized omnichain liquidity infrastructure protocol, providing expert price forecasts from 2026 to 2031. Currently trading at $0.08266 with a $18.63M market cap, STO shows volatile price dynamics from its $0.2365 peak. The article combines historical pattern analysis, market sentiment assessment, and tokenomics evaluation to deliver conservative, neutral, and optimistic price scenarios. Readers gain actionable investment strategies for different investor profiles, including long-term holding approaches and active trading techniques on Gate exchange. The guide also addresses critical risk management frameworks, regulatory considerations, and security recommendations for STO portfolio allocation and participation methods in this emerging liquidity infrastructure sector.
Introduction: STO's Market Position and Investment Value
StakeStone (STO), as a decentralized omnichain liquidity infrastructure protocol, has been reshaping how liquidity is acquired and distributed across blockchain ecosystems since its launch in 2025. As of January 2026, STO has achieved a market capitalization of approximately $18.63 million, with a circulating supply of around 225.33 million tokens, and its price is maintained at approximately $0.08266. This asset, recognized as a "cross-chain liquidity solution," is playing an increasingly vital role in facilitating efficient and sustainable liquidity flows within the modular and multi-chain DeFi landscape.
This article will comprehensively analyze STO's price trends from 2026 to 2031, combining historical patterns, market supply and demand dynamics, ecosystem development, and macroeconomic conditions to provide investors with professional price forecasts and practical investment strategies.
I. STO Price History Review and Market Status
STO Historical Price Evolution Trajectory
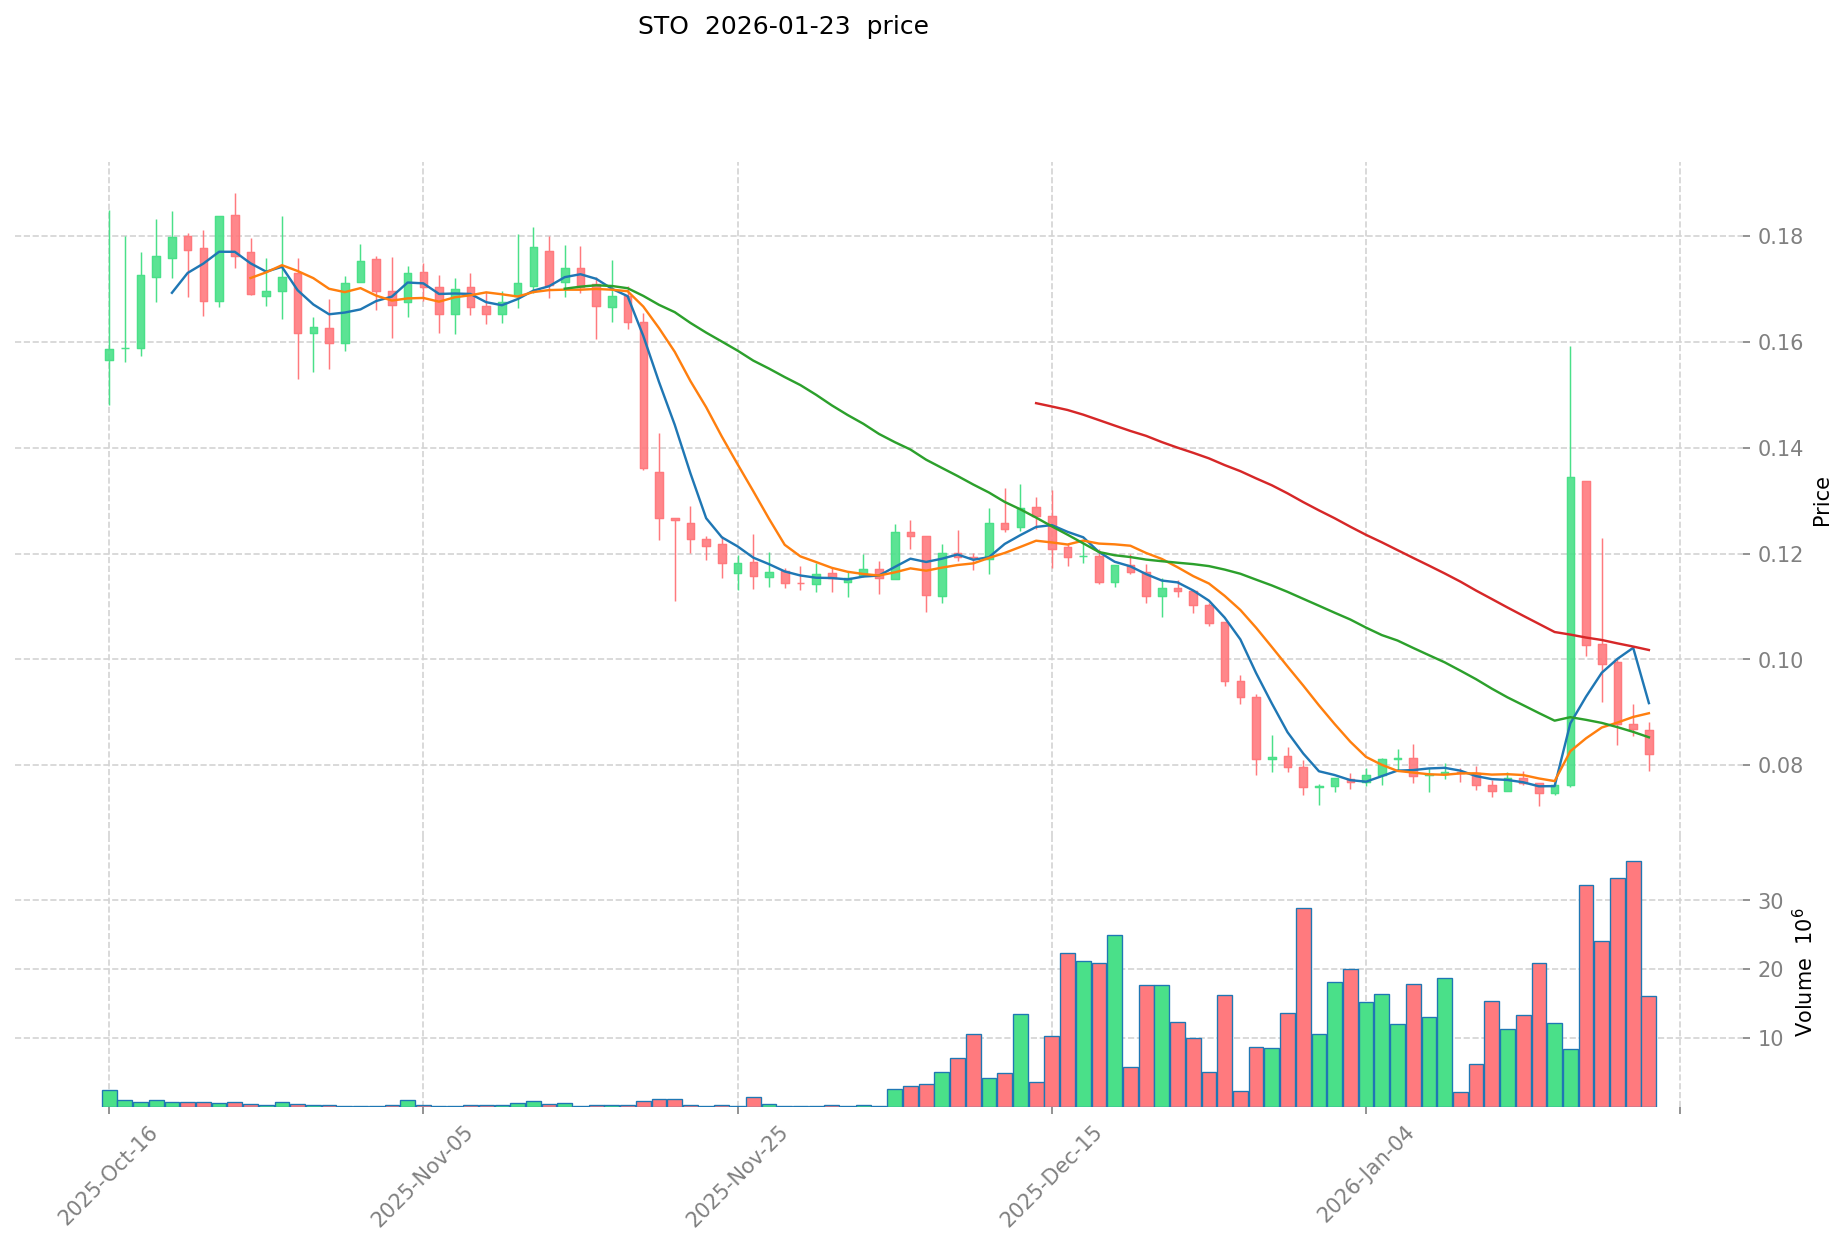
- 2025: STO reached its peak price of $0.2365 on May 2, 2025, marking a significant milestone in its early trading history
- 2025: The token experienced substantial volatility, dropping to its lowest recorded price of $0.0526 on April 7, 2025
- 2025-2026: Following the April low, STO demonstrated recovery momentum, with the current price of $0.08266 representing a 34.32% increase over the one-year period
STO Current Market Status
As of January 23, 2026, STO is trading at $0.08266, with a 24-hour trading volume of $1,444,355.28. The token has shown positive short-term momentum, gaining 1.64% in the past 24 hours and 9.09% over the past week. The intraday trading range spans from $0.07893 to $0.08427.
STO currently holds a market ranking of 909, with a circulating market capitalization of $18.63 million. The circulating supply stands at 225.33 million tokens, representing 22.53% of the maximum supply of 1 billion tokens. The fully diluted market capitalization is calculated at $82.66 million.
The token's market share within the broader cryptocurrency ecosystem is approximately 0.0026%. Recent price action indicates a 25.8% decline over the 30-day period, suggesting some consolidation following earlier gains. The market sentiment index currently reflects a reading of 24, indicating an environment of extreme fear.
STO is available for trading on 25 exchanges and has attracted 407 token holders. The token is deployed on multiple blockchain networks, with contract addresses on both Ethereum and BSC networks.
Click to view the current STO market price
STO Market Sentiment Index
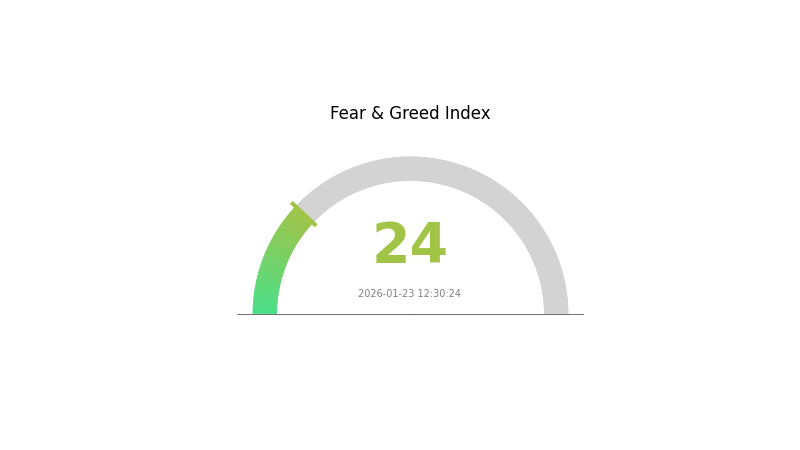
2026-01-23 Fear and Greed Index: 24 (Extreme Fear)
Click to view current Fear & Greed Index
The cryptocurrency market is currently experiencing extreme fear, with the Fear and Greed Index standing at 24. This exceptionally low reading reflects significant investor anxiety and bearish sentiment across the market. During periods of extreme fear, risk appetite diminishes substantially as traders become increasingly cautious. However, contrarian investors often view such extreme readings as potential buying opportunities, as excessive pessimism may indicate oversold conditions. Market participants should exercise careful risk management and consider their investment strategies in light of these heightened fear levels. Monitor market developments closely for potential turning points.
STO Holdings Distribution
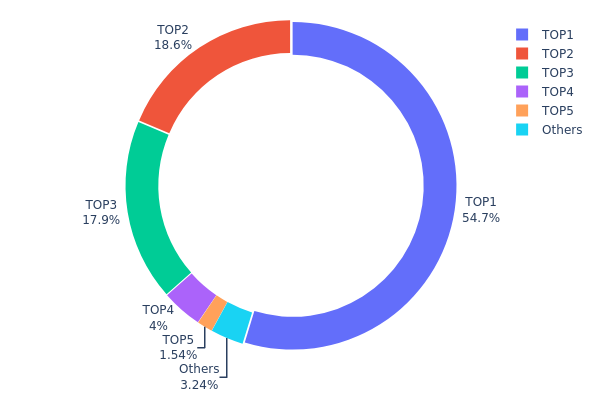
The holdings distribution chart illustrates the concentration of STO tokens across different wallet addresses, providing crucial insights into the token's ownership structure and decentralization level. According to the latest on-chain data as of January 23, 2026, STO demonstrates a highly centralized distribution pattern that warrants careful attention from market participants.
The top address (0x219f...f7c1ef) holds approximately 547.14 million tokens, accounting for 54.71% of the total supply. Combined with the second and third largest holders (0x63b8...e6d307 at 18.65% and 0xed8c...692808 at 17.86%), the top three addresses collectively control over 91% of the circulating supply. This concentration level significantly exceeds typical thresholds for healthy token distribution, with the remaining addresses outside the top five holding merely 3.25% collectively. Such extreme centralization suggests that a small number of entities possess substantial control over the token's market dynamics.
This distribution structure presents notable implications for market stability and price behavior. The dominant position of top holders creates potential risks for sharp price volatility, as large-scale transactions from these addresses could trigger significant market movements. Additionally, the concentrated ownership structure may facilitate price manipulation scenarios and reduces the token's resistance to coordinated selling pressure. From a decentralization perspective, STO's current distribution pattern indicates a relatively immature on-chain structure that may benefit from broader token dispersion to enhance market resilience and align with decentralized finance principles.
Click to view current STO Holdings Distribution
| Top |
Address |
Holding Qty |
Holding (%) |
| 1 |
0x219f...f7c1ef |
547138.75K |
54.71% |
| 2 |
0x63b8...e6d307 |
186500.00K |
18.65% |
| 3 |
0xed8c...692808 |
178600.00K |
17.86% |
| 4 |
0xa8f2...c62be9 |
40000.00K |
4.00% |
| 5 |
0x7b61...aebe78 |
15358.46K |
1.53% |
| - |
Others |
32402.79K |
3.25% |
II. Core Factors Influencing STO's Future Price
Based on the available information, there is insufficient data to provide a comprehensive analysis of the core factors that may influence STO's future price. The provided materials do not contain specific details regarding supply mechanisms, institutional dynamics, macroeconomic conditions, or technical developments related to STO.
Without verifiable data on these critical aspects, we cannot make informed assessments about:
- Supply mechanism structures and their historical impact on pricing
- Institutional holdings or corporate adoption patterns
- Relevant monetary policies or macroeconomic correlations
- Technical upgrades or ecosystem developments
For a thorough analysis of STO's price influencing factors, additional research materials and data sources would be necessary to ensure accuracy and avoid speculation.
III. 2026-2031 STO Price Prediction
2026 Outlook
- Conservative forecast: $0.06049 - $0.08286
- Neutral forecast: $0.08286
- Optimistic forecast: $0.12263 (subject to favorable market conditions and increased adoption)
2027-2029 Mid-term Outlook
- Market stage expectation: The token is anticipated to enter a gradual growth phase, with potential acceleration driven by broader market recovery and ecosystem development
- Price range forecast:
- 2027: $0.05959 - $0.15206 (24% projected increase)
- 2028: $0.09683 - $0.18983 (54% projected increase)
- 2029: $0.11262 - $0.23476 (91% projected increase)
- Key catalysts: Enhanced platform utility, strategic partnerships, and improved market sentiment across the crypto sector
2030-2031 Long-term Outlook
- Baseline scenario: $0.12785 - $0.27733 (assuming steady ecosystem growth and stable market conditions)
- Optimistic scenario: $0.19669 - $0.27967 (with accelerated adoption and favorable regulatory developments)
- Transformative scenario: Potential to reach $0.23701 average price by 2031 (under conditions of significant technological breakthroughs and mainstream integration)
- 2026-01-23: STO trading within initial range as market participants assess long-term value proposition
| Year |
Predicted High Price |
Predicted Average Price |
Predicted Low Price |
Price Change |
| 2026 |
0.12263 |
0.08286 |
0.06049 |
0 |
| 2027 |
0.15206 |
0.10275 |
0.05959 |
24 |
| 2028 |
0.18983 |
0.12741 |
0.09683 |
54 |
| 2029 |
0.23476 |
0.15862 |
0.11262 |
91 |
| 2030 |
0.27733 |
0.19669 |
0.12785 |
137 |
| 2031 |
0.27967 |
0.23701 |
0.2299 |
186 |
IV. STO Professional Investment Strategies and Risk Management
STO Investment Methodology
(1) Long-term Holding Strategy
- Suitable for: Investors seeking stable returns through liquidity infrastructure exposure
- Operational Recommendations:
- Establish positions during periods of lower volatility to optimize entry points
- Monitor StakeStone protocol development milestones and liquidity metrics as fundamental indicators
- Storage Solution: Utilize Gate Web3 Wallet for secure multi-chain asset management, supporting both ETH and BSC networks where STO is deployed
(2) Active Trading Strategy
- Technical Analysis Tools:
- Moving Averages: Track 50-day and 200-day MAs to identify trend reversals; current 7-day upward momentum of 9.09% may signal short-term strength
- Volume Analysis: Monitor daily trading volume against the current $1.44M baseline to confirm breakout validity
- Swing Trading Considerations:
- The 30-day decline of -25.8% suggests potential accumulation opportunities for contrarian traders
- Observe resistance near the 24H high of $0.08427 and support at $0.07893
STO Risk Management Framework
(1) Asset Allocation Principles
- Conservative Investors: 2-5% allocation to liquidity infrastructure tokens within overall crypto portfolio
- Aggressive Investors: 8-12% allocation with active position management
- Professional Investors: 10-15% allocation with derivatives hedging strategies
(2) Risk Hedging Solutions
- Portfolio Diversification: Balance STO exposure with stablecoin holdings and established Layer-1 assets
- Stop-Loss Implementation: Set trailing stops at 15-20% below entry to protect against volatility
(3) Secure Storage Solutions
- Hot Wallet Recommendation: Gate Web3 Wallet for active trading and DeFi integration
- Cold Storage Approach: Distribute larger holdings across hardware devices with multi-signature requirements
- Security Precautions: Never share private keys, verify contract addresses (0x1d88713b483a8e45cff0e5cd7c2e15e5fab4534d for ETH, 0xdaf1695c41327b61b9b9965ac6a5843a3198cf07 for BSC) before transactions, enable two-factor authentication
V. STO Potential Risks and Challenges
STO Market Risks
- Volatility Exposure: Price experienced -65% decline from ATH of $0.2365 to current levels, demonstrating significant drawdown potential
- Liquidity Concentration: With only 407 holders and $1.44M daily volume, order execution may face slippage during rapid market movements
- Market Cap Positioning: At rank 909 with 0.0026% dominance, the asset faces competition from established DeFi protocols
STO Regulatory Risks
- Jurisdictional Uncertainty: Liquidity infrastructure protocols may face evolving classification standards across different regulatory frameworks
- Compliance Requirements: Cross-chain operations on ETH and BSC networks require adherence to multiple jurisdictional guidelines
- Token Classification: Potential regulatory scrutiny regarding utility versus security token characteristics
STO Technical Risks
- Smart Contract Dependencies: Protocol relies on contract integrity across multiple chains; vulnerabilities could impact token value
- Cross-chain Bridge Risks: Omnichain architecture introduces potential attack vectors during asset transfers between networks
- Protocol Execution Risk: As a decentralized liquidity infrastructure, performance depends on sustained network activity and validator participation
VI. Conclusion and Action Recommendations
STO Investment Value Assessment
StakeStone (STO) presents an opportunity within the omnichain liquidity infrastructure sector, targeting the growing demand for efficient cross-chain asset flow in modular DeFi. The protocol's positioning addresses genuine market needs as blockchain ecosystems fragment across multiple layers. However, the asset's volatility profile, demonstrated by a -25.8% monthly decline alongside a +9.09% weekly recovery, indicates significant short-term price instability. With 22.53% of total supply circulating and a relatively small holder base, the token exhibits characteristics of an early-stage project with concentrated risk. Long-term value depends on protocol adoption rates, successful integration with major DeFi ecosystems, and the team's ability to capture liquidity routing market share.
STO Investment Recommendations
✅ Beginners: Approach with caution; allocate no more than 1-3% of crypto portfolio after thorough research into DeFi liquidity mechanisms. Consider dollar-cost averaging to mitigate entry timing risk.
✅ Experienced Investors: Evaluate position sizing based on risk tolerance, considering 5-8% allocation with active monitoring of protocol TVL metrics and competitive landscape developments. Implement systematic rebalancing rules.
✅ Institutional Investors: Conduct comprehensive due diligence on protocol architecture, team credentials, and smart contract audits. Consider strategic allocation of 3-7% within DeFi infrastructure basket, with quarterly performance reviews against sector benchmarks.
STO Trading Participation Methods
- Spot Trading: Execute purchases on Gate.com with ERC20 (ETH) or BEP20 (BSC) network options for direct ownership
- Liquidity Provision: Participate in decentralized liquidity pools where available to earn protocol fees, understanding impermanent loss risks
- Portfolio Integration: Combine STO holdings with correlated DeFi assets to create diversified exposure to infrastructure growth themes
Cryptocurrency investment carries extreme risk. This content does not constitute investment advice. Investors should make prudent decisions based on their risk tolerance and are advised to consult professional financial advisors. Never invest more than you can afford to lose.
FAQ
What is STO (Security Token Offering) and how does it differ from ICO?
STO is a regulated token offering backed by real assets or company equity, complying with securities laws. Unlike ICO, which offers utility tokens without legal oversight, STO provides investor protection, transparency, and legal compliance through proper registration and governance.
What are the main factors affecting STO token prices?
STO token prices are primarily influenced by trading volume, market demand, regulatory developments, project fundamentals, investor sentiment, macroeconomic conditions, and competitive landscape within the security token ecosystem.
How to conduct STO price prediction? What are the common analysis methods?
STO price prediction uses technical analysis(K-line patterns, moving averages), fundamental analysis(project metrics, transaction volume), and market sentiment analysis. Key indicators include trading amount trends, holder distribution, and on-chain data. Combined analysis provides comprehensive forecasting.
What are the risks to pay attention to when investing in STO?
STO investments involve market volatility, liquidity risks, regulatory changes, and issuer credit risks. Token values fluctuate based on market conditions. Early-stage projects carry higher risks. Conduct thorough due diligence before investing.
What are the future development prospects of the STO market?
The STO market shows strong potential with increasing institutional adoption, regulatory clarity, and growing tokenized asset volume. By 2026, we expect accelerated growth in real-world asset tokenization, expanded market liquidity, and mainstream integration across traditional finance sectors.
Which is more important in STO price prediction: technical analysis or fundamental analysis?
Both are essential. Technical analysis identifies entry/exit points through price patterns and trading volume trends. Fundamental analysis evaluates STO project value, tokenomics, and market adoption potential. Combining both provides optimal prediction accuracy for informed trading decisions.
What are the mainstream STO projects and how is their price performance?
Major STO projects include Polymath, Securitize, and Harbor. Polymath (POLY) showed growth momentum, Securitize maintained steady adoption in tokenized securities, and Harbor provides infrastructure solutions. Overall, STO tokens demonstrate positive momentum as institutional adoption increases and regulatory clarity improves in 2026.
* The information is not intended to be and does not constitute financial advice or any other recommendation of any sort offered or endorsed by Gate.