This comprehensive analysis examines TrustSwap (SWAP) as a decentralized payment platform token, currently trading at $0.0467 with a market cap of $4.67 million. The article delivers professional price forecasts spanning 2026-2031, ranging from conservative scenarios to optimistic projections exceeding $0.13, while analyzing historical price movements and ecosystem development trajectories. Core sections address critical investment factors including token supply mechanics, institutional dynamics, macroeconomic impacts, and technical infrastructure innovations. Practical investment strategies encompass long-term holding approaches, active trading methodologies, and comprehensive risk management frameworks tailored for different investor profiles. The analysis highlights market risks including high volatility and limited liquidity, alongside regulatory and technical challenges inherent to Ethereum-based DeFi protocols. For potential investors interested in SWAP trading on Gate.com, this guide provides actionabl
Introduction: SWAP's Market Position and Investment Value
TrustSwap (SWAP), positioned as an innovative decentralized payment platform designed to facilitate secure and reliable fund exchanges, has been operating since its launch in 2020. As of 2026, TrustSwap maintains a market capitalization of approximately $4.67 million, with a circulating supply of nearly 100 million tokens, and the price hovers around $0.0467. This asset, recognized as a time-locked payment solution in the DeFi ecosystem, is playing an increasingly important role in facilitating secure transactions and automated payment distribution.
This article will comprehensively analyze SWAP's price trends from 2026 to 2031, combining historical patterns, market supply and demand dynamics, ecosystem development, and macroeconomic conditions to provide investors with professional price forecasts and practical investment strategies.
I. SWAP Price History Review and Market Status
SWAP Historical Price Evolution Trajectory
- 2020: TrustSwap launched on July 10, with price reaching its historical low of $0.03124961
- 2021: On April 16, SWAP reached its all-time high of $5.00, representing a significant milestone in the project's early development phase
- 2025-2026: The token experienced considerable volatility, with price declining from higher levels to the current trading range
SWAP Current Market Situation
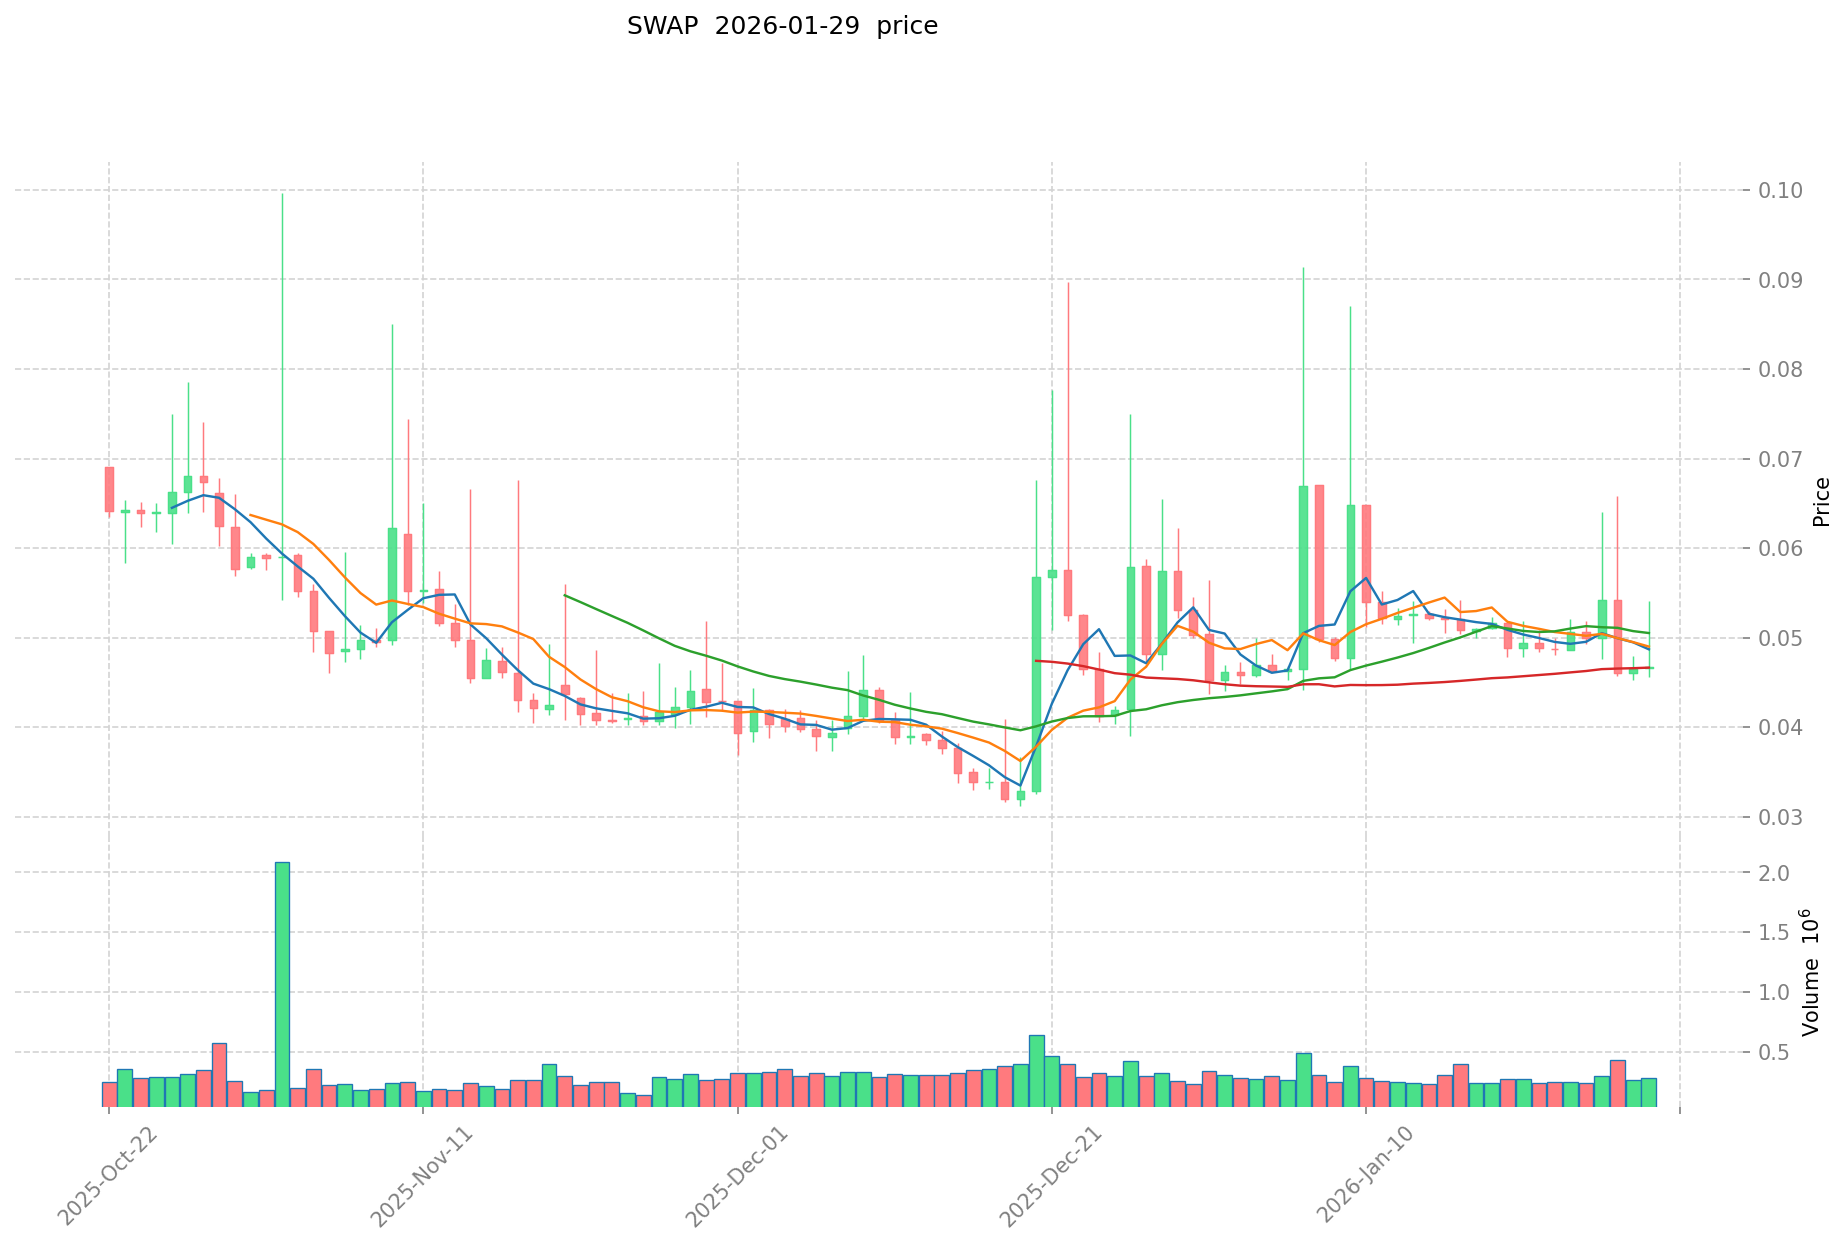
As of January 29, 2026, SWAP is trading at $0.04667, showing a 0.47% increase over the past 24 hours. The token has exhibited mixed short-term performance, with a slight decline of 0.24% in the past hour. The 24-hour trading range spans from $0.04561 to $0.05404, indicating moderate intraday volatility.
Over extended timeframes, SWAP has experienced downward pressure, declining 4.29% over the past week and 11.32% over the past month. The one-year performance shows a substantial decrease of 73.97%, reflecting broader market conditions and sector-specific dynamics.
The current market capitalization stands at approximately $4.67 million, with a circulating supply of 99,996,042.95 SWAP tokens, representing 99.99% of the maximum supply of 100 million tokens. The 24-hour trading volume registers at $13,585.66. TrustSwap maintains a market share of 0.00014% within the broader cryptocurrency ecosystem.
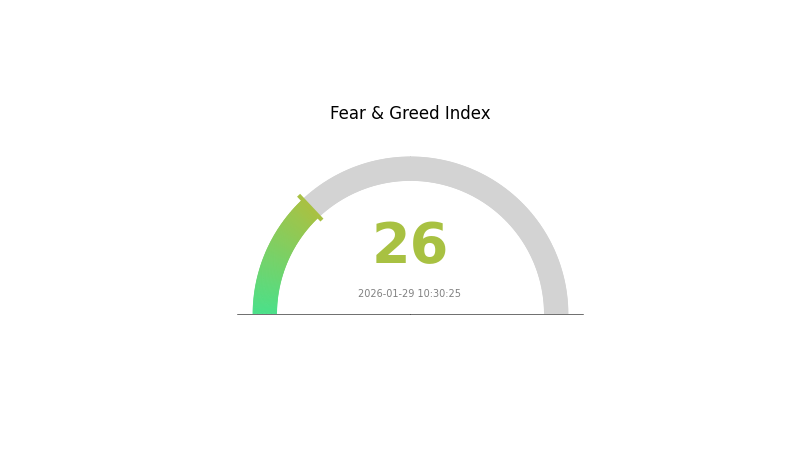
The Fear & Greed Index currently indicates a reading of 26, suggesting a "Fear" sentiment prevailing in the market. SWAP is held by approximately 17,637 addresses, demonstrating a distributed holder base. The token is deployed on the Ethereum network with the contract address 0xCC4304A31d09258b0029eA7FE63d032f52e44EFe and is available for trading on 5 exchanges, including Gate.com.
Click to view current SWAP market price
SWAP Market Sentiment Indicator
2026-01-29 Fear and Greed Index: 26 (Fear)
Click to view current Fear & Greed Index
The crypto market is currently in a fear state with an index of 26, indicating significant market pessimism and risk aversion among investors. This low reading suggests heightened uncertainty and defensive positioning in the market. During such periods, traders often reduce exposure and seek safer assets. The dominant fear sentiment creates potential opportunities for contrarian investors, though caution remains warranted. Market participants should closely monitor developments for signs of sentiment reversal while maintaining prudent risk management strategies.
SWAP Holding Distribution
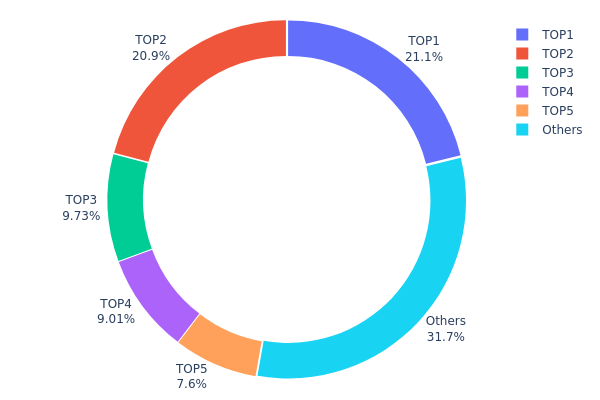
The holding distribution chart illustrates the concentration of token ownership across different wallet addresses, serving as a crucial indicator of decentralization and potential market manipulation risks. By analyzing the percentage of total supply held by top addresses, investors can assess whether the token's governance and price discovery mechanisms are sufficiently distributed or susceptible to whale influence.
Based on the current data, SWAP exhibits a moderate to high concentration pattern. The top five addresses collectively control approximately 68.31% of the total supply, with the leading two addresses alone holding over 41% combined. Specifically, the largest holder possesses 21.11% (21,115.35K tokens), while the second-ranked address holds 20.88% (20,888.72K tokens). The remaining "Others" category accounts for only 31.69%, indicating that a relatively small number of major holders dominate the token's circulation.
This concentration level presents both opportunities and risks for market participants. The dominance of large holders could lead to significant price volatility if any major address decides to liquidate positions, potentially triggering cascading sell pressure. Additionally, such distribution patterns raise concerns about governance centralization and susceptibility to coordinated market manipulation. However, if these top addresses represent protocol treasuries, liquidity pools, or long-term strategic investors, this concentration might reflect ecosystem stability rather than speculative risk. The relatively balanced distribution among the top five holders (no single address exceeding 22%) suggests some degree of power distribution, though the overall structure remains moderately centralized compared to ideally decentralized projects.
Click to view current SWAP Holding Distribution
| Top |
Address |
Holding Qty |
Holding (%) |
| 1 |
0x5696...32263e |
21115.35K |
21.11% |
| 2 |
0x688e...8ad440 |
20888.72K |
20.88% |
| 3 |
0x5a75...73d8cc |
9728.47K |
9.72% |
| 4 |
0x40ec...5bbbdf |
9004.94K |
9.00% |
| 5 |
0x43de...8398aa |
7604.43K |
7.60% |
| - |
Others |
31654.14K |
31.69% |
II. Core Factors Influencing SWAP's Future Price
Supply Mechanism
- Token Economics Structure: SWAP operates within the HyperSwap platform's decentralized exchange ecosystem, where supply dynamics are influenced by protocol-level token distribution and liquidity pool mechanics.
- Historical Patterns: Supply mechanisms have historically demonstrated sensitivity to market liquidity conditions, with token availability directly correlating to trading volume fluctuations and market participation levels.
- Current Impact: The ongoing development of core DEX infrastructure and AI-driven functionalities is expected to influence supply-side dynamics through enhanced protocol efficiency and increased user adoption metrics.
Institutional and Whale Dynamics
- Institutional Holdings: SWAP currently experiences limited institutional participation compared to established cryptocurrencies, with institutional adoption remaining in early stages due to infrastructure maturity and regulatory clarity constraints.
- Corporate Adoption: The HyperSwap platform continues developing its DeFi ecosystem, though specific enterprise-level adoption details remain under development as the protocol expands its technical capabilities.
- Regulatory Environment: Emerging compliance frameworks and KYC/AML policy developments are gradually shaping the institutional investment landscape, with regulatory clarity expected to influence future institutional positioning.
Macroeconomic Environment
- Monetary Policy Impact: Federal Reserve policy decisions and interest rate adjustments create ripple effects across cryptocurrency markets, with SWAP demonstrating particular sensitivity to broader liquidity conditions and risk sentiment shifts during Q1 and Q4 periods.
- Inflation Hedge Characteristics: While Bitcoin has established inflation hedge properties supported by institutional adoption and ETF infrastructure, SWAP's role in macroeconomic hedging remains emerging as the token develops independent valuation mechanisms through DeFi utility and protocol governance.
- Geopolitical Factors: Global risk sentiment and economic uncertainty influence cryptocurrency market dynamics broadly, with SWAP's correlation to Bitcoin remaining elevated during periods of significant geopolitical or regulatory developments.
Technical Development and Ecosystem Building
- AMM Model Innovation: HyperSwap's automated market maker architecture enables enhanced transaction throughput and reduced fee structures, positioning the platform competitively within the DeFi trading landscape.
- Parallel Transaction Processing: Technical infrastructure supporting concurrent transaction execution provides scalability advantages particularly relevant for high-frequency trading scenarios and DeFi application integration.
- Ecosystem Applications: The development of AI-driven functionalities and core DEX infrastructure expansion represents ongoing technical evolution, with protocol upgrades and governance mechanisms forming the foundation for independent price discovery mechanisms separate from Bitcoin correlation patterns.
III. 2026-2031 SWAP Price Predictions
2026 Outlook
- Conservative Prediction: $0.0407 - $0.04678
- Neutral Prediction: $0.04678
- Optimistic Prediction: $0.05801 (requires favorable market conditions and increased adoption)
2027-2029 Outlook
- Market Stage Expectation: Progressive growth phase with gradual price appreciation as the ecosystem matures
- Price Range Predictions:
- 2027: $0.03772 - $0.06182
- 2028: $0.0297 - $0.08338
- 2029: $0.06181 - $0.09834
- Key Catalysts: Enhanced liquidity mechanisms, protocol upgrades, and broader DeFi integration driving sustained momentum
2030-2031 Long-term Outlook
- Baseline Scenario: $0.0472 - $0.1197 (assuming steady ecosystem development and moderate market growth)
- Optimistic Scenario: $0.08429 - $0.13973 (contingent on significant protocol adoption and favorable regulatory environment)
- Transformative Scenario: Up to $0.13973 (requires exceptional market conditions, widespread institutional adoption, and major technological breakthroughs)
- 2026-01-29: SWAP currently positioned at the early stage of its projected growth trajectory
| Year |
Predicted High Price |
Predicted Average Price |
Predicted Low Price |
Price Change |
| 2026 |
0.05801 |
0.04678 |
0.0407 |
0 |
| 2027 |
0.06182 |
0.05239 |
0.03772 |
12 |
| 2028 |
0.08338 |
0.05711 |
0.0297 |
22 |
| 2029 |
0.09834 |
0.07024 |
0.06181 |
50 |
| 2030 |
0.1197 |
0.08429 |
0.0472 |
80 |
| 2031 |
0.13973 |
0.10199 |
0.09689 |
118 |
IV. SWAP Professional Investment Strategies and Risk Management
SWAP Investment Methodology
(1) Long-term Holding Strategy
- Suitable for: Investors who believe in decentralized payment infrastructure and DeFi ecosystem development
- Operational Recommendations:
- Consider dollar-cost averaging to accumulate positions during market downturns, given the token's significant decline from historical highs
- Monitor TrustSwap platform adoption metrics and partnership developments to assess long-term value proposition
- Utilize Gate Web3 Wallet for secure storage with multi-signature protection and regular security audits
(2) Active Trading Strategy
- Technical Analysis Tools:
- Moving Averages: Use 50-day and 200-day moving averages to identify trend reversals, particularly relevant given recent 7-day decline of 4.29%
- Volume Analysis: Monitor trading volume patterns, with current 24-hour volume at approximately $13,585, to confirm breakout signals
- Swing Trading Considerations:
- Establish position limits based on the token's moderate volatility, with 24-hour price range between $0.04561 and $0.05404
- Set stop-loss orders at 5-8% below entry points to manage downside risk in volatile conditions
SWAP Risk Management Framework
(1) Asset Allocation Principles
- Conservative Investors: 1-2% of total crypto portfolio allocation
- Aggressive Investors: 3-5% allocation with active monitoring
- Professional Investors: Up to 5-7% with hedging strategies and deep market analysis
(2) Risk Hedging Solutions
- Diversification Strategy: Balance SWAP holdings with established DeFi tokens and stablecoins to reduce sector-specific risk
- Position Sizing: Limit single-position exposure considering the token's relatively small market capitalization of approximately $4.67 million
(3) Secure Storage Solutions
- Hot Wallet Recommendation: Gate Web3 Wallet for active trading with enhanced security features and seamless integration
- Cold Storage Solution: Hardware wallet storage for long-term holdings exceeding trading needs, ensuring private key security
- Security Precautions: Never share private keys, enable two-factor authentication, regularly update wallet software, and verify contract addresses before transactions
V. SWAP Potential Risks and Challenges
SWAP Market Risks
- High Volatility: The token has experienced a 73.97% decline over the past year, indicating significant price instability and market uncertainty
- Limited Liquidity: With a market capitalization of approximately $4.67 million and ranking at 1568, the token faces potential liquidity constraints during large transactions
- Exchange Availability: Currently listed on 5 exchanges, which may limit trading opportunities and price discovery compared to more widely distributed assets
SWAP Regulatory Risks
- DeFi Compliance Uncertainty: Payment platforms using blockchain technology face evolving regulatory frameworks across different jurisdictions
- Token Classification: Potential regulatory scrutiny regarding token utility versus security classification could impact trading and operational viability
- Cross-border Payment Regulations: As TrustSwap facilitates fund transfers, it may face increasing compliance requirements related to anti-money laundering and know-your-customer protocols
SWAP Technical Risks
- Smart Contract Vulnerabilities: As an Ethereum-based token deployed at contract address 0xCC4304A31d09258b0029eA7FE63d032f52e44EFe, the platform remains exposed to potential smart contract exploits
- Ethereum Network Dependency: Platform performance and transaction costs are directly affected by Ethereum network congestion and gas fee fluctuations
- Platform Adoption Risk: The success of SWAP token value depends on sustained user adoption of TrustSwap payment services, which faces competition from established payment solutions
VI. Conclusion and Action Recommendations
SWAP Investment Value Assessment
TrustSwap represents a niche player in the decentralized payment and fund exchange sector, offering automated time-locked payment solutions on the Ethereum blockchain. While the platform addresses legitimate use cases in trustless fund transfers, the token faces considerable challenges reflected in its 73.97% annual decline and relatively modest market presence. The nearly 100% circulating supply (99.996% of 100 million max supply) eliminates future dilution concerns, but limited exchange availability and modest trading volume suggest reduced market interest. Long-term value depends heavily on successful platform adoption and differentiation in an increasingly competitive DeFi landscape.
SWAP Investment Recommendations
✅ Beginners: Approach with extreme caution—allocate only minimal portfolio percentage (under 1%) if interested, and thoroughly research DeFi payment solutions before investment
✅ Experienced Investors: Consider small speculative positions if bullish on decentralized payment infrastructure, but maintain strict risk management given price volatility and market cap constraints
✅ Institutional Investors: Conduct comprehensive due diligence on platform adoption metrics, smart contract audits, and competitive positioning before considering any material allocation
SWAP Trading Participation Methods
- Spot Trading: Purchase SWAP tokens on Gate.com with USDT or other trading pairs for direct exposure to price movements
- Dollar-Cost Averaging: Establish systematic purchase schedules to accumulate positions gradually and mitigate timing risk
- Gate Web3 Wallet Integration: Utilize Gate Web3 Wallet for seamless on-chain interactions, DeFi participation, and secure self-custody of SWAP tokens
Cryptocurrency investments carry extremely high risks. This article does not constitute investment advice. Investors should make prudent decisions based on their own risk tolerance and are advised to consult professional financial advisors. Never invest more than you can afford to lose.
FAQ
What is SWAP and how does it affect token price?
SWAP is a decentralized exchange token whose price is driven by supply and market demand. High trading volume and liquidity increase price, while token scarcity and utility within the ecosystem enhance value.
SWAP price prediction relies on technical analysis using moving averages, RSI, and MACD indicators. Analyze trading volume, market trends, and liquidity depth. Use charting tools and on-chain analytics to identify support/resistance levels and trend patterns for accurate predictions.
What are the main factors affecting SWAP trading pair price fluctuations?
SWAP price fluctuations are primarily driven by market sentiment, trading volume, protocol upgrades, and regulatory changes. News announcements and partnership developments also significantly impact price movements.
What are the risks in SWAP trading and how to avoid slippage losses?
Main risks include slippage losses from price volatility and market depth insufficiency. Mitigate by splitting large trades into smaller portions, setting strict slippage tolerance limits, choosing pools with higher liquidity, and using aggregators to optimize best execution routes and minimize price impact.
Different DEX platforms offer varying SWAP prices due to distinct pricing algorithms, liquidity pools, trading volumes, and fee structures. Each platform's market conditions and supply-demand dynamics create price differences across decentralized exchanges.
How does SWAP liquidity affect price prediction?
Higher SWAP liquidity reduces price volatility and minimizes price impact from trades. Lower liquidity causes larger price swings. Greater liquidity enables smoother price discovery and more stable predictions.
* The information is not intended to be and does not constitute financial advice or any other recommendation of any sort offered or endorsed by Gate.