This comprehensive guide provides expert analysis and forecasts for Trusta.AI (TA) token pricing through 2031. Currently trading at $0.0371 with a $6.68 million market cap, TA functions as a trusted identity network for AI and cryptocurrency ecosystems. The article examines historical price evolution, current market sentiment showing fear indicators, and token concentration risks with top holders controlling 81.95% of supply. Core price drivers include supply mechanisms, market sentiment, macroeconomic conditions, and technical patterns. Forecasts predict conservative 2026 ranges of $0.02451-$0.03713, with potential growth to $0.07128 by 2031. Professional investment strategies encompass long-term holding for AI believers and active trading approaches using technical indicators. Risk management frameworks address high volatility, limited liquidity across 5 Gate exchanges, and regulatory uncertainties. Suitable for beginners through institutional investors seeking exposure to AI-blockchain identity verificatio
Introduction: TA's Market Position and Investment Value
Trusta.AI (TA), positioning itself as a trusted identity network for AI and cryptocurrency, aims to establish a universal credit system for all forms of intelligence—both human and artificial. Since its launch in 2025, the project has developed a reputation within the AI-driven blockchain ecosystem. As of January 28, 2026, TA maintains a market capitalization of approximately $6.68 million, with a circulating supply of 180 million tokens, and the price is hovering around $0.0371. This asset, often regarded as an emerging player in the AI and crypto identity verification space, is playing an increasingly important role in building trust infrastructure for decentralized applications.
This article will comprehensively analyze TA's price trends from 2026 to 2031, combining historical patterns, market supply and demand dynamics, ecosystem development, and macroeconomic conditions to provide investors with professional price forecasts and practical investment strategies.
I. TA Price History Review and Market Status
TA Historical Price Evolution Trajectory
- 2025: Initial token launch in November at $0.1, followed by notable price volatility throughout the quarter
- 2025: Token experienced significant fluctuation, reaching a peak of $0.3854 in early September before declining to $0.01652 in October, representing substantial market adjustment
TA Current Market Situation
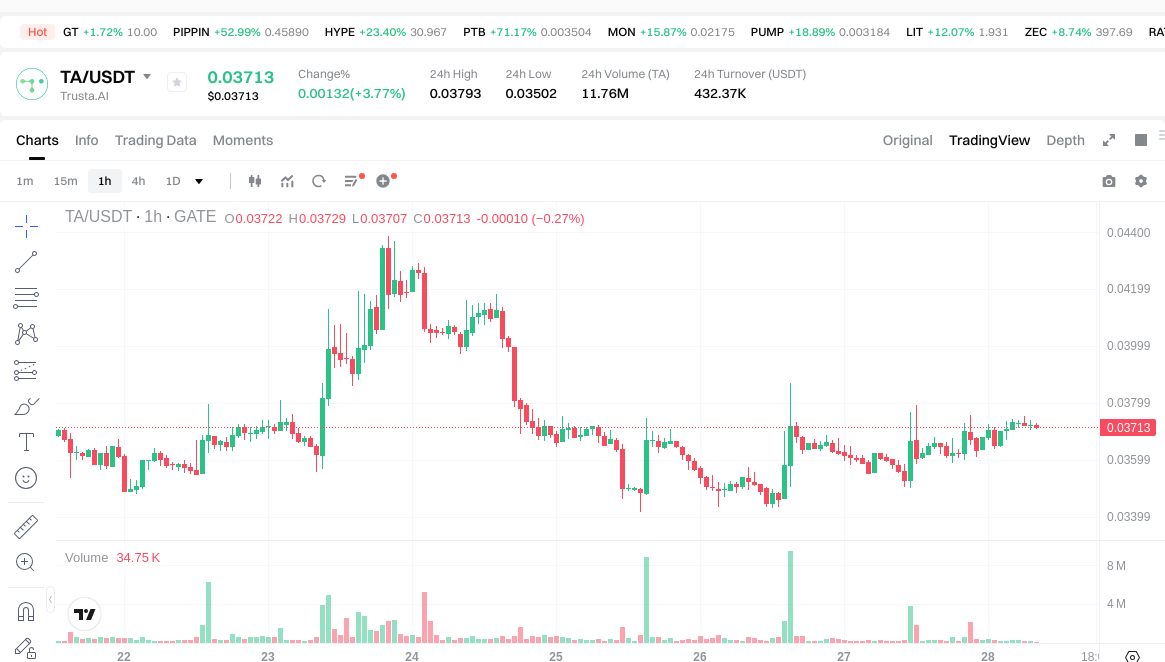
As of January 28, 2026, TA is trading at $0.0371, showing recent positive momentum with a 3.6% increase over the past 24 hours and 4.19% gain over the past week. The token demonstrates stronger performance over the 30-day period with a 49.14% increase.
The current market capitalization stands at $6.678 million, with a fully diluted valuation of $37.1 million. The circulating supply represents 18% of the total supply, with 180 million tokens in circulation out of 1 billion maximum supply. Trading volume over the past 24 hours reached $432,599.46, indicating moderate market activity.
The token is available on 5 exchanges and holds a market dominance of 0.0011%. Current price levels show TA trading within a 24-hour range between $0.03502 and $0.03793. The token remains significantly below its September 2025 peak, currently down approximately 90% from that level, while maintaining a notable increase from its October 2025 low point.
Trusta.AI operates as a trusted identity network project in the AI and crypto space, implementing token standards BEP-20 and Linea, with a holder base of 3,078 participants.
Click to view current TA market price
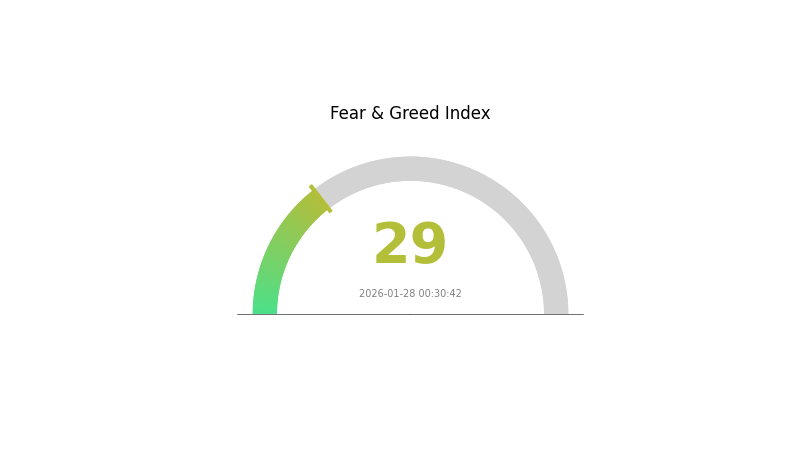
TA Market Sentiment Indicator
2026-01-28 Fear and Greed Index: 29 (Fear)
Click to view current Fear & Greed Index
The cryptocurrency market is currently experiencing a fear sentiment with an index reading of 29. This indicates heightened market anxiety and risk aversion among investors. When fear dominates, price volatility typically increases as traders become more cautious. This environment often presents opportunities for contrarian investors to accumulate assets at lower valuations. However, caution is advised as further downside moves remain possible. Monitor key support levels and market developments closely before making investment decisions.
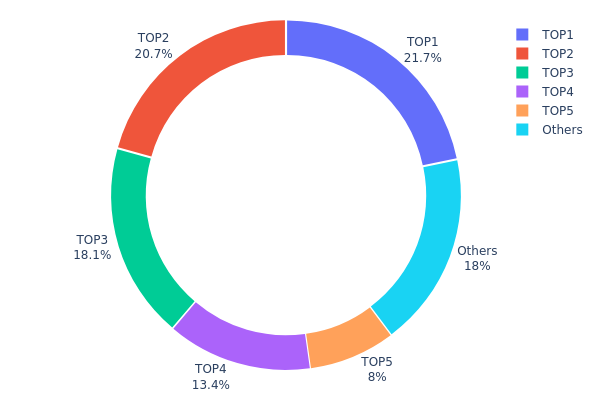
TA Holdings Distribution
The holdings distribution chart reveals the concentration of TA tokens across different wallet addresses, providing crucial insights into the decentralization level and potential market manipulation risks. By examining how tokens are distributed among top holders versus smaller participants, analysts can assess the project's structural stability and evaluate potential price volatility triggers.
Current data indicates a highly concentrated distribution pattern, with the top five addresses controlling approximately 81.95% of the total token supply. The leading address holds 210,000K tokens (21.72%), followed closely by the second-largest holder with 200,000K tokens (20.69%). The third and fourth positions represent 18.10% and 13.44% respectively, while the fifth-largest wallet accounts for 8.00% of circulating supply. The remaining 18.05% is distributed among other addresses, suggesting limited token circulation beyond major stakeholders.
This concentration level presents significant implications for market dynamics. The dominance of top holders creates potential price manipulation vulnerabilities, as coordinated selling from these addresses could trigger substantial market disruptions. Additionally, such centralization reduces the project's decentralization characteristics, potentially affecting investor confidence and limiting organic trading activity. The relatively small percentage held by diverse participants may constrain liquidity depth and increase susceptibility to volatility during market stress periods.
Click to view current TA Holdings Distribution
| Top |
Address |
Holding Qty |
Holding (%) |
| 1 |
0x9581...88e952 |
210000.00K |
21.72% |
| 2 |
0xc413...740d97 |
200000.00K |
20.69% |
| 3 |
0x1b9d...261821 |
175000.00K |
18.10% |
| 4 |
0x6148...882ec0 |
130000.00K |
13.44% |
| 5 |
0xf89d...5eaa40 |
77361.11K |
8.00% |
| - |
Others |
174265.63K |
18.05% |
II. Core Factors Influencing TA's Future Price
Supply Mechanism
- Historical Patterns: Supply changes have historically influenced price movements, with supply increases often leading to downward price pressure.
- Current Impact: Existing supply dynamics are expected to continue affecting future price trends.
Market Sentiment and Speculation
- Investor Psychology: Market sentiment plays a decisive role in price fluctuations, with fear and greed dominating trading behavior. The crypto market is highly susceptible to speculative sentiment, with prices often deviating from fundamental values.
- FOMO and Market Cycles: Fear of missing out (FOMO) frequently drives rapid price movements, particularly during periods of heightened market activity.
Institutional and Large Holder Dynamics
- Institutional Holdings: The behavior and positioning of major institutions continue to influence market direction and liquidity conditions.
- Market Concentration: Large holder activities can create significant price impacts due to concentrated ownership patterns.
Macroeconomic Environment
- Monetary Policy Impact: Global monetary conditions and liquidity trends affect risk asset valuations, including digital assets like TA.
- Inflation Dynamics: The current environment features structural inflation patterns, primarily occurring in industrial sectors rather than consumer segments. This creates a complex backdrop for asset price movements.
- Geopolitical Factors: International tensions and trade disputes contribute to supply uncertainty and risk premiums across commodity and digital asset markets.
Technical Analysis Framework
- Price Action Analysis: Historical price movements and trading volume patterns provide insights into potential future behavior through the analysis of supply-demand dynamics.
- Market Structure: Technical analysis effectiveness depends on sufficient trading volume and liquidity, as high-volume markets are less susceptible to manipulation and external anomalies.
III. 2026-2031 TA Price Prediction
2026 Outlook
- Conservative forecast: $0.02451 - $0.03713
- Neutral forecast: $0.03713
- Optimistic forecast: $0.05384 (contingent on favorable market conditions)
2027-2029 Outlook
- Market stage expectation: Gradual upward trajectory with potential consolidation phases as the token seeks to establish stronger market positioning
- Price range predictions:
- 2027: $0.02593 - $0.06277 (approximately 22% increase from 2026 baseline)
- 2028: $0.03843 - $0.07145 (approximately 45% increase from 2026 baseline)
- 2029: $0.05148 - $0.0653 (approximately 69% increase from 2026 baseline)
- Key catalysts: Market adoption trends, technological developments within the ecosystem, and broader cryptocurrency market sentiment
2030-2031 Long-term Outlook
- Baseline scenario: $0.05444 - $0.07173 (assuming continued market maturation and steady adoption)
- Optimistic scenario: $0.06404 - $0.07173 in 2030 (approximately 72% increase from 2026 baseline, assuming enhanced utility and expanded user base)
- Progressive scenario: $0.0353 - $0.07128 in 2031 (approximately 82% increase from 2026 baseline, reflecting sustained growth momentum)
- January 28, 2026: TA price forecasts indicate potential multi-year appreciation trajectory with baseline projections showing steady growth
| Year |
Predicted High Price |
Predicted Average Price |
Predicted Low Price |
Price Change |
| 2026 |
0.05384 |
0.03713 |
0.02451 |
0 |
| 2027 |
0.06277 |
0.04548 |
0.02593 |
22 |
| 2028 |
0.07145 |
0.05413 |
0.03843 |
45 |
| 2029 |
0.0653 |
0.06279 |
0.05148 |
69 |
| 2030 |
0.07173 |
0.06404 |
0.05444 |
72 |
| 2031 |
0.07128 |
0.06788 |
0.0353 |
82 |
IV. TA Professional Investment Strategy and Risk Management
TA Investment Methodology
(1) Long-term Holding Strategy
- Suitable for: Investors who believe in AI-driven identity verification and cross-chain credit systems
- Operational Recommendations:
- Consider accumulating positions during market corrections when price volatility increases
- Monitor project development milestones and partnership announcements that may impact long-term value
- Utilize Gate Web3 Wallet for secure long-term storage with multi-signature protection
(2) Active Trading Strategy
- Technical Analysis Tools:
- Moving Averages: Use 7-day and 30-day moving averages to identify trend reversals; TA has shown 4.19% weekly growth and 49.14% monthly growth, indicating potential upward momentum
- Volume Analysis: Monitor the 24-hour trading volume of $432,599 to gauge market interest and liquidity conditions
- Swing Trading Considerations:
- Set stop-loss orders around 5-8% below entry points to manage downside risk
- Take partial profits at resistance levels, considering the token's historical high of $0.3854
TA Risk Management Framework
(1) Asset Allocation Principles
- Conservative Investors: 1-3% of crypto portfolio
- Aggressive Investors: 5-10% of crypto portfolio
- Professional Investors: May allocate up to 15% based on comprehensive due diligence and risk assessment
(2) Risk Hedging Solutions
- Diversification Strategy: Balance TA holdings with established cryptocurrencies and stablecoins to reduce portfolio volatility
- Position Sizing: Never allocate more than you can afford to lose, especially considering TA's 18% circulating supply ratio
(3) Secure Storage Solutions
- Hot Wallet Recommendation: Gate Web3 Wallet for convenient trading and staking activities
- Cold Storage Option: Hardware wallets for long-term holdings exceeding significant value thresholds
- Security Precautions: Enable two-factor authentication, regularly update security settings, and never share private keys or seed phrases
V. TA Potential Risks and Challenges
TA Market Risks
- High Volatility: With a 24-hour price fluctuation between $0.03502 and $0.03793, TA exhibits significant short-term price movements
- Limited Liquidity: Trading on only 5 exchanges with a market cap of $6.68 million may result in price slippage during large transactions
- Low Market Dominance: With 0.0011% market share, TA is susceptible to broader market trends and sentiment shifts
TA Regulatory Risks
- AI Technology Scrutiny: Increasing global regulatory attention on AI applications may impact projects combining AI with blockchain
- Cross-jurisdictional Compliance: As a project operating across multiple chains (BSC, Linea), TA may face varied regulatory requirements in different regions
- Identity Verification Standards: Evolving data privacy regulations could affect the project's core identity network functionality
TA Technical Risks
- Smart Contract Vulnerabilities: Multi-chain deployment increases potential attack surfaces across BSC and Linea networks
- Network Dependencies: Project performance relies on the stability and security of underlying blockchain infrastructures
- Technology Integration Challenges: Combining AI with blockchain identity systems presents complex technical hurdles that may affect development timelines
VI. Conclusion and Action Recommendations
TA Investment Value Assessment
Trusta.AI presents an innovative approach to creating trusted identity networks in the AI era, addressing a critical need for universal credit systems across human and artificial intelligence. The project has demonstrated notable short-term momentum with 49.14% monthly growth and maintains a relatively low fully diluted market cap of $37.1 million, suggesting potential upside if adoption increases. However, investors should weigh this against the token's early-stage development, with only 18% of total supply in circulation and limited exchange availability. The convergence of AI and blockchain identity solutions represents a growing sector, but execution risks and market volatility remain significant considerations.
TA Investment Recommendations
✅ Beginners: Start with small positions (1-2% of crypto portfolio) and use Gate.com's spot trading to understand price behavior before increasing exposure. Focus on learning about the project's fundamentals and AI-blockchain intersection.
✅ Experienced Investors: Consider position building during market corrections while monitoring project development updates and partnership announcements. Implement technical analysis strategies using the 7-day and 30-day performance trends as reference points.
✅ Institutional Investors: Conduct comprehensive due diligence on the project's technology stack, team credentials, and competitive positioning within the AI identity verification space. Evaluate liquidity conditions and consider OTC transactions for larger positions to minimize market impact.
TA Trading Participation Methods
- Spot Trading: Purchase TA directly on Gate.com with USDT or other trading pairs for immediate ownership and lower risk exposure
- Dollar-Cost Averaging: Implement systematic purchase plans to reduce timing risk and build positions gradually over predetermined intervals
- Staking and Holding: Utilize Gate Web3 Wallet for secure storage while monitoring potential staking or reward programs that may emerge as the ecosystem develops
Cryptocurrency investment carries extremely high risks, and this article does not constitute investment advice. Investors should make prudent decisions based on their own risk tolerance and are advised to consult professional financial advisors. Never invest more than you can afford to lose.
FAQ
What is Technical Analysis (TA) Price Prediction? What are the main indicators used?
Technical Analysis price prediction analyzes price charts to forecast market trends using key indicators such as Moving Averages (MAs), Bollinger Bands (BB), and Relative Strength Index (RSI) to identify trading opportunities.
How to use moving averages, MACD, RSI and other technical indicators for price prediction?
Moving averages, MACD, and RSI help identify trends and potential reversal points. Use moving average crossovers for trend signals, RSI to detect overbought/oversold conditions above 70 or below 30, and MACD crossovers for momentum confirmation. Combine multiple indicators for higher accuracy.
How accurate is technical analysis price prediction? What are its limitations?
Technical analysis prediction accuracy typically ranges from 70-85%, but faces limitations including sudden market shifts, data overfitting, and inability to account for major geopolitical or macroeconomic events. Accuracy varies based on market conditions and timeframes.
What is the difference between short-term and long-term TA price prediction methods?
Short-term TA focuses on immediate price fluctuations using technical indicators like moving averages and support/resistance levels. Long-term TA analyzes broader market trends, volume patterns, and chart formations over extended periods to identify sustained price directions.
What are the common chart patterns in TA price prediction? How to identify and apply them?
Common TA chart patterns include bullish engulfing, inverted hammer, and morning star. Identify these patterns by analyzing candlestick formations and trading volume. Apply them to determine optimal entry and exit points for predicting price movements and market trends.
How to combine multiple technical indicators to improve price prediction reliability?
Combine indicators like SMA and RSI to capture both long-term trends and short-term fluctuations simultaneously. Use moving averages for trend direction, momentum indicators for overbought/oversold signals, and trading volume for confirmation. Dynamic strategy adjustment based on market conditions enhances prediction accuracy.
Is the application effect of TA price prediction the same in cryptocurrency and stock markets?
TA application effects differ between crypto and stock markets due to distinct market structures and trading behaviors. While support and resistance levels work in both, crypto markets show higher volatility and 24/7 trading patterns. Effectiveness varies by strategy and market conditions.
Beginners should start with Moving Averages(MA), Relative Strength Index(RSI), and MACD. These foundational indicators help identify trends, momentum, and entry/exit signals. Master these before advancing to more complex tools.
* The information is not intended to be and does not constitute financial advice or any other recommendation of any sort offered or endorsed by Gate.