This comprehensive analysis examines Taraxa (TARA), an IoT-focused blockchain platform trading at $0.0003109 with a $1.87 million market cap, providing expert price predictions spanning 2026-2031. The article evaluates TARA's historical performance, current market sentiment (extreme fear at 14), and supply-demand dynamics to forecast potential price ranges from $0.0002-$0.00069 by 2031. Key sections cover technological developments, ecosystem growth catalysts, and macroeconomic factors influencing token valuation. The analysis presents tiered investment strategies for beginners, experienced investors, and institutions, emphasizing rigorous risk management given the token's high volatility, limited liquidity across only three exchanges including Gate, and 94.41% yearly decline. Practical recommendations include dollar-cost averaging, position sizing constraints, and secure storage via Gate Web3 Wallet for TARA holders seeking long-term IoT blockchain exposure.
Introduction: TARA's Market Position and Investment Value
Taraxa (TARA), positioned as a fast and scalable IoT-friendly public ledger designed to enhance trust, privacy, and value within the Internet of Things ecosystem, has been developing since its launch in 2021. As of February 2026, TARA maintains a market capitalization of approximately $1.87 million, with a circulating supply of around 6.02 billion tokens and a price hovering near $0.0003109. This asset, recognized for its innovative Block-DAG topology and concurrent processing VM architecture, is playing an increasingly important role in enabling secure device-to-device services and transactions within IoT networks.
This article will comprehensively analyze TARA's price trajectory from 2026 to 2031, combining historical patterns, market supply-demand dynamics, ecosystem development, and macroeconomic conditions to provide investors with professional price forecasts and practical investment strategies.
I. TARA Price History Review and Market Status
TARA Historical Price Evolution Trajectory
- March 2021: Token launched on Gate.com at $0.01, reaching a peak of $0.07045 on March 22, 2021, representing a 604.5% increase from the launch price
- 2022-2024: Market entered an extended consolidation phase, with price gradually declining from previous peaks
- December 2025: Price touched a low of $0.00019902 on December 23, 2025, marking a significant decline of over 99% from the March 2021 peak
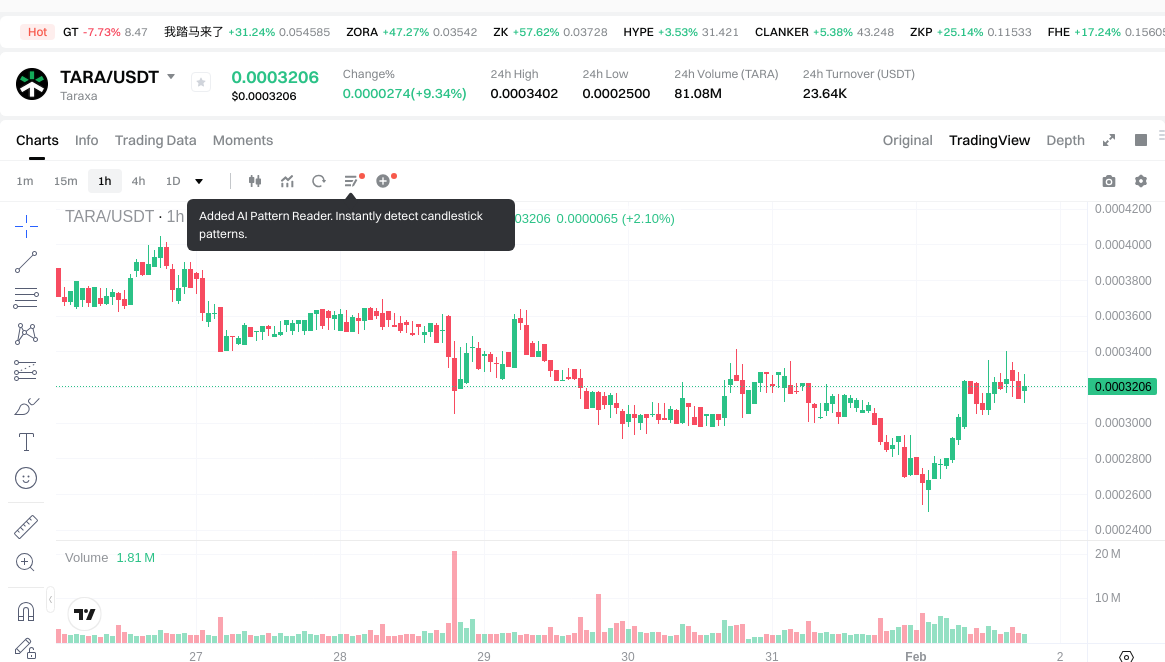
TARA Current Market Status
As of February 1, 2026, TARA is trading at $0.0003109, showing a 7.86% increase over the past 24 hours. The 24-hour trading range spans from $0.00025 to $0.0003402, with total trading volume reaching $23,989.88.
Over different time horizons, TARA has experienced varied price movements: a slight decline of 0.25% in the past hour, a 21.029% decrease over the past 7 days, and a 31.95% decline over the past 30 days. The 1-year performance shows a substantial decline of 94.41%.
The token currently holds a market capitalization of approximately $1.87 million, with a circulating supply of 6.02 billion TARA tokens, representing 50.2% of the total supply of 10.96 billion tokens. The fully diluted market cap stands at approximately $3.41 million. TARA ranks 2088 in the cryptocurrency market, with a market dominance of 0.00012%. The current market sentiment indicator shows a reading of 14, classified as "Extreme Fear," reflecting heightened caution among market participants.
With approximately 1,132 token holders and availability on 3 exchanges, TARA maintains a presence in the broader cryptocurrency ecosystem. The maximum supply is capped at 12 billion tokens.
Click to view current TARA market price
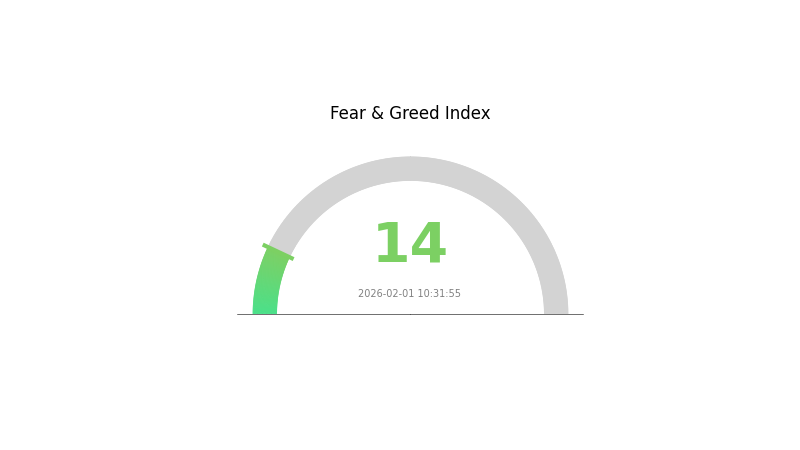
TARA Market Sentiment Indicator
2026-02-01 Fear and Greed Index: 14 (Extreme Fear)
Click to view current Fear & Greed Index
The cryptocurrency market is currently experiencing extreme fear, with the Fear and Greed Index standing at 14. This indicates significant market pessimism and heightened investor anxiety. During such periods, risk-averse traders typically reduce positions, while contrarian investors may view this as a potential buying opportunity. The extreme fear sentiment often precedes market recoveries, as prices approach capitulation levels. Traders should exercise caution and conduct thorough analysis before making investment decisions in this volatile environment.
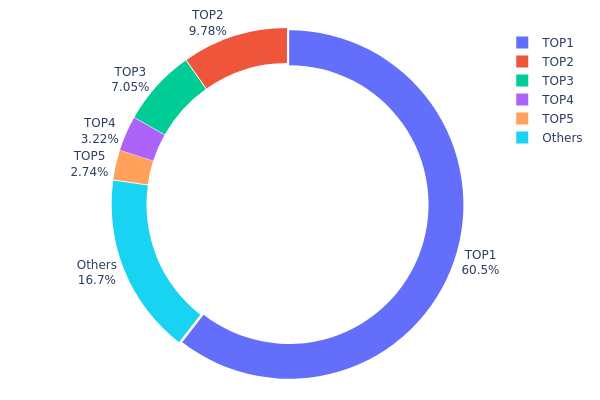
TARA Token Holding Distribution
The token holding distribution chart reflects the concentration of asset allocation across different wallet addresses in the blockchain network. By analyzing the proportion of tokens held by major addresses, we can assess the degree of decentralization and potential market manipulation risks in the project.
According to the current data, TARA exhibits a highly centralized holding structure. The top address (0x7233...080a1b) controls 6.12 billion tokens, accounting for 60.51% of the total supply, demonstrating an extremely high concentration. The top five addresses collectively hold 8.43 billion tokens, representing 83.29% of the circulating supply, while all other addresses combined only account for 16.71%. This distribution pattern indicates that TARA's token allocation is dominated by a small number of major holders, with limited market participation from smaller investors.
This extreme concentration presents significant implications for market stability. The dominant position of the top address means that any large-scale selling action could trigger substantial price volatility. Additionally, such centralized holding structure may provide opportunities for price manipulation by whales, potentially undermining market fairness. From a decentralization perspective, this distribution contradicts the fundamental principles of blockchain technology, suggesting that the project may still be in its early development phase or that tokens are primarily controlled by the team, investors, or specific institutional entities. Investors should closely monitor the transfer activities of these major addresses, as their on-chain behavior often serves as a leading indicator of market trends.
Click to view current TARA Token Holding Distribution
| Top |
Address |
Holding Qty |
Holding (%) |
| 1 |
0x7233...080a1b |
6123883.20K |
60.51% |
| 2 |
0xd621...d19a2c |
990141.17K |
9.78% |
| 3 |
0x7af5...61995b |
713555.81K |
7.05% |
| 4 |
0x0d07...b492fe |
326166.58K |
3.22% |
| 5 |
0x7d97...c17367 |
277194.91K |
2.73% |
| - |
Others |
1688857.92K |
16.71% |
II. Core Factors Influencing TARA's Future Price
Supply and Demand Dynamics
- Market Equilibrium: TARA's price reflects the balance between available supply and investor demand. Changes in either direction can create upward or downward pressure on valuation.
- Historical Patterns: Past market cycles have shown that periods of increased demand relative to available supply have typically supported price appreciation, while oversupply conditions have exerted downward pressure.
- Current Market Context: Supply and demand dynamics continue to play a fundamental role in shaping price movements, with market participants closely monitoring both sides of the equation.
Market Sentiment and Investor Behavior
- Sentiment Indicators: Overall market sentiment represents a significant influence on TARA's price trajectory. Positive sentiment among investors and the broader crypto community can support price stability or growth.
- Confidence Levels: Investor confidence is shaped by multiple factors including project developments, market conditions, and broader economic trends. Sustained confidence tends to correlate with more stable price performance.
- Market Psychology: Short-term price movements are often influenced by collective investor psychology and behavioral patterns within the trading community.
Macroeconomic Environment
- Economic Conditions: The broader economic landscape, including factors such as interest rates, inflation trends, and monetary policy decisions, can impact investor appetite for digital assets like TARA.
- Global Financial Markets: Conditions in traditional financial markets may influence capital flows into or out of cryptocurrency markets, affecting TARA's price performance.
- Regulatory Environment: Changes in regulatory frameworks and policy approaches toward digital assets can create uncertainty or opportunity, influencing market dynamics.
Technological Advancements
- Technical Development: Ongoing technological improvements and innovation within the project's ecosystem can support long-term value proposition and investor interest.
- Network Performance: The technical performance and capabilities of the underlying infrastructure play a role in maintaining user confidence and attracting new participants.
- Ecosystem Growth: Expansion of use cases and applications built on or integrated with the platform may contribute to sustained interest and utility.
Traders and investors on platforms like Gate.com monitor these various factors when evaluating TARA's potential price direction and making informed investment decisions.
III. 2026-2031 TARA Price Prediction
2026 Outlook
- Conservative Prediction: $0.0002 - $0.00032
- Neutral Prediction: Around $0.00032
- Optimistic Prediction: Up to $0.00035 (requires favorable market conditions and ecosystem development)
2027-2029 Mid-term Outlook
- Market Stage Expectation: TARA may experience gradual growth with potential volatility as the project continues to develop its ecosystem and expand its user base.
- Price Range Predictions:
- 2027: $0.00032 - $0.00046
- 2028: $0.00026 - $0.00055
- 2029: $0.0003 - $0.00049
- Key Catalysts: The projected price change of 51% by 2029 suggests potential growth drivers such as technological advancement, increased adoption, and broader market recovery.
2030-2031 Long-term Outlook
- Baseline Scenario: $0.00044 - $0.00048 (assuming steady ecosystem growth and stable market conditions)
- Optimistic Scenario: $0.00056 - $0.00065 (supported by strong adoption, technological breakthroughs, and favorable regulatory environment)
- Transformative Scenario: Reaching $0.00069 (requires significant ecosystem expansion, major partnerships, and exceptional market conditions)
- 2031-12-31: TARA could potentially reach $0.00069 with an 81% price change from current levels (under highly favorable conditions)
| Year |
Predicted High Price |
Predicted Average Price |
Predicted Low Price |
Price Change |
| 2026 |
0.00035 |
0.00032 |
0.0002 |
1 |
| 2027 |
0.00046 |
0.00033 |
0.00032 |
7 |
| 2028 |
0.00055 |
0.0004 |
0.00026 |
27 |
| 2029 |
0.00049 |
0.00047 |
0.0003 |
51 |
| 2030 |
0.00065 |
0.00048 |
0.00044 |
54 |
| 2031 |
0.00069 |
0.00056 |
0.00029 |
81 |
IV. TARA Professional Investment Strategy and Risk Management
TARA Investment Methodology
(1) Long-term Holding Strategy
- Target Investors: Investors who believe in IoT blockchain infrastructure development and are willing to accept high volatility
- Operational Recommendations:
- Consider dollar-cost averaging to reduce timing risk given the current price near historical lows
- Monitor technological developments in Taraxa's DAG topology and concurrent VM processing capabilities
- Gate Web3 Wallet provides secure storage solution for TARA tokens with user-controlled private keys
(2) Active Trading Strategy
- Technical Analysis Tools:
- Volume Analysis: Current 24-hour trading volume of approximately $24,000 indicates limited liquidity, requiring careful position sizing
- Price Action: Recent 24-hour gain of 7.86% against longer-term declines suggests potential short-term reversal opportunities
- Swing Trading Considerations:
- The 24-hour price range ($0.00025-$0.0003402) shows approximately 36% intraday volatility
- Low market cap of approximately $1.87 million suggests higher risk and potential for significant price swings
TARA Risk Management Framework
(1) Asset Allocation Principles
- Conservative Investors: 0.5-1% of crypto portfolio allocation given high risk profile
- Aggressive Investors: 2-3% allocation for those accepting higher volatility exposure
- Professional Investors: May consider up to 5% with active monitoring and hedging strategies
(2) Risk Hedging Approaches
- Position Sizing: Limit exposure due to low liquidity (only 3 exchanges listing TARA)
- Stop-Loss Implementation: Consider setting stops given the token's 94.41% decline over the past year
(3) Secure Storage Solutions
- Gate Web3 Wallet Recommendation: Provides self-custody solution with enhanced security features for TARA storage
- Multi-signature Setup: Consider for larger holdings to add additional security layer
- Security Precautions: Never share private keys, enable two-factor authentication, and verify contract addresses before transactions
V. TARA Potential Risks and Challenges
TARA Market Risks
- Liquidity Risk: With a circulating market cap of approximately $1.87 million and only 3 exchange listings, exiting positions may be difficult during market stress
- Volatility Risk: The token has experienced significant drawdowns, including a 94.41% decline over the past year and 31.95% drop in the last 30 days
- Market Cap Risk: Ranking at #2088 with 0.00012% market dominance indicates limited market recognition and adoption
TARA Regulatory Risks
- IoT Blockchain Classification: Regulatory treatment of IoT-focused blockchain projects may evolve, potentially impacting token utility
- Compliance Requirements: Changes in cryptocurrency regulations across jurisdictions could affect TARA's trading availability
- Token Classification: Future regulatory clarity on utility tokens versus securities may impact TARA's legal status
TARA Technical Risks
- Technology Adoption: The success of Taraxa's Block DAG topology and concurrent VM processing depends on IoT ecosystem integration
- Competition Risk: The IoT blockchain space includes various competing solutions, which may impact Taraxa's market position
- Development Risk: Continued technical development and ecosystem growth require sustained funding and team execution
VI. Conclusion and Action Recommendations
TARA Investment Value Assessment
Taraxa presents an innovative approach to IoT blockchain infrastructure with its Block DAG topology and concurrent processing VM. However, the project faces significant challenges including limited liquidity, substantial price depreciation, and low market recognition. The current price near historical lows may present opportunity for risk-tolerant investors who believe in the long-term IoT blockchain thesis, but the token's performance history and limited market depth warrant extreme caution. Only investors with high risk tolerance and ability to sustain potential total loss should consider exposure.
TARA Investment Recommendations
✅ Beginners: Not recommended due to extreme volatility, low liquidity, and high technical complexity. If considering exposure, limit to less than 1% of crypto portfolio and focus on education about IoT blockchain technology first
✅ Experienced Investors: May consider small speculative position (1-3% of crypto portfolio) with clear risk management parameters, including stop-losses and position size limits based on liquidity constraints
✅ Institutional Investors: Requires thorough due diligence on technology adoption, team credentials, and competitive landscape. Consider only as part of diversified IoT or infrastructure blockchain thesis with appropriate risk controls
TARA Trading Participation Methods
- Spot Trading: Available on Gate.com and 2 other exchanges with current price at $0.0003109
- Secure Storage: Utilize Gate Web3 Wallet for self-custody of TARA tokens after purchase
- Research and Monitor: Follow Taraxa's official channels at https://www.taraxa.io/ and https://twitter.com/taraxa_project for project updates
Cryptocurrency investment carries extremely high risks, and this article does not constitute investment advice. Investors should make prudent decisions based on their own risk tolerance and are advised to consult professional financial advisors. Never invest more than you can afford to lose.
FAQ
What is the price prediction for TARA token in 2024-2025?
TARA is projected to show growth momentum through 2025, driven by expanding IoT adoption and ecosystem development. While exact price targets remain uncertain, market fundamentals suggest upward potential supported by increasing network activity and developer adoption in the coming period.
What are the main factors affecting TARA token price?
TARA price is primarily influenced by market sentiment, overall cryptocurrency market trends, trading volume and liquidity, platform technical development, and ecosystem adoption progress.
What advantages does TARA token have compared to other Layer2 solution tokens?
TARA token offers faster transaction speeds and lower fees than competing Layer2 solutions, delivering superior user experience. Its decentralized architecture enhances security and privacy protection. TARA's innovative technology provides distinct market advantages and strong growth potential.
What is the historical price trend of TARA token and what stage is it currently in?
TARA token is currently trading at $0.000313 with a market cap of $1.89 million USD. It has shown a 2.16% increase over the past 24 hours, indicating early accumulation stage with growing market interest and trading volume momentum.
What are the risks to pay attention to when investing in TARA tokens?
TARA token investments carry market volatility risks and potential capital loss. Prices fluctuate significantly based on market sentiment and adoption. Investors should conduct thorough research and only invest what they can afford to lose.
What is TARA ecosystem development status and future plans?
TARA conducts automotive network security threat analysis and risk assessment. Current development focuses on cybersecurity threat identification and vulnerability evaluation. Future plans emphasize advanced security measures, standardized risk frameworks, and comprehensive threat mitigation strategies for connected vehicle systems.
* The information is not intended to be and does not constitute financial advice or any other recommendation of any sort offered or endorsed by Gate.